KPI DASHBOARD is an irreplaceable tool for any business manager. By collecting, grouping, organizing, and visualizing the company’s important metrics, it provides a quick overview of the company’s performance, well-being, and expected growth.
By using KPI dashboards, organizations can access their success indicators in real-time and make informed decisions that help them achieve long-term goals.
There’s a number of KPI dashboard software solutions on the market. From simple metric-tracking tools to advanced business intelligence solutions.
Finding the right KPI dashboard suitable for your company can be a headache, so we did the hard work for you and selected 21 of the best solutions on the market.
Every KPI dashboard software listed here:
- Is relatively easy to use with little setup time
- Has unique features that stand out from other KPI dashboard software
- Is by a trustworthy provider, with regular updates and high security
1. Scoro
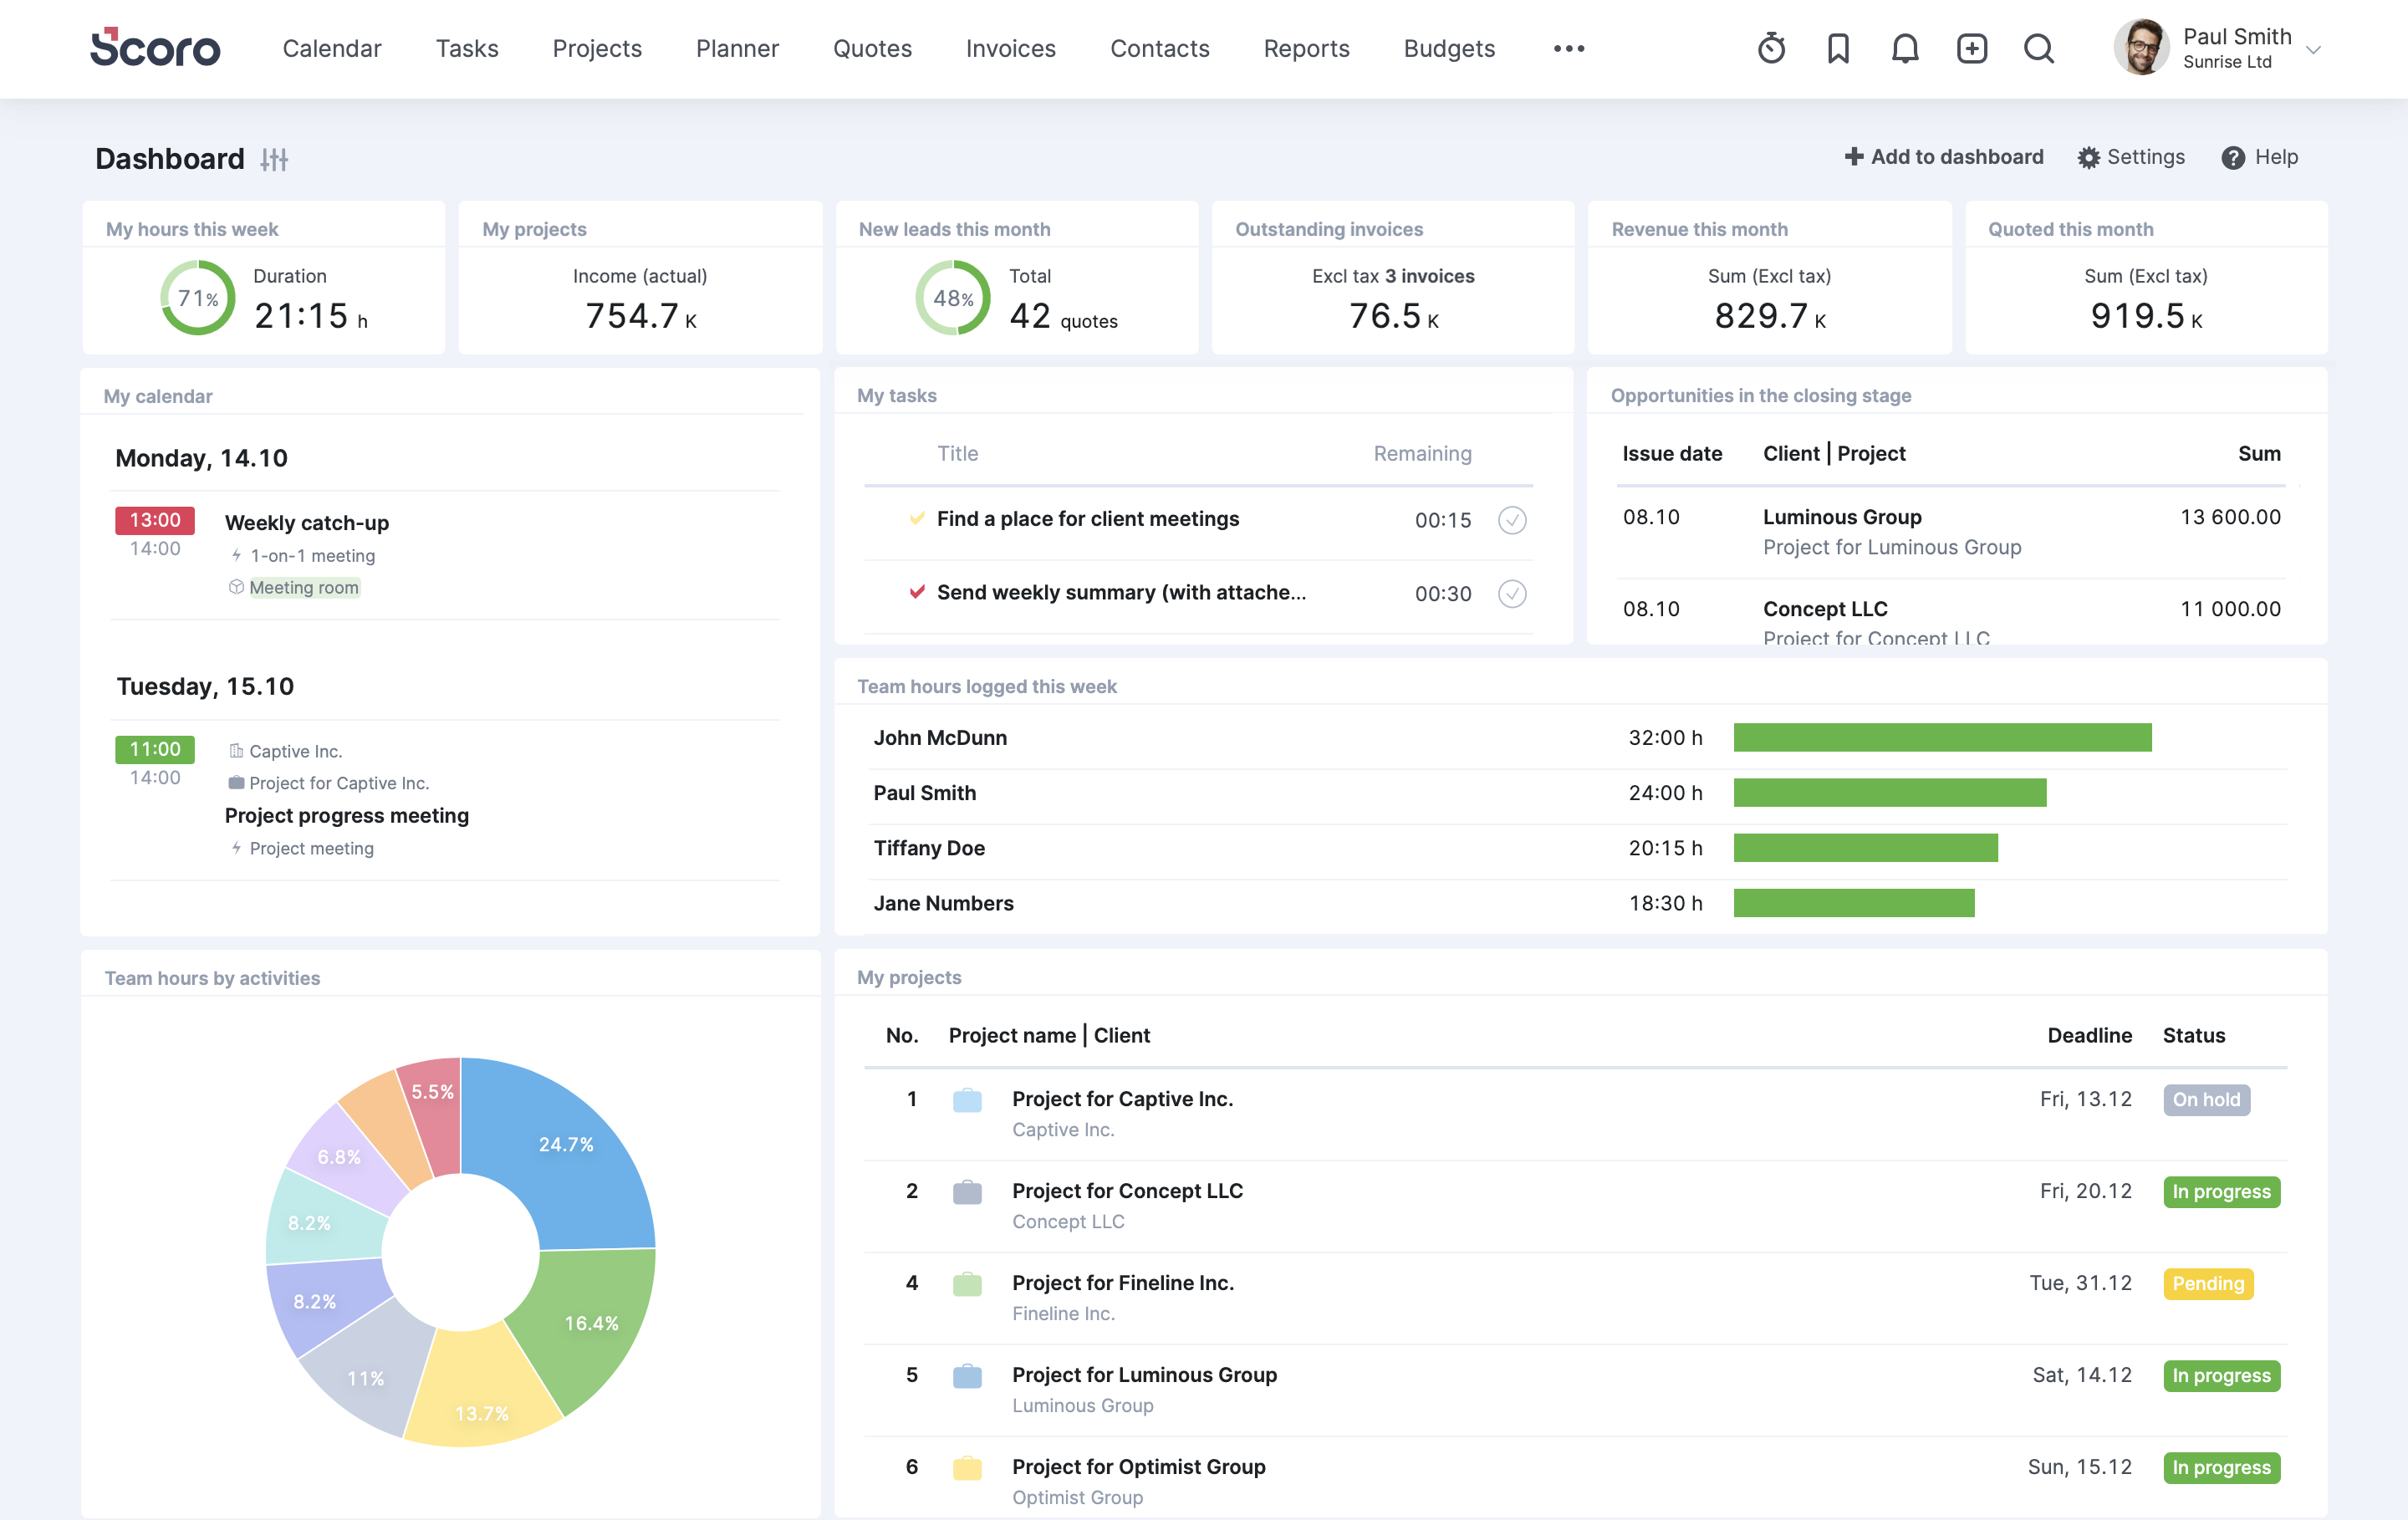
Scoro KPI dashboard software lets you oversee every aspect of your business on one (or several) dashboards – and keep track of your project, work, and financial KPIs in real time.
Top features:
- Integrate Scoro with your currently used software to track and monitor all your data in one system.
- Oversee every aspect of your company’s performance: projects, budgets, sales, forecasts, team’s performance, etc.
- Customize your dashboard with unlimited widgets, metrics, etc. to track every KPI.
- Set permissions for each user to limit access to specific information.
- Compare two periods to see trends over time.
What’s interesting about this tool: Instead of using different tools to manage work, track finances, plan projects, or compile reports, you can use a single solution – Scoro.
Pricing: From $26 user/month
2. Datapine
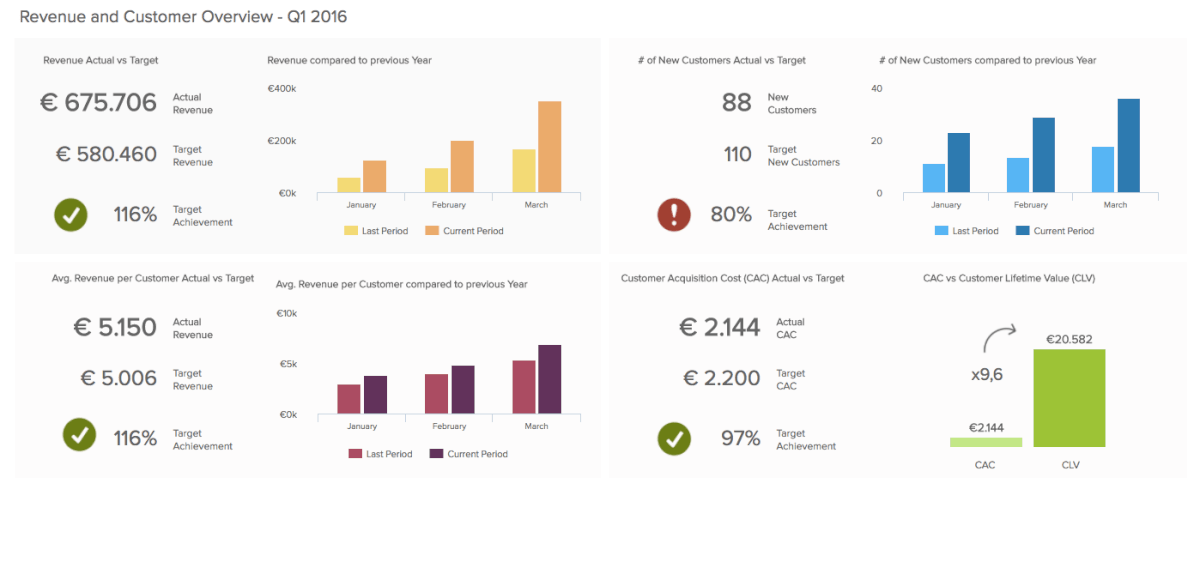
Datapine lets you visualize and monitor your most relevant KPIs in a single place.
Top features:
- Advanced analytics
- Custom formulas
- Automated reporting
- Interactive dashboards
- Intelligent alarms
What’s interesting about this tool: Datapine discovers new relationships and detect trends to take the guesswork out of your business decisions.
Pricing: From $249 month + $55 user/month
3. InetSoft
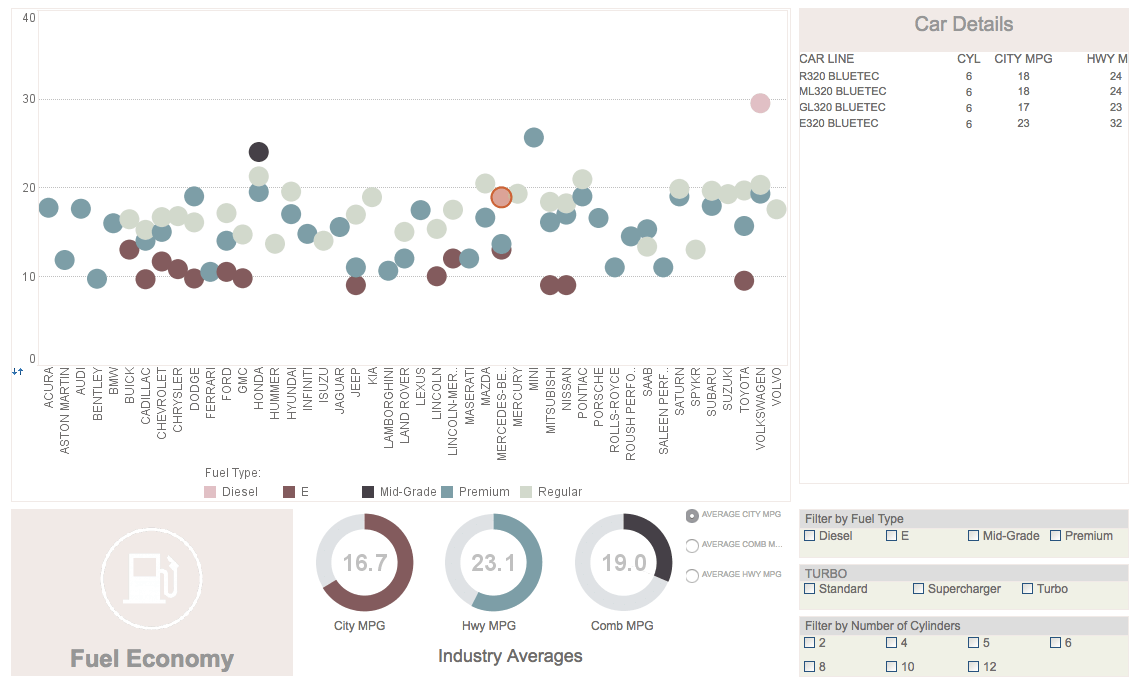
InetSoft is an analytic dashboard & reporting software backed by data mashup with big data scalability.
Top features:
- Professional atomic data block modeling
- End-user data mashup on the web
- Embedded dashboards
- Dashboard and visualization annotations
- A high-performance, secure infrastructure
What’s interesting about this tool: InetSoft is a powerful data mashup software that enables a fast and flexible transformation of data from disparate sources, which can either supplement or obviate a data warehouse solution.
Pricing: On request
4. Tableau

Tableau helps the world’s largest organizations unleash the power of their most valuable assets: their data and their people.
Top features:
- Get up and running in minutes and seamlessly add users as your needs grow.
- Automatically refresh data from web apps like Google Analytics or Salesforce.
- Give external teams, partners, and clients secure access to analytics.
- Empower site admins to easily manage authentication and permissions for users, content, and data.
What’s interesting about this tool: Tableau is an excellent solution for companies who have clients with a few users and who need to deploy solutions in multiple organizations—and who don’t have the infrastructure to create their own server installation.
Pricing: $42 user/month (billed annually)
5. SimpleKPI
Top features:
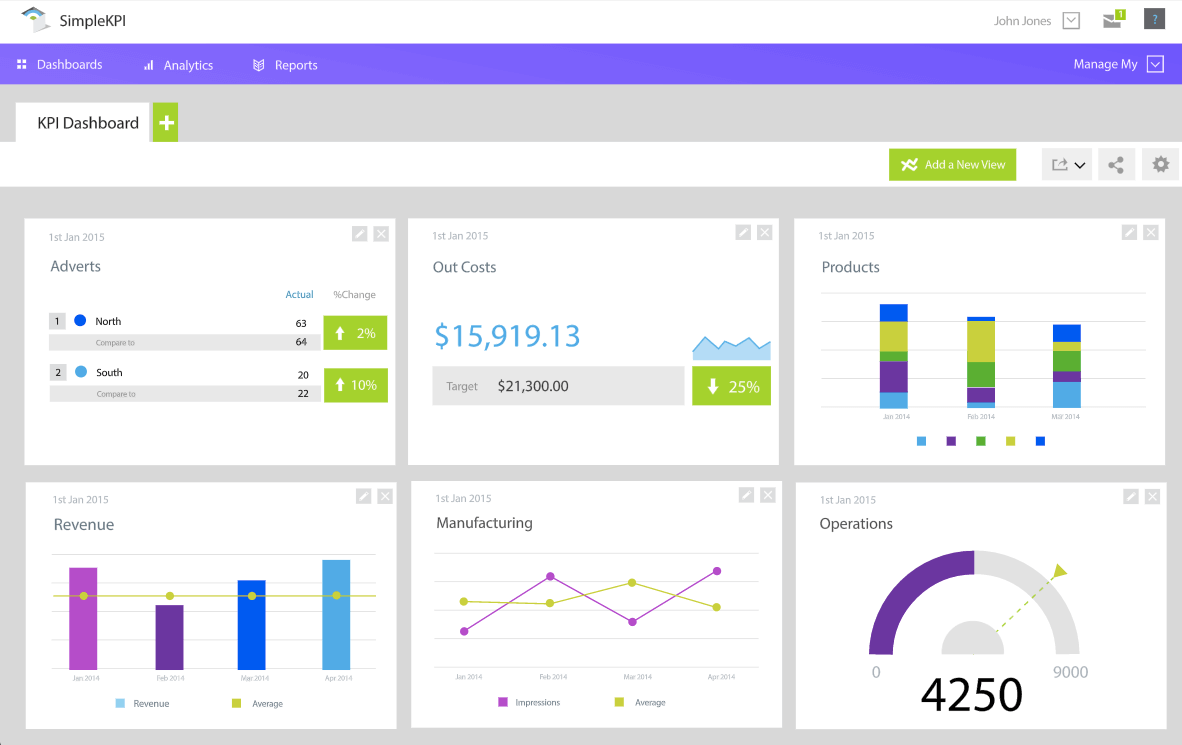
- Powerful and flexible KPI dashboards
- Standard and customizable KPI Reports
- Shareable reports, dashboards, and analytics
- Streamlined KPI analytics
What’s interesting about this tool: SimpleKPI lets you tailor your dashboards and reports to your branding.
Pricing: $109/month
6. Smartsheet
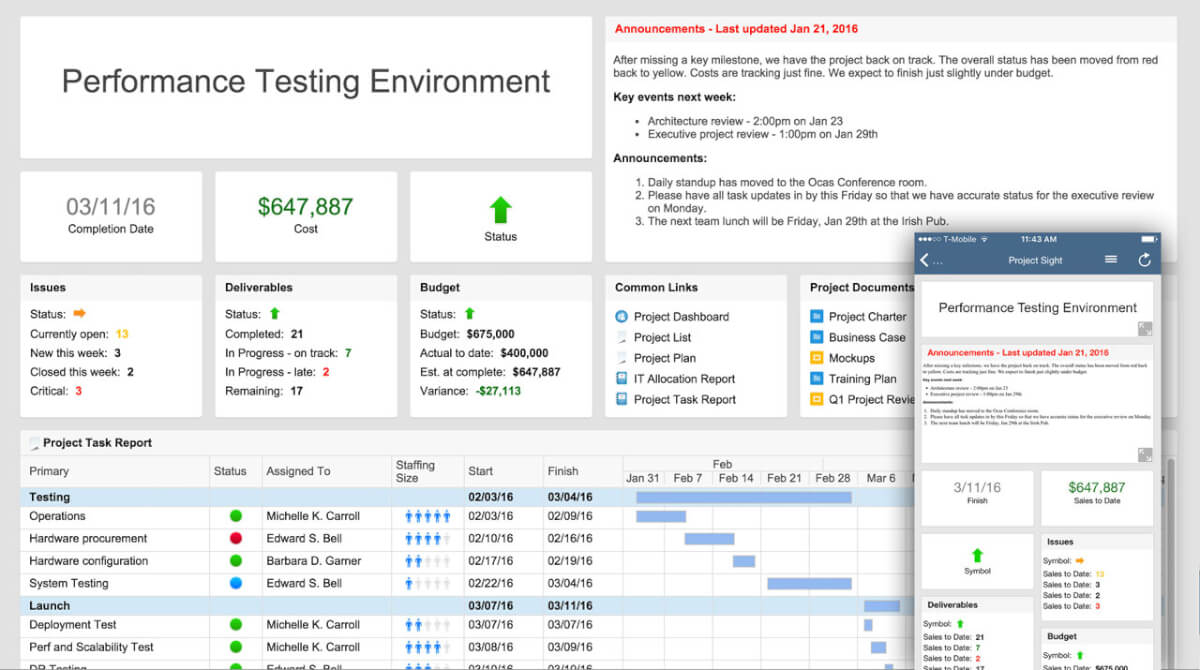
Smartsheet links with third-party apps like Tableau, Excel, Qlik Sense, QlikView, and others – allowing you to deliver powerful data visibility and insights via the tools you already use.
Top features:
- Share your work with other team members, or simply collaborate on a specific task.
- Set automated alerts to remind you (and others on your team) about upcoming tasks and approaching deadlines.
- Give teams a more visual way to work, communicate, and collaborate.
- Get a quick, visual status of their top projects, see summary reports on goals, view important deadlines, and follow links to key information.
What’s interesting about this tool: Smartsheet is trusted by over 50% of the Fortune 500.
Pricing: From $15 month/user for teams
Read more: 28 Useful Smartsheet Alternatives for Every Team.
7. Bilbeo
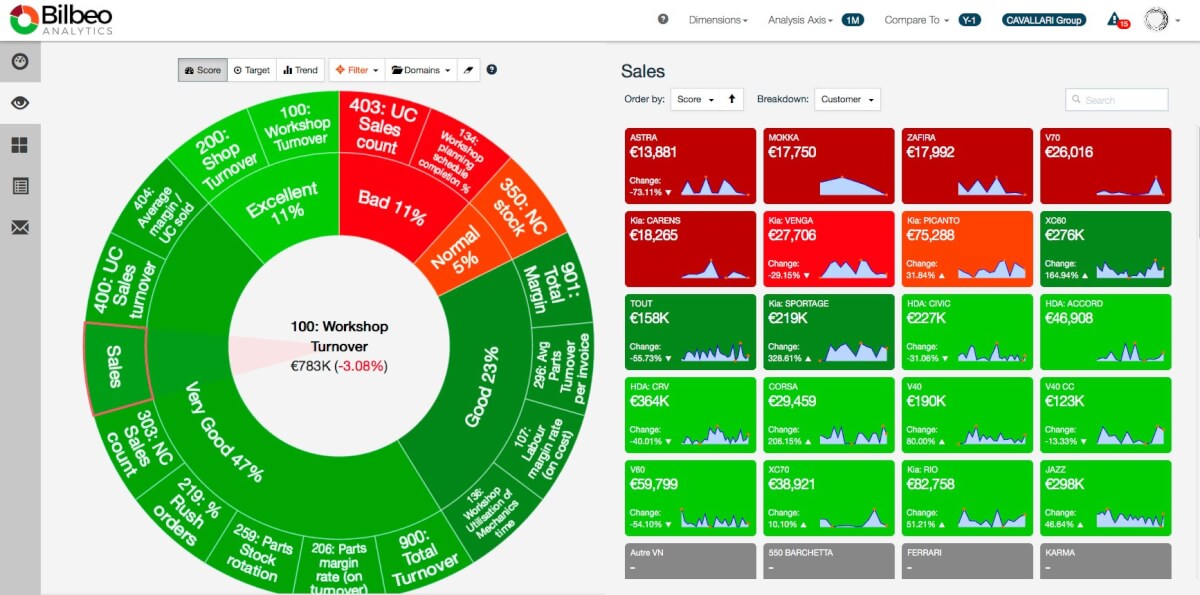
Bilbeo uses scoring and advanced data visualization to auto-populate your business dashboard with intuitive drill-down capabilities.
Top features:
- Smart alerts
- Leading indicators algorithm
- Custom reports
- Unlimited dashboards
- Collaboration
What’s interesting about this tool: No setup required from the user. No design. No coding. Just an automatic KPI dashboard that provides a unified view of your business and saves you time and effort.
Pricing: From $49 user/month
8. Target Dashboard
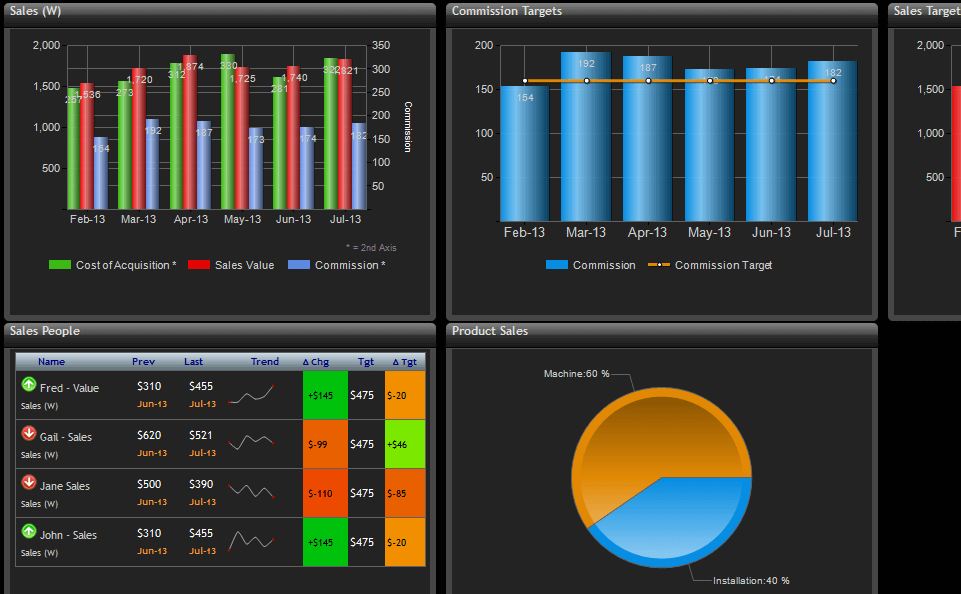
Target Dashboard connects and mixes all of your information into one place. It is powerful and proactive, delivering essential information and driving growth.
Top features:
- Progress emails warn of dangers and add accountability
- Mix data from different sources.
- Unlimited users
What’s interesting about this tool: Target Dashboard can help you modify, re-share, or summarize data to make it easy to report on.
Pricing: From $159/month
9. Databox
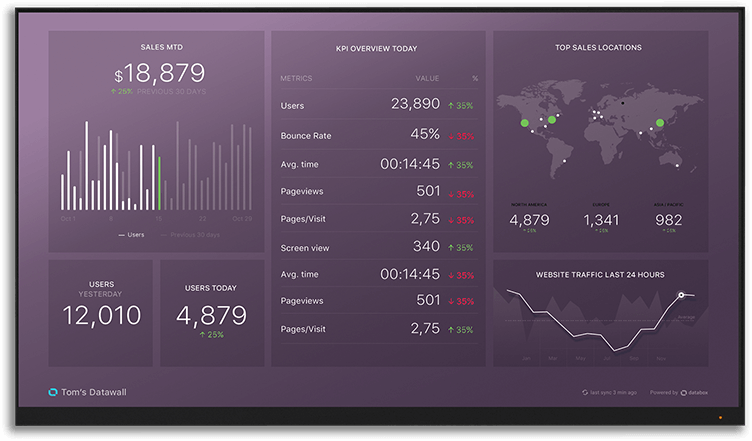
Databox gets everyone focused on the metrics that matter – in the office, the hall, or at meetings.
Top features:
- Set time-bound, numeric goals, and track progress automatically.
- Create beautiful reports with no coding required.
- Beautifully designed mobile apps
What’s interesting about this tool: Marketing agency or consultant? Automate your client reporting to stop wasting time cutting and pasting your reports together, use data to drive retention, and identify upsell opportunities.
Pricing: Free for up to 3 users, from $49 for larger teams
10. InfoCaptor
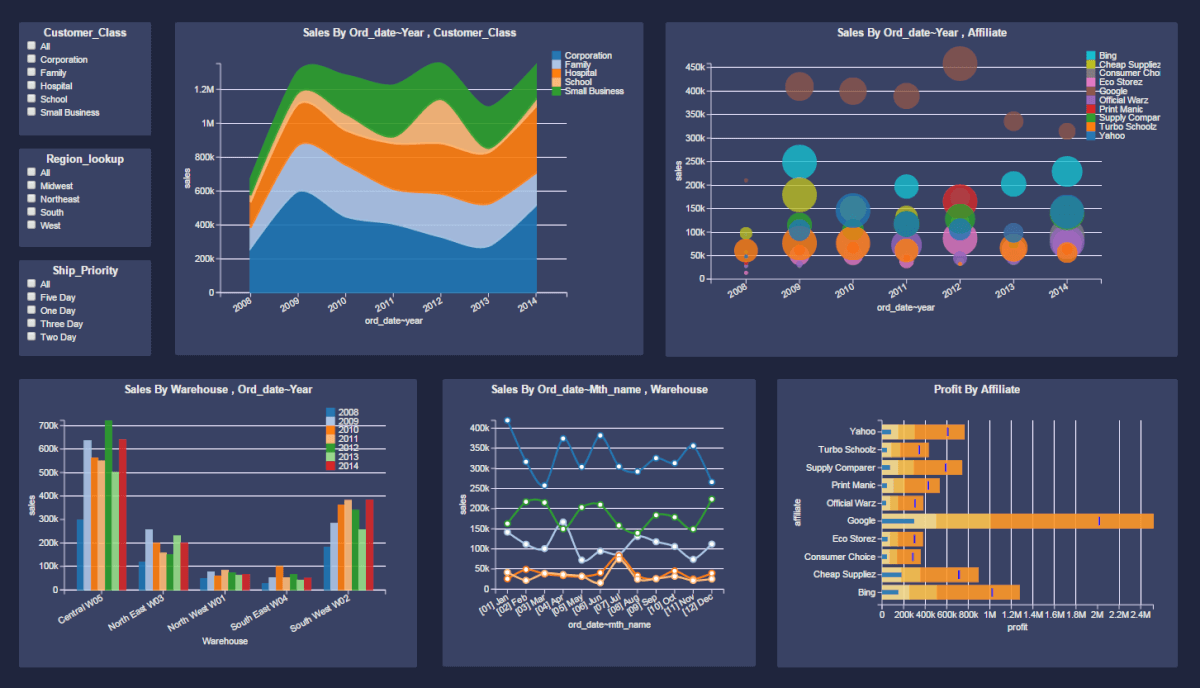
InfoCaptor lets you examine data from different angles and get the “Aha moment!”
Top features:
- Rapid analytics
- Ad-hoc visualization
- Prototyping mock-ups
- Security and data governance
What’s interesting about this tool: InfoCaptor lets you embed dashboard, or individual widgets live on any web page.
Pricing: From $29/month
11. KPI Fire
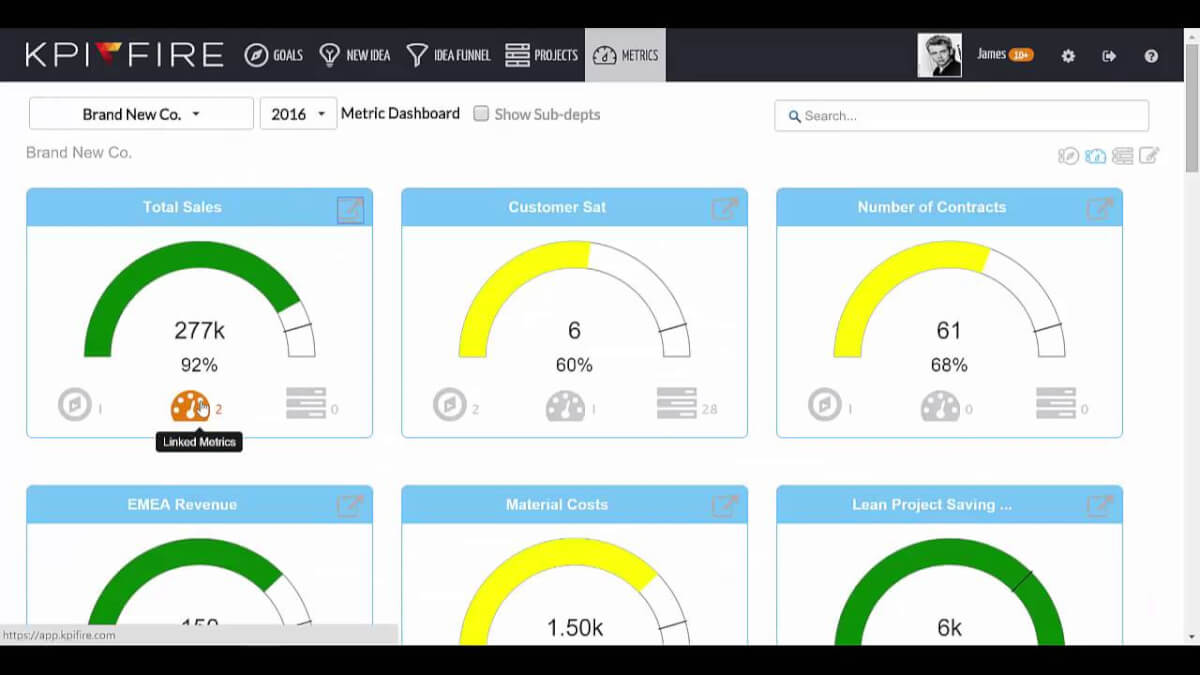
Rather than overwhelm you with features and complexity, KPI Fire makes managing your business fast and easy.
Top features:
- Align employees & projects to your strategic goals.
- Manage projects & demonstrate progress in real-time, at a glance.
- Ready to use on any device, no download required.
What’s interesting about this tool: KPI Fire lets you capture and reward everyone’s best ideas.
Pricing: On request
12. Dasheroo
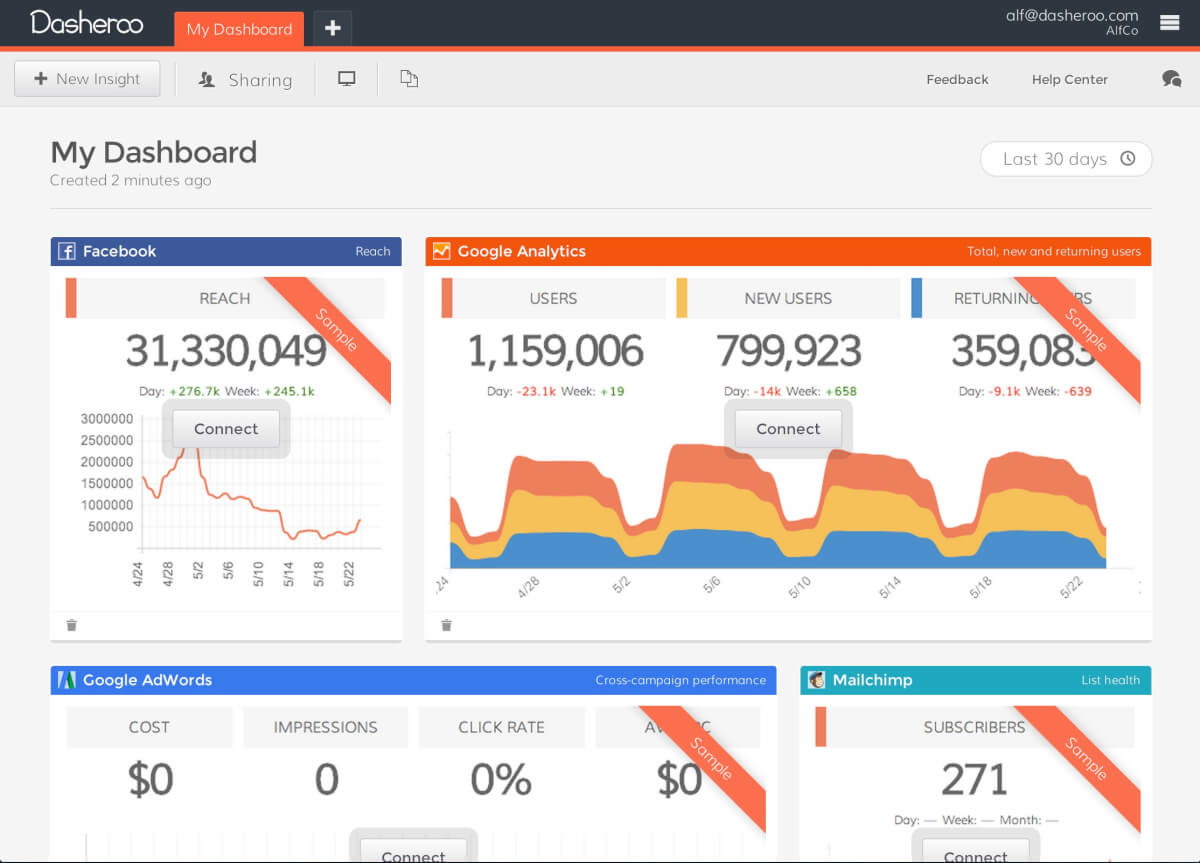
Dasheroo brings business performance metrics from all your favorite applications to one beautiful free dashboard.
Top features:
- Intelligent insights
- Metrics alerts
- Team collaboration
- Dashboard exports
What’s interesting about this tool: Sharing is caring, and productive when you’re working together across your dashboards. Comment and chat real-time right from within Dasheroo!
Pricing: Free & paid plans
13. HandyKPI
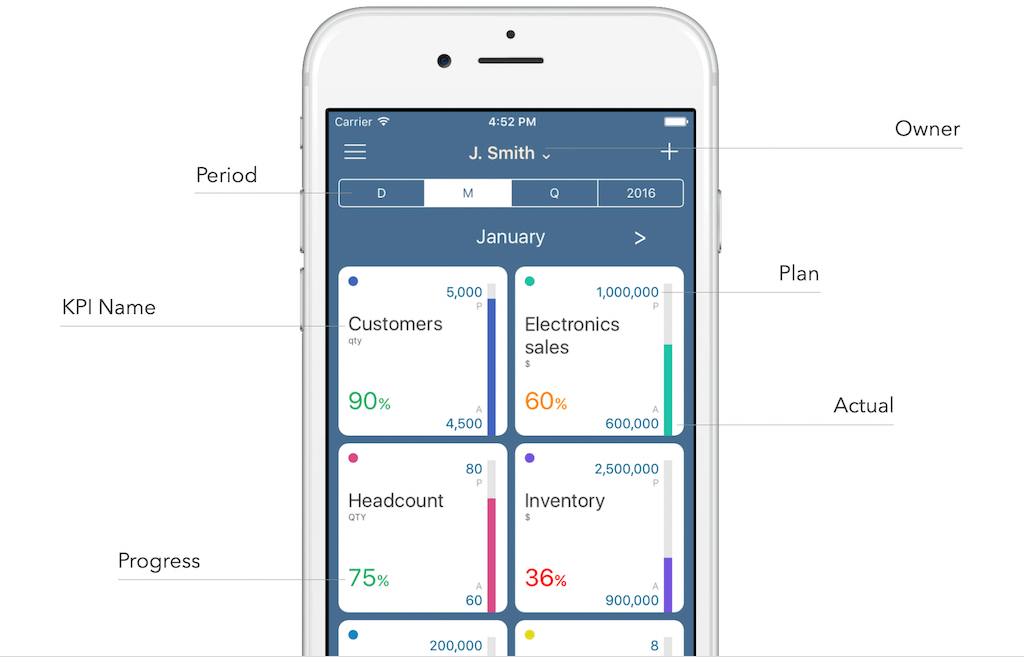
HandyKPI brings the performance of your business and team to the palm of your hand.
Top features:
- Control business KPIs in a mobile app.
- Collect or deliver KPIs to your team in seconds.
- Upload your Excel spreadsheets.
- Analyze changes over time: by days, by months, by years.
- Integrate with your software.
What’s interesting about this tool: HandyKPI is focused on mobile data visualization.
Pricing: Free for up to 3 users, $5 user/month
14. Grow
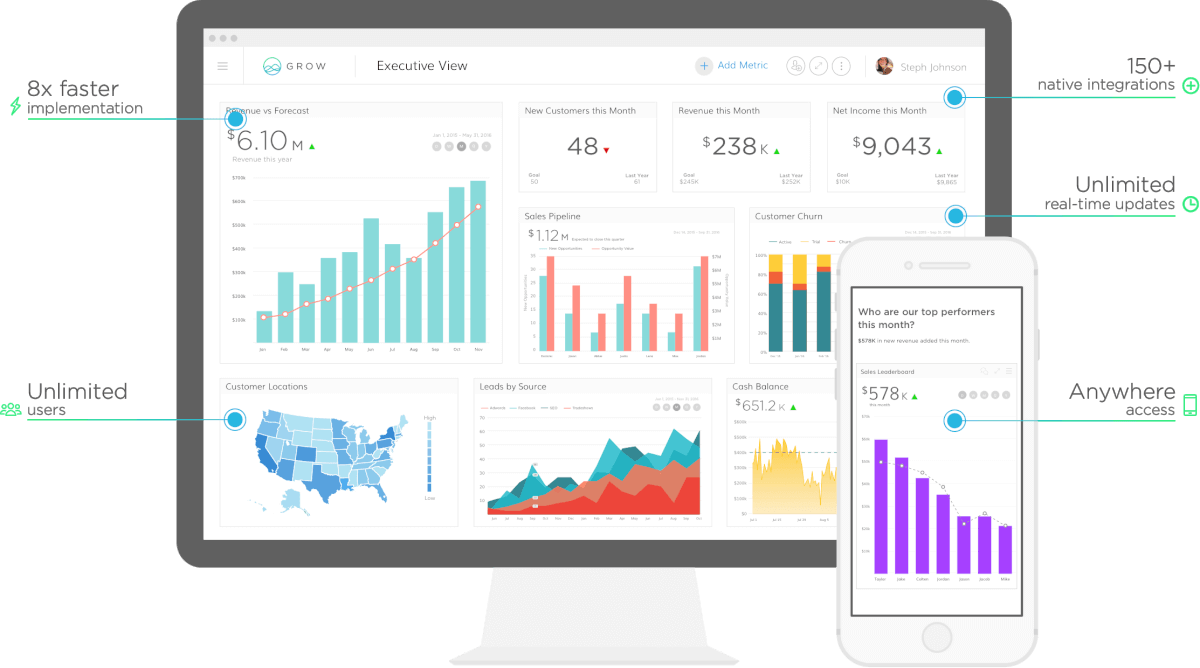
Grow is a reporting and BI dashboard software that helps to accelerate your growth.
Top features:
- Connect to your data using integrations, databases, CRMs, financials, spreadsheets, and more.
- Select the data you want to build a customized chart or add pre-built metrics to your BI dashboard instantly.
- Set the Grow timer to refresh your data.
What’s interesting about this tool: With Grow, you can get specific answers by blending, mashing, and comparing data from different sources – get insights tailored to your business.
Pricing: On Request
Read on: New Software Onboarding – The What, Why, and How
15. Sisense
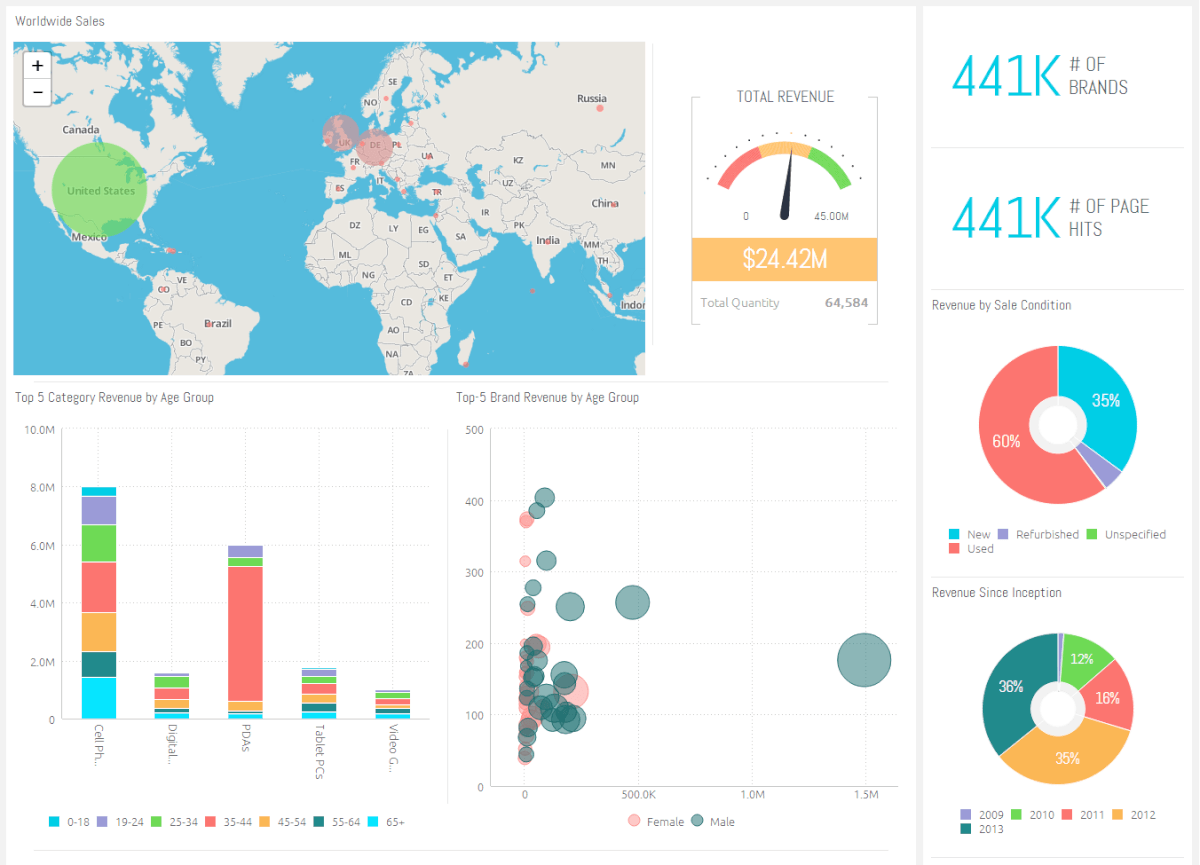
Sisense gives you the easiest way to create insights and business value from complex data.
Top features:
- Create and manage complex data models from multiple sources in a simple drag & drop environment.
- See your data come to life in interactive web dashboards with a host of visualization options.
- See immediate ROI from your BI project.
- Open platform
What’s interesting about this tool: Sisense comes with everything you need to easily prepare, analyze, and visualize complex data, saving you the need to invest in additional tools or specialized staff.
Pricing: On request
16. Klipfolio
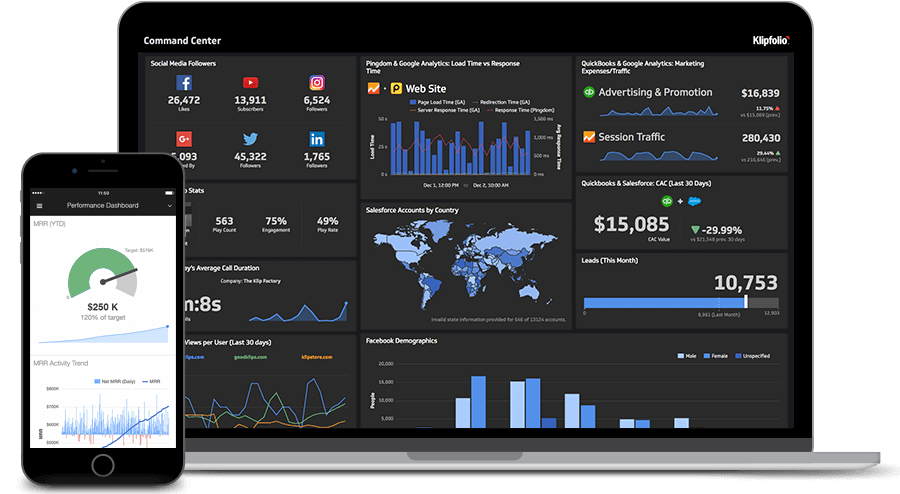
Klipfolio is a cloud app for building and sharing real-time business dashboards on web browsers, TV monitors, and mobile devices, that helps you stay in control of your business by giving you visibility into your most important data and metrics.
Top features:
- Supports direct connections to over 100 cloud applications like Twitter, Moz, Pingdom, Salesforce, Google Analytics, Xero, and more
- Pre-built data visualization
- Access your data from anywhere
- A robust data visualization editor
What’s interesting about this tool: Many of the custom metrics you need for your dashboard will require some math. Unlike many dashboard solutions, Klipfolio gives you the ability to do the math you need to create meaningful dashboards.
Pricing: From $24 / 5 users
Check out this Klipfolio alternative!
17. Zoho Reports
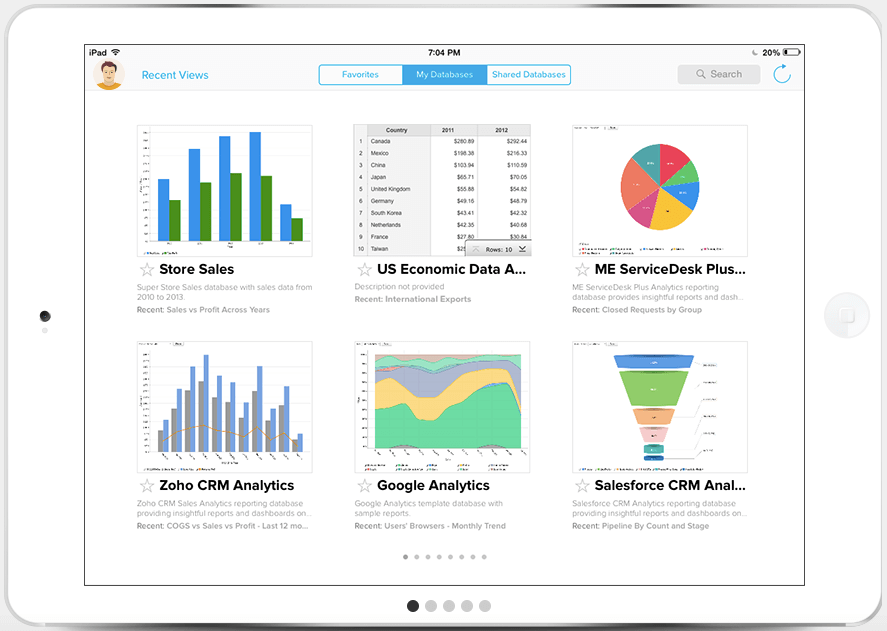
Zoho Reports is a BI and analytics solution that allows you to create insightful reports and dashboards.
Top features:
- Connect to any data source.
- Visual analysis
- Sharing and collaboration
- White labeling
- Scalable BI platform
What’s interesting about this tool: Zoho Reports is governed by strong Zoho Security Practices, including support for redundancy, backup, confidentiality & privacy to help ensure your data is secure & safe.
Pricing: From $55 / month (5 users)
Check out this Zoho Alternative and 21 best Zoho Alternatives for business management!
18. Geckoboard
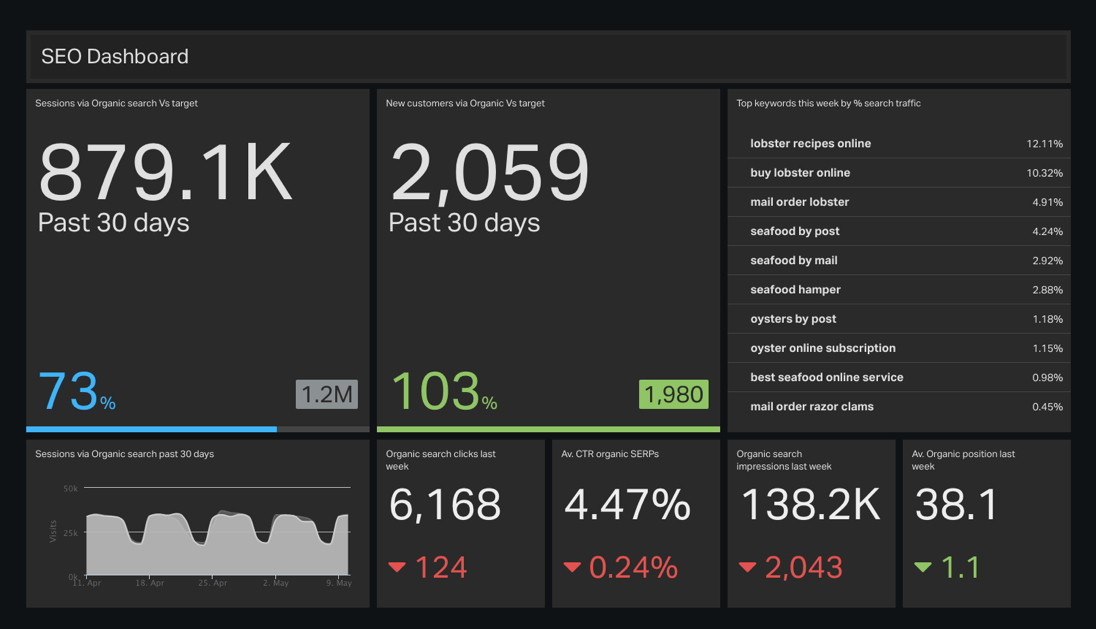
Geckoboard lets you broadcast live business metrics, KPIs, and goals to your team in an easy-to-understand way.
Top features:
- Pull live metrics from popular business tools into Geckoboard without any technical know-how
- Effortlessly turn data tracked in a Google Sheet or Excel file into live visualizations
- Visualize metrics from databases, in-house systems, and third-party software
- Quickly share a link to your dashboard in an email or chat
What’s interesting about this tool: Geckoboard is optimized for your office wall – build a TV dashboard in minutes using a drag-and-drop interface.
Pricing: From $25 user/month
19. iDashboards
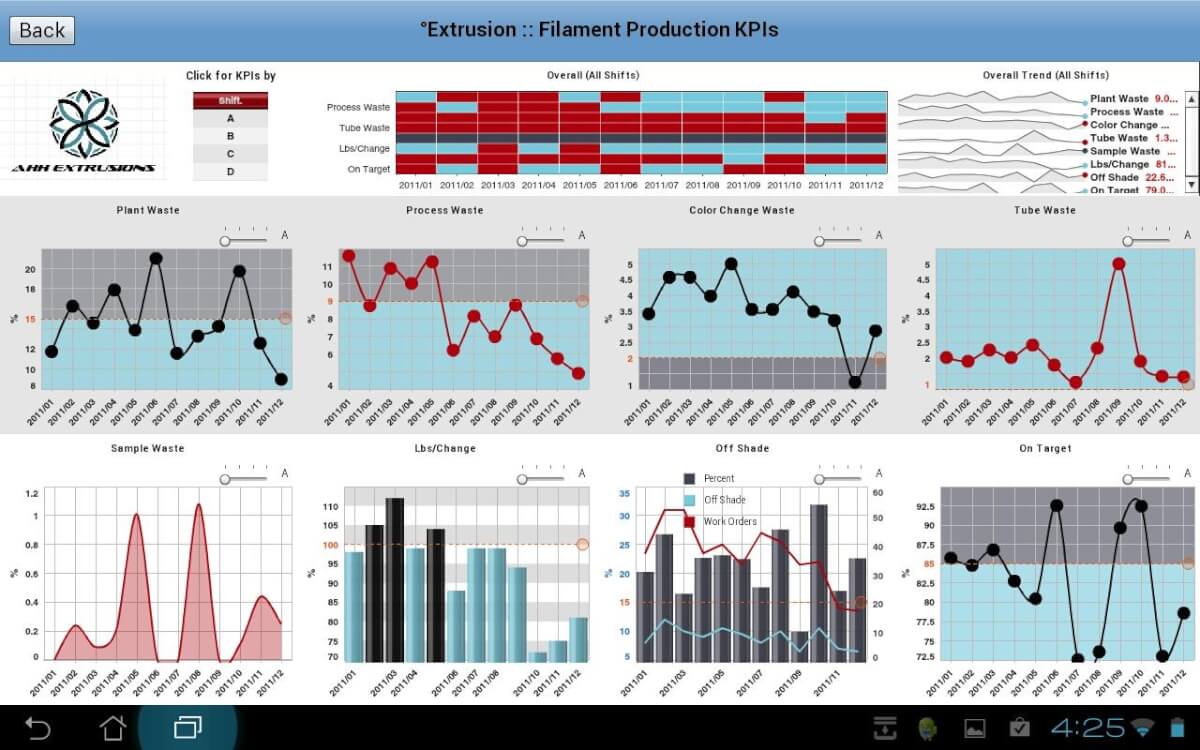
iDashboards business intelligence software lets you build interactive, custom dashboards with a simple drag-and-drop tool.
Top features:
- Create dashboards with custom charts and graphs.
- Interact with every layer of data, ask and answer their own questions.
- Build charts using a mix of data sources in a single dashboard, and spot hidden trends at a glance.
What’s interesting about this tool: iDashboards has real-time email and text alerts, so you can stay on top of your metrics whenever or wherever you are.
Pricing: From $29.95 user/month (billed annually)
20. Scoreboard
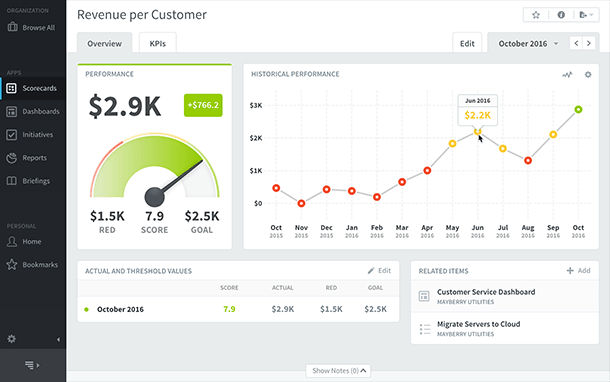
Scoreboard tracks your key performance indicators with dashboards, reports, and alerts.
Top features:
- Track KPIs.
- Share with anyone.
- Earned value management
- Prebuilt and custom reports
- Alerts
- Presentations
What’s interesting about this tool: Scoreboard works great on all screen sizes, from your cell phone to your boardroom projector.
Pricing: From $55 user/month
21. Ubiq
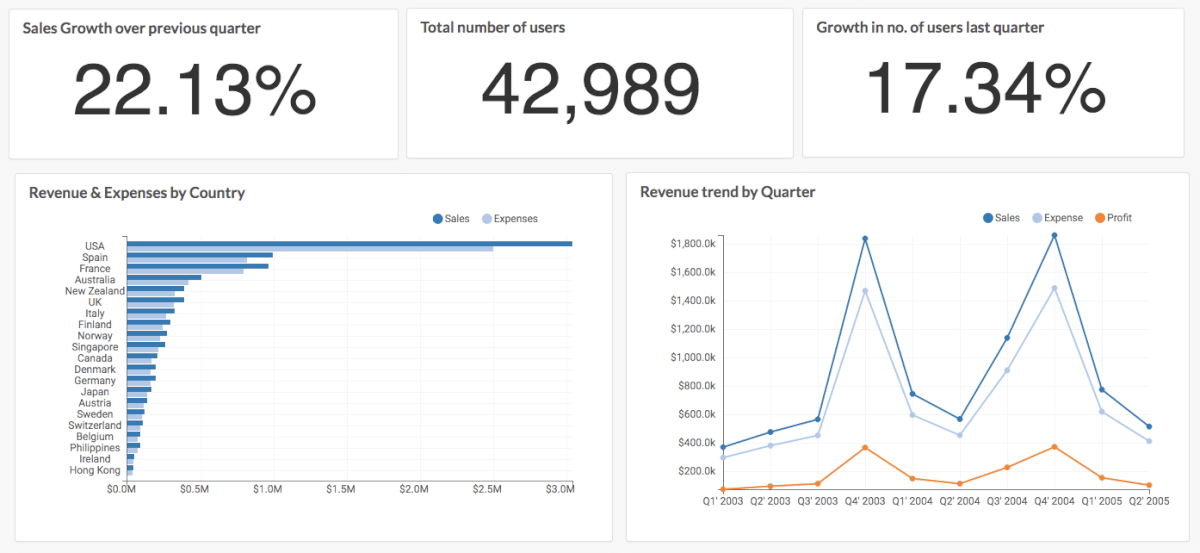
Ubiq is a web-based reporting tool for MySQL, PostgreSQL database that makes it easy to analyze business data.
Top features:
- Unlimited databases and charts
- Drag & drop chart creator and report designer
- Custom formula/variables
- Export as PDF/CSV/image
What’s interesting about this tool: Ubiq is easily customizable, to change a dashboard theme, just select an option from the dropdown of dashboard themes.
Pricing: From $18/month

