Between workload management, scheduling team resources efficiently, preventing overservicing, and more, operations managers have a lot keeping them busy.
Are you still juggling all of that in spreadsheets?
Because if so, you deserve better.
A capacity planning tool can help you accurately predict project volume, understand utilization and capacity, and optimize resources.
Which tool is right for you? We’ve tested some of the top tools and are here to show you the best.
What is a capacity planning tool?
A capacity planning tool is software that helps businesses forecast future resource needs and plan to have enough capacity to meet demand.
Capacity management software will help you:
- Predict client demand and project volume in the future (e.g. forecasting you will take on X number of new projects next quarter)
- Assess if you have enough team members, consultants, creative resources, and support bandwidth to handle the predicted workload
- Continuously monitor workloads and adjust consulting/creative/support resources needed as client demand fluctuates
- Make informed staffing, hiring, and subcontracting decisions to scale up or down to meet demand
Features to look for when researching capacity planning tools
This will depend on your needs. Generally, consultants should consider the following criteria when choosing the best project management software:
- Resource forecasting: Ability to predict future workload and resource needs driven by historical data
- Capacity analysis: Identify gaps where demand exceeds available capacity
- Utilization tracking and optimization: Visibility into resource utilization rates to identify bottlenecks
- Reporting: Visual dashboards and views comparing capacity to demand forecasts.
- Integrations: Connectors to client management, documentation, and financial tools commonly used by consultancies
7 capacity planning tools to consider
Let’s take a look at some of the best tools for capacity planning.
1. Scoro
Scoro is an all-in-one professional services automation platform with robust resource management and capacity planning capabilities.
Central to workload optimization is Scoro’s “Planner “tool for distributing tasks across teams based on availability and utilization rates.
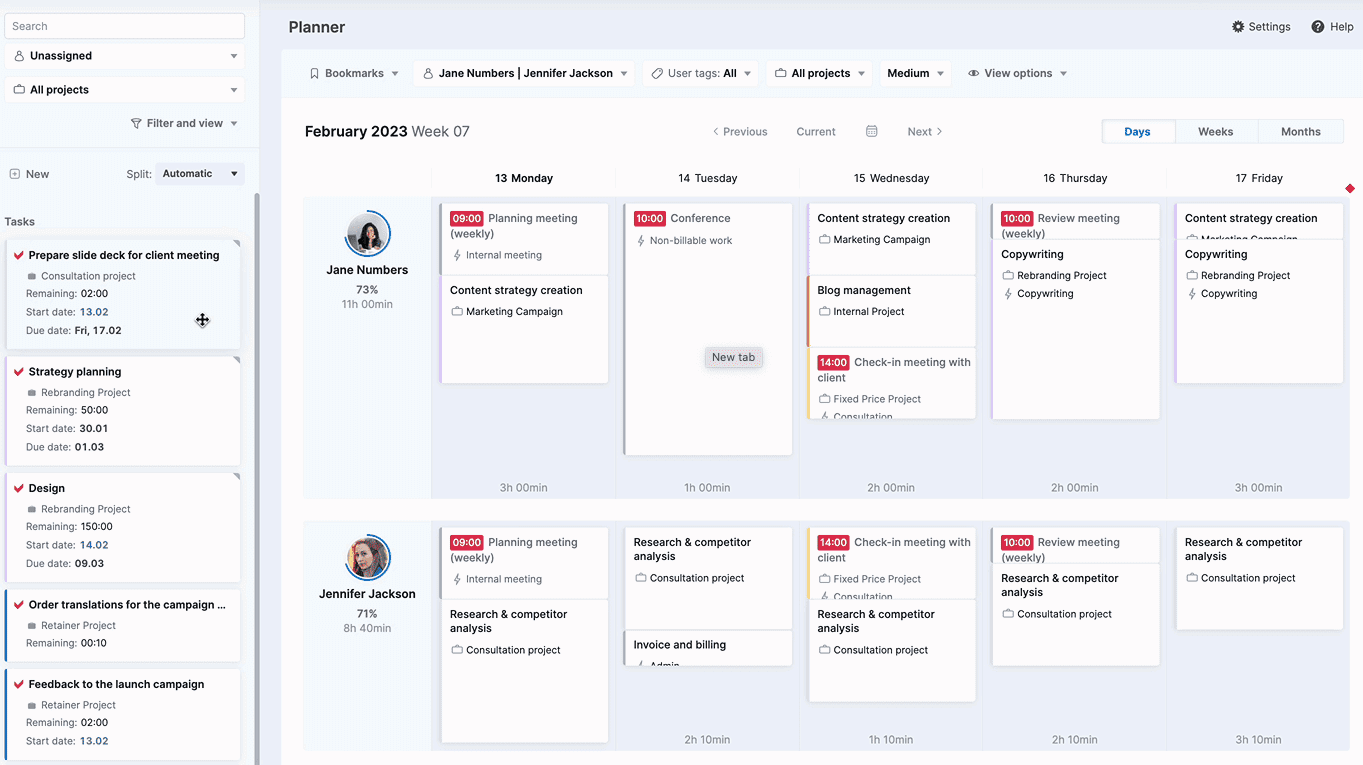
The “Planner” provides an overview of your team’s schedules, availability, and capacity to easily assign work and balance utilization. Toggle between “Days,” “Weeks,” and “Months” views to understand how your team’s capacity develops over the long term.
It is divided into two sections – unassigned tasks on the left panel and a calendar view of your team’s schedules on the right.
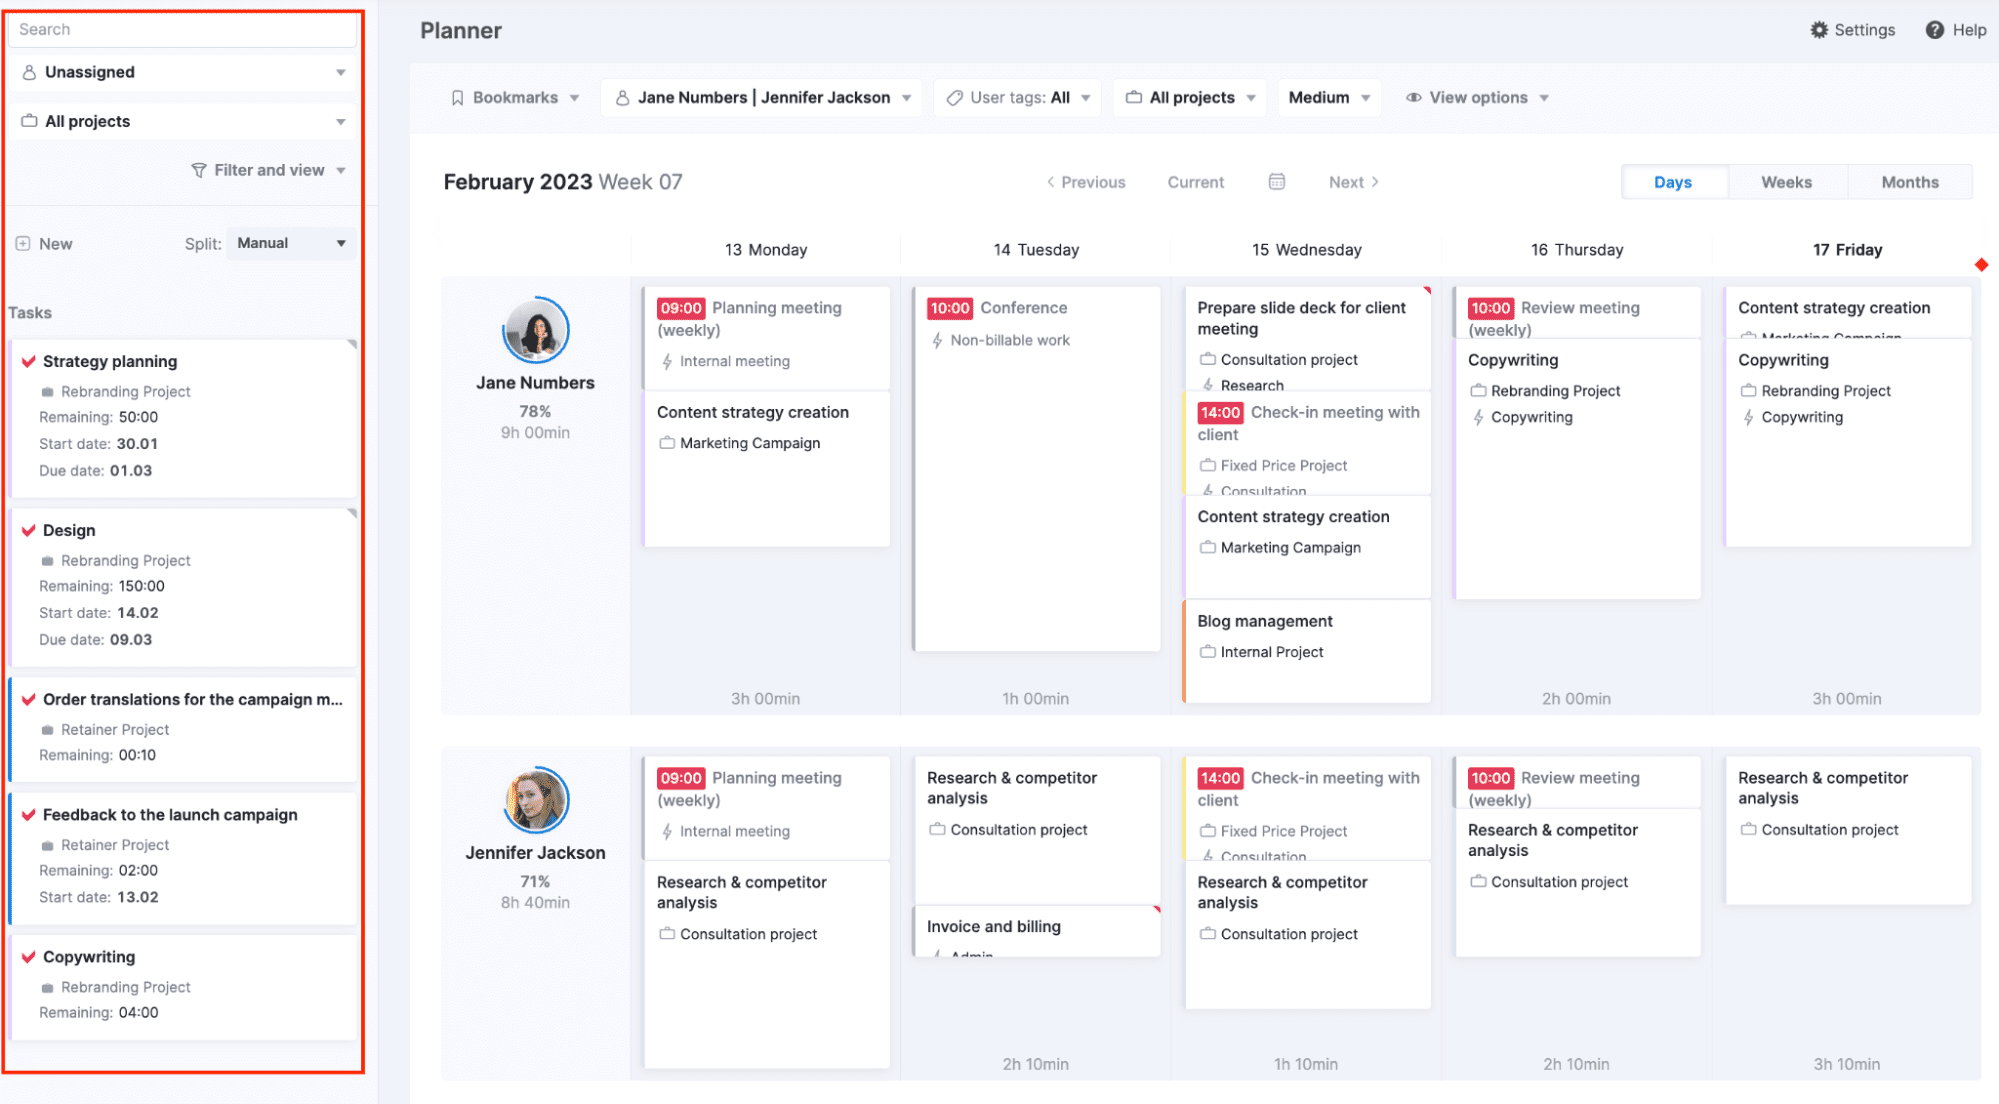
Assigning tasks on the Planner view is as easy as dragging and dropping the tasks from the unassigned panel onto a team member’s schedule. Break the tasks into as many chunks as needed and create a lot of granularity, or stick with high-level planning for ongoing retainers.
A progress circle around each user’s profile photo gives an at-a-glance look at their current availability, ensuring you always have a clear picture of current and future team capacity.
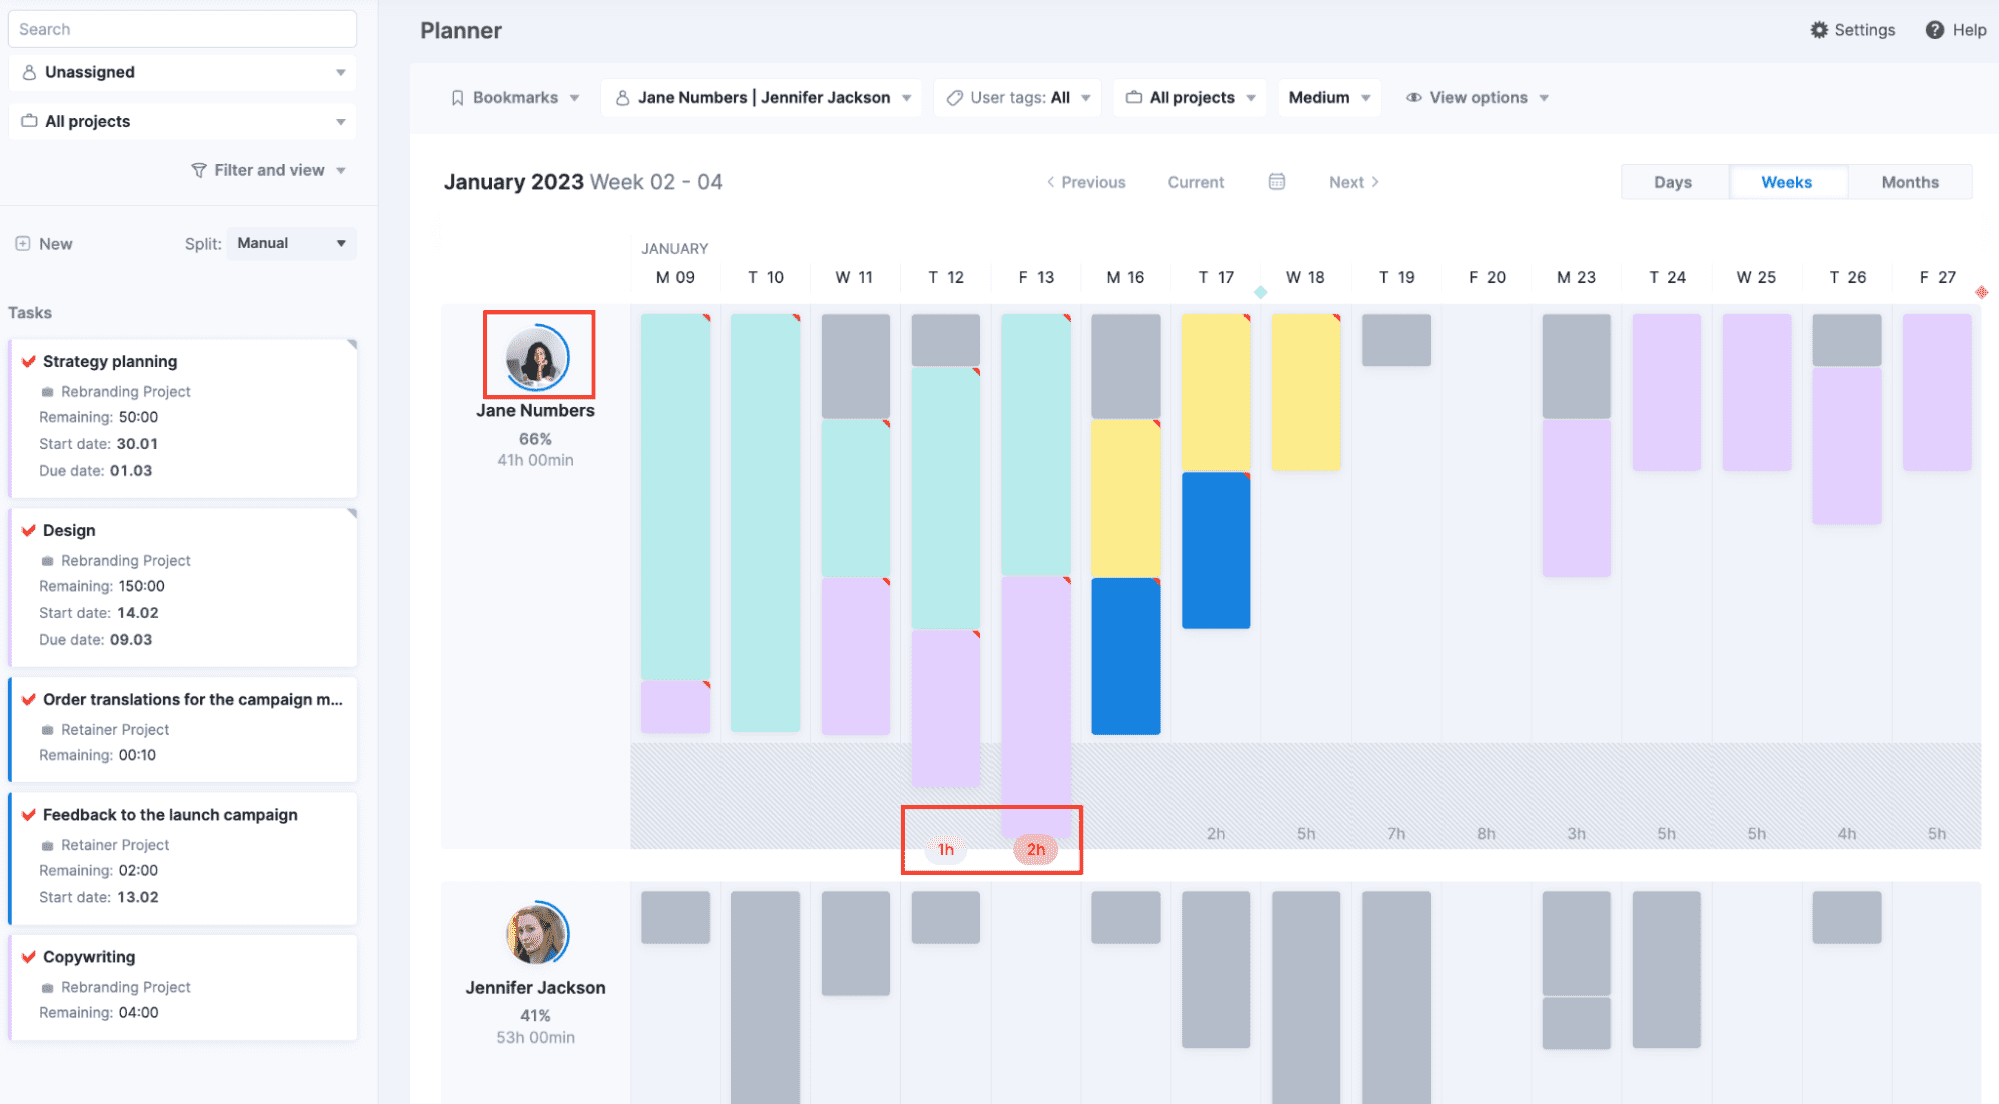
Filters allow capacity analysis by the user, skill set, project types, or other attributes. With user tags, you can filter for specific skills to assign work accordingly.
Scoro’s dedicated “Utilization report” compares historical and projected workloads over custom periods like days, weeks, or months to forecast upcoming demand versus capacity.
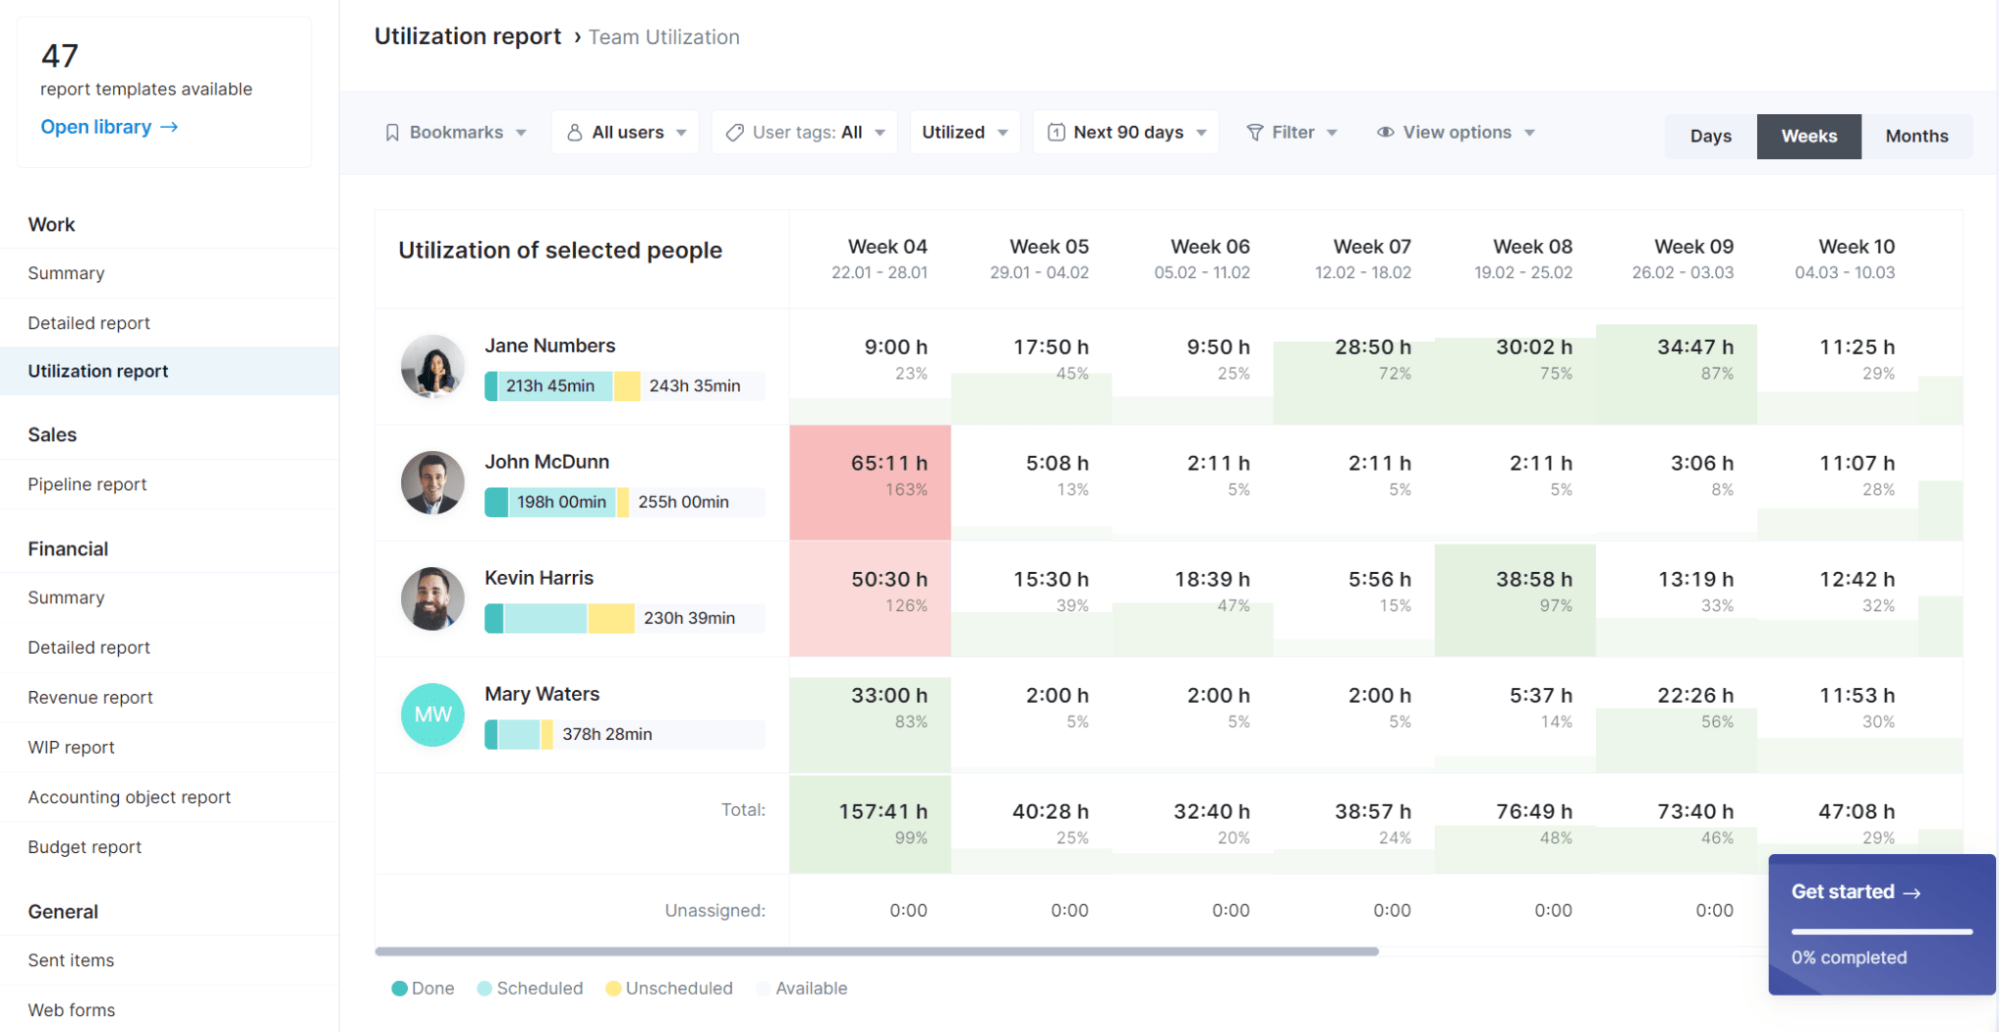
The “Utilization report” uses color coding and progress bars to indicate over- and under-utilization rates for easy visibility into current and future gaps.
It incorporates a demand forecast based on task timelines to provide visibility into potential future utilization.
Filter the granular view by time, users, projects, and other attributes to analyze where capacity falls short of demand.
Sorting by skill set allows you to see if you can re-allocate work from over-utilized team members to similar team members with availability. If not, you can make smart hiring decisions based on actual or forecasted needs.
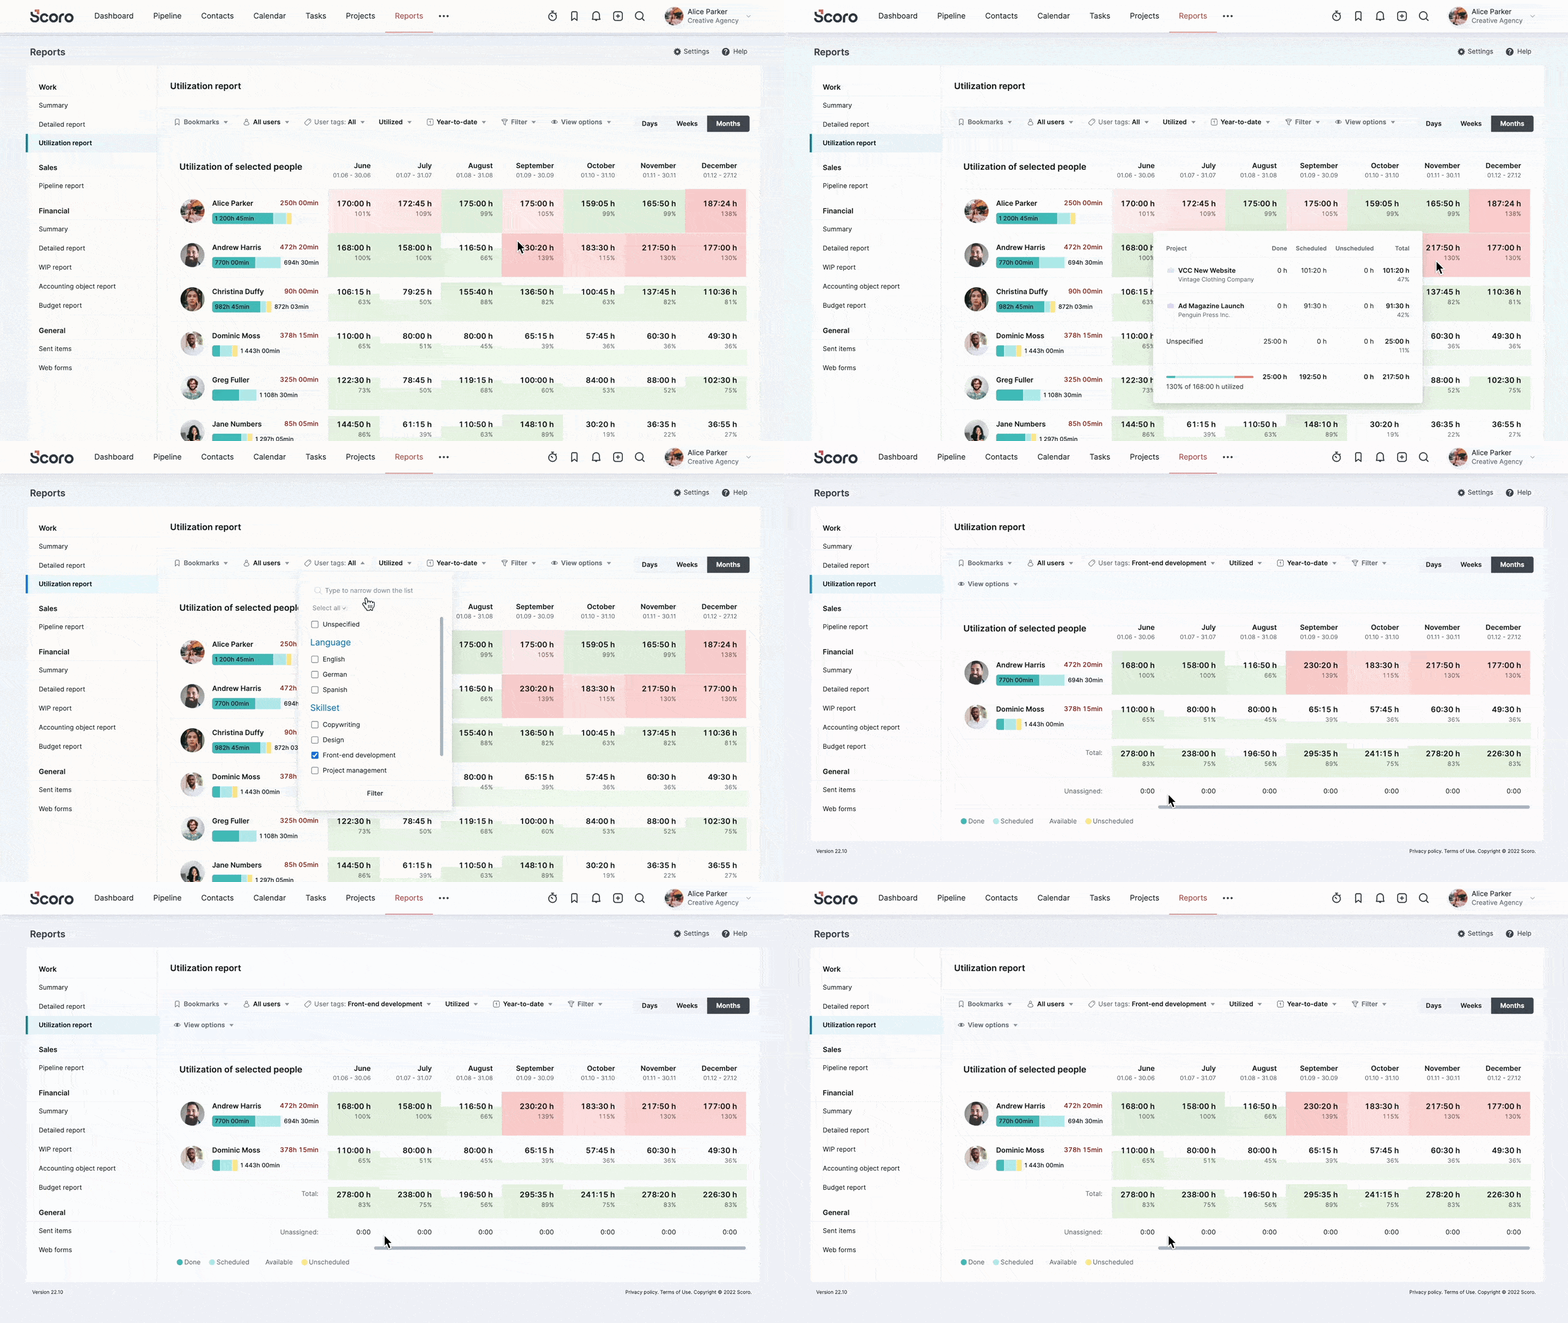
With reporting for capacity and utilization for historical and current data and future forecasting, you have everything you need to make smarter, data-driven decisions about project volume, team bandwidth, hiring, and more.
What you’ll love
Scoro’s “Reports Library” has everything you need to address overservicing, low profit margins, and poor resource allocation.
Operations managers will love the “Detailed” work report. This report allows you to drill down further into resource utilization and efficiency.
To see utilization details, go to “View” and then check the box for “% of utilization.” Then, group the list of work by “Weeks” or “Months.” Finally, set your secondary grouping option to “Users.”
You’ll be able to see all of your team members and their weekly utilization calculated based on tracked hours vs. available hours.
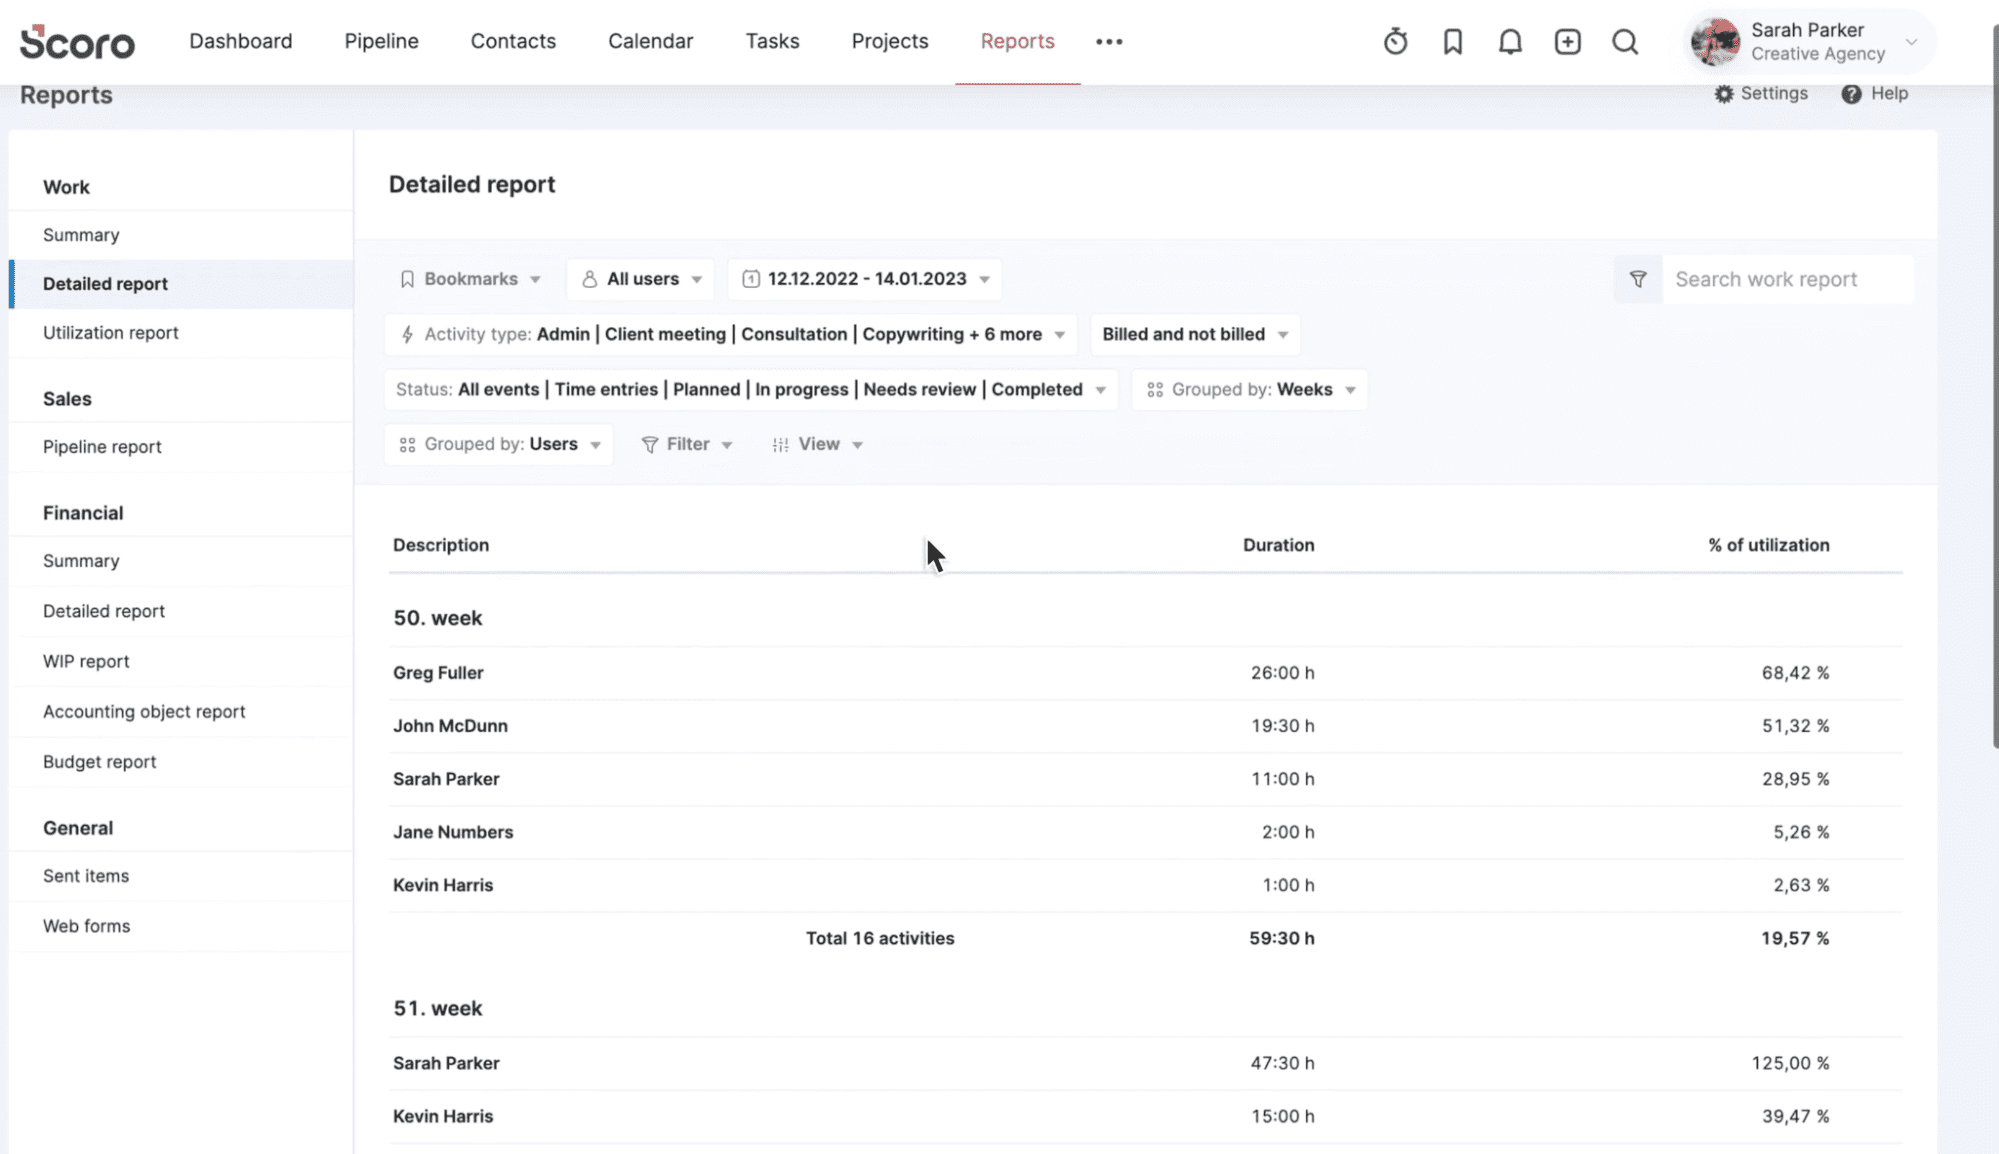
This makes it easy to see who’s overworked and who’s underutilized. You can also add filters to see utilization percentages for billable vs. non-billable tasks to ensure your team’s time is going toward the highest profitability tasks.
Or group by “Users” and then “Activity Types” to drill down even further into exactly where each team member is spending their time.
You’ll also find report templates for:
- Time usage by project
- Profitability by project or client
- Margin by project
- Pipeline forecast by upcoming months
- Team availability by upcoming months
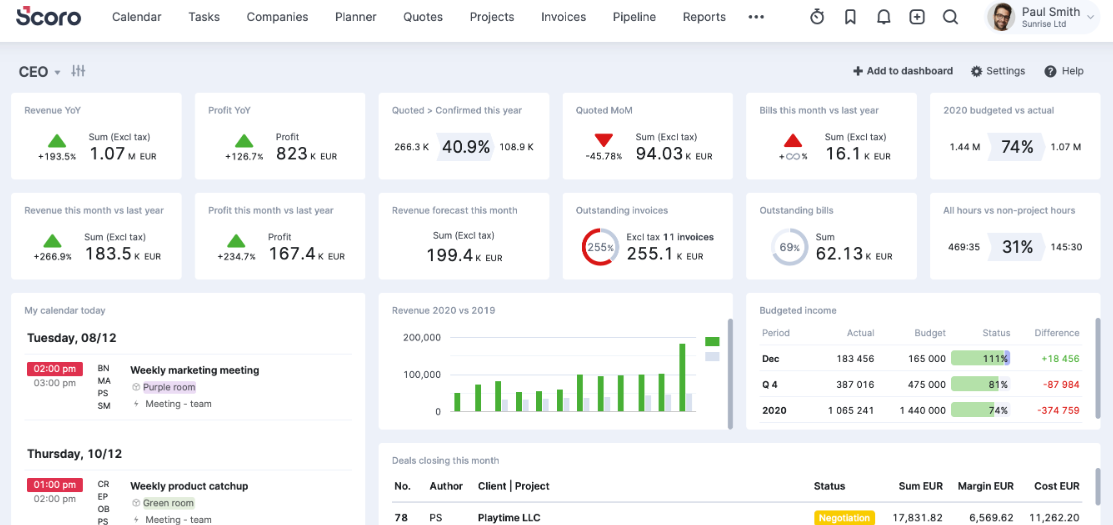
You can also build your own dashboards. feat. CEO Attila Probáld said that before Scoro, “we tracked revenue, cost, and margin. Now, we track much more data and can easily create dashboards and forecasts depending on our needs — almost everything is measurable!”
As a result, they were able to grow their agency from €0 to €550k while saving an hour per day per employee on internal work.
For example, here’s what Scoro’s default CEO dashboard looks like:
Core features
- Resource planning tools allow you to understand resource needs and optimize utilization now and in the future
- Utilization reports and metrics show you exactly who needs more work, who’s overworked, and when future capacity gaps might occur
- Utilization forecasting helps you estimate future utilization, letting you know when you should take on additional projects
- Time tracking provides accurate insight into where your team’s time actually goes for more accurate forecasting and profitability reporting
- Real-time reporting keeps your team productive and profitable to understand capacity, optimization, and more
- Integrations with other communication, documentation, CRM, and financial tools ensure everything stays aligned and up-to-date
Pricing
Scoro has four plans:
- Essential: $26 per user per month
- Standard: $37 per user per month
- Pro: $63 per user per month
- Ultimate: customized enterprise pricing
You can try Scoro free for 14 days.
2. ResourceGuru
ResourceGuru offers visual and easy-to-use capacity planning and resource management tools to help you monitor your team’s availability, utilization, and optimization.
From the “Schedule” view, get at-a-glance visibility into your team’s workloads. Each team member has their own row where you can quickly monitor or adjust upcoming work.
The thin green or red capacity bars at the top of each column show who’s overbooked (red) and who has more capacity (green).
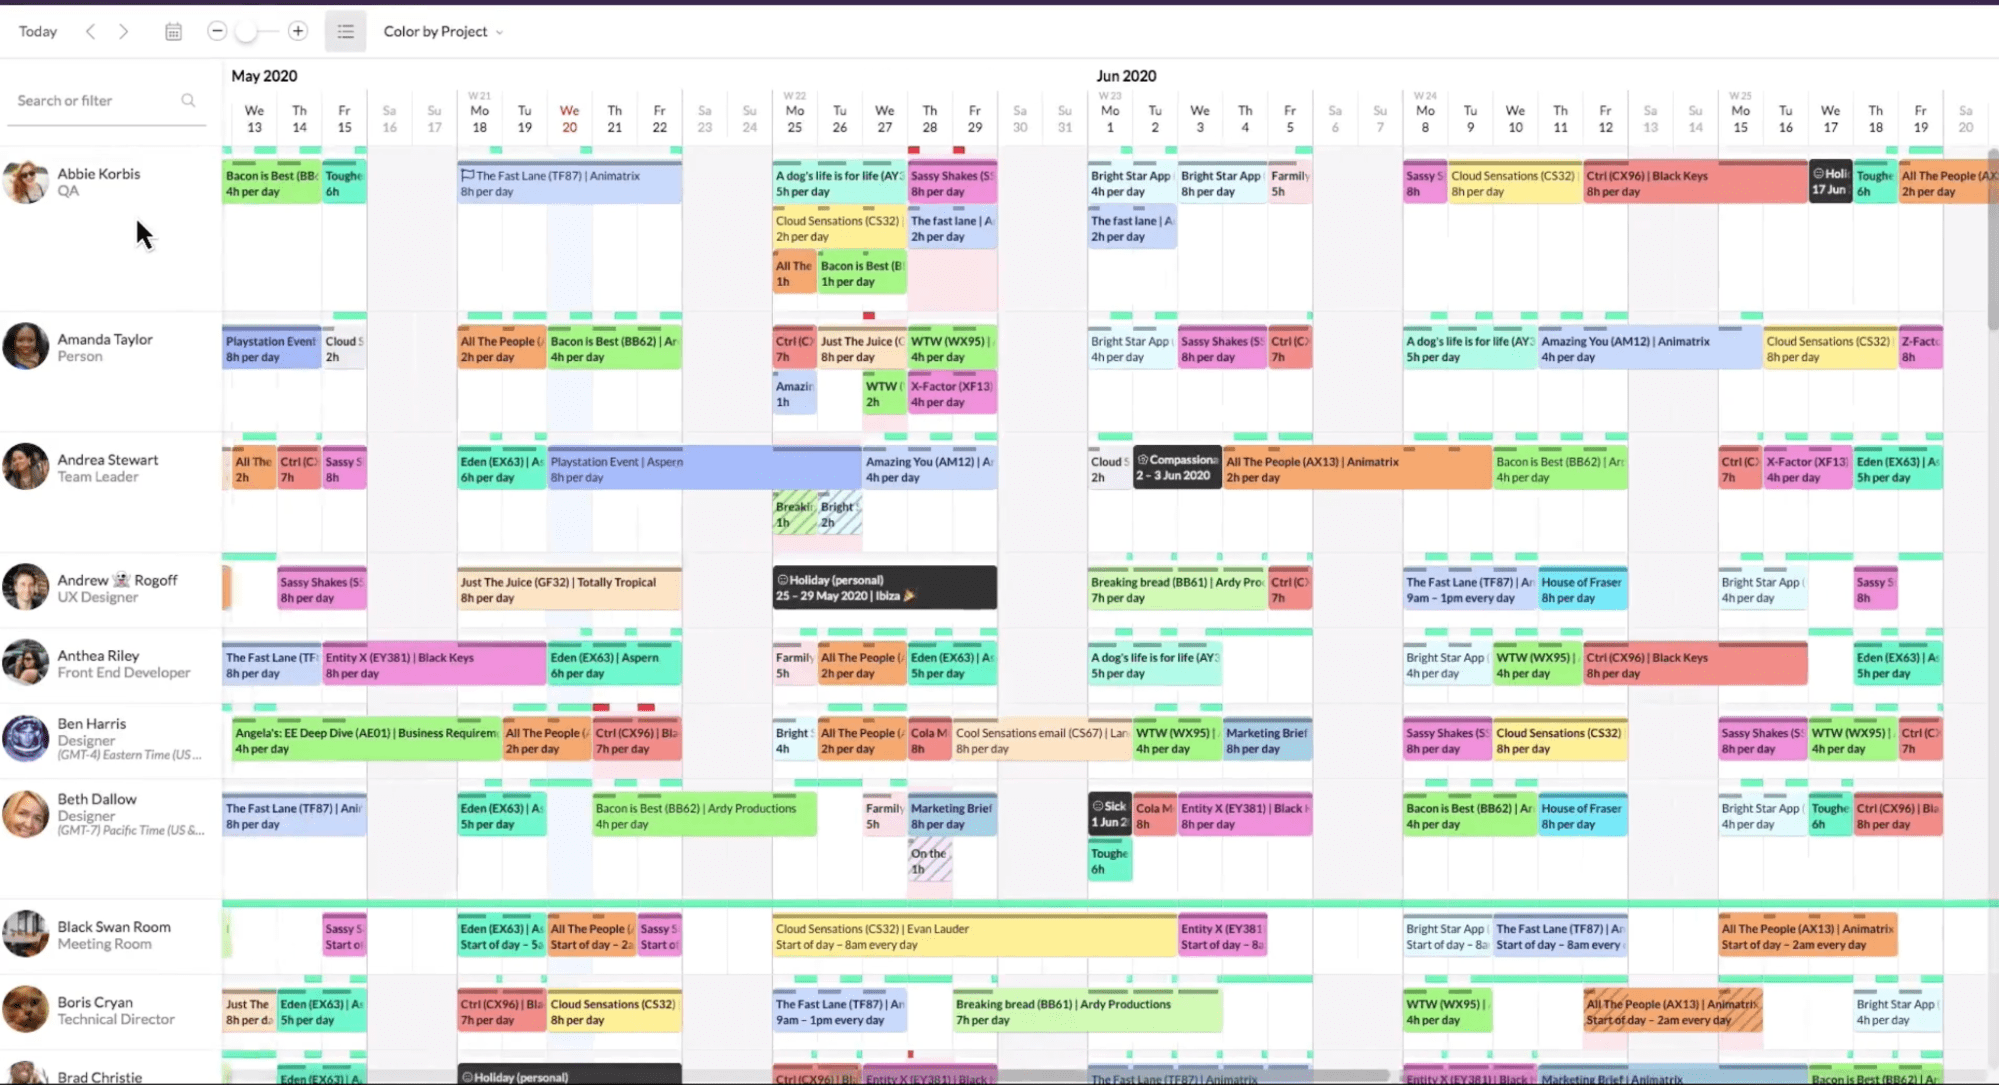
From here, you can easily understand your team’s long-term capacity, allowing you to quickly assess workloads and adjust projects as needed.
When forecasting upcoming projects, the “Schedule” also makes it easy to assess which resources may be available for upcoming projects — or when you might need to hire.
Use the “Search or filter” bar in the left-hand column and choose “People.” Then add filters based on department, job title, location, skills, and more to find the right resources for the job.
The “Schedule” view will automatically remove anyone who doesn’t meet the criteria, so you can see who’s available and when.
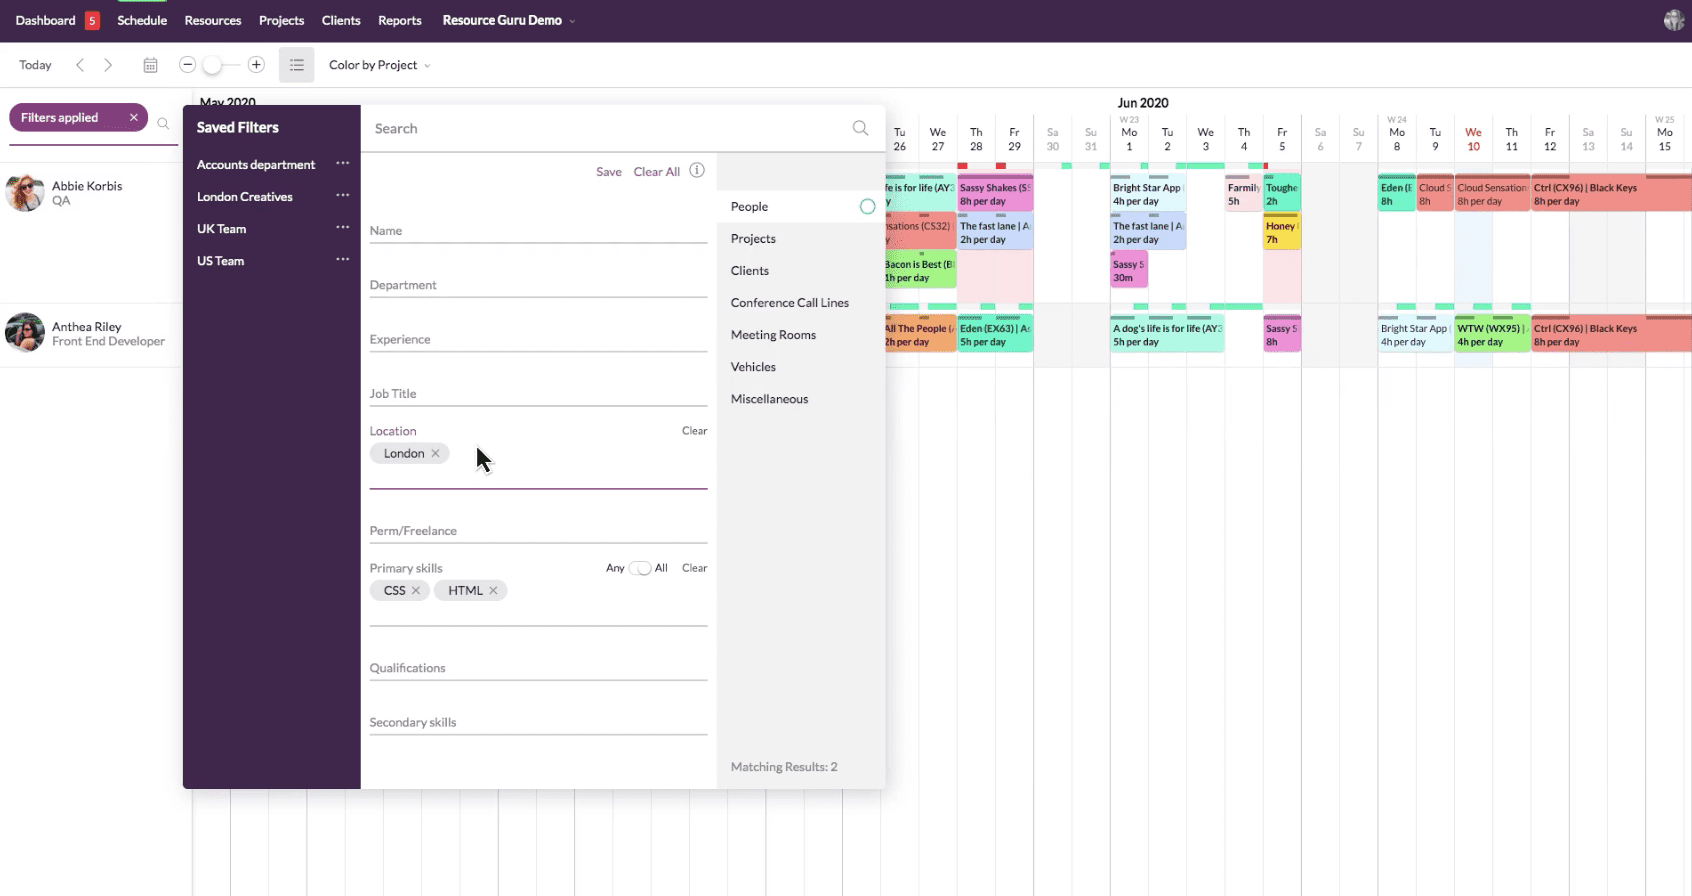
This makes planning future work easier and efficiently ensures optimal resource allocation.
What you’ll love
ResourceGuru shines in its reporting features. Its powerful reporting tools help you quickly analyze total team utilization, scheduled time, and availability metrics.
Start in the “Resources” tab of the “Reports” view. At the top, you’ll find high-level metrics. Below, see these metrics broken down by resource to understand who’s fully booked and who might need more work.
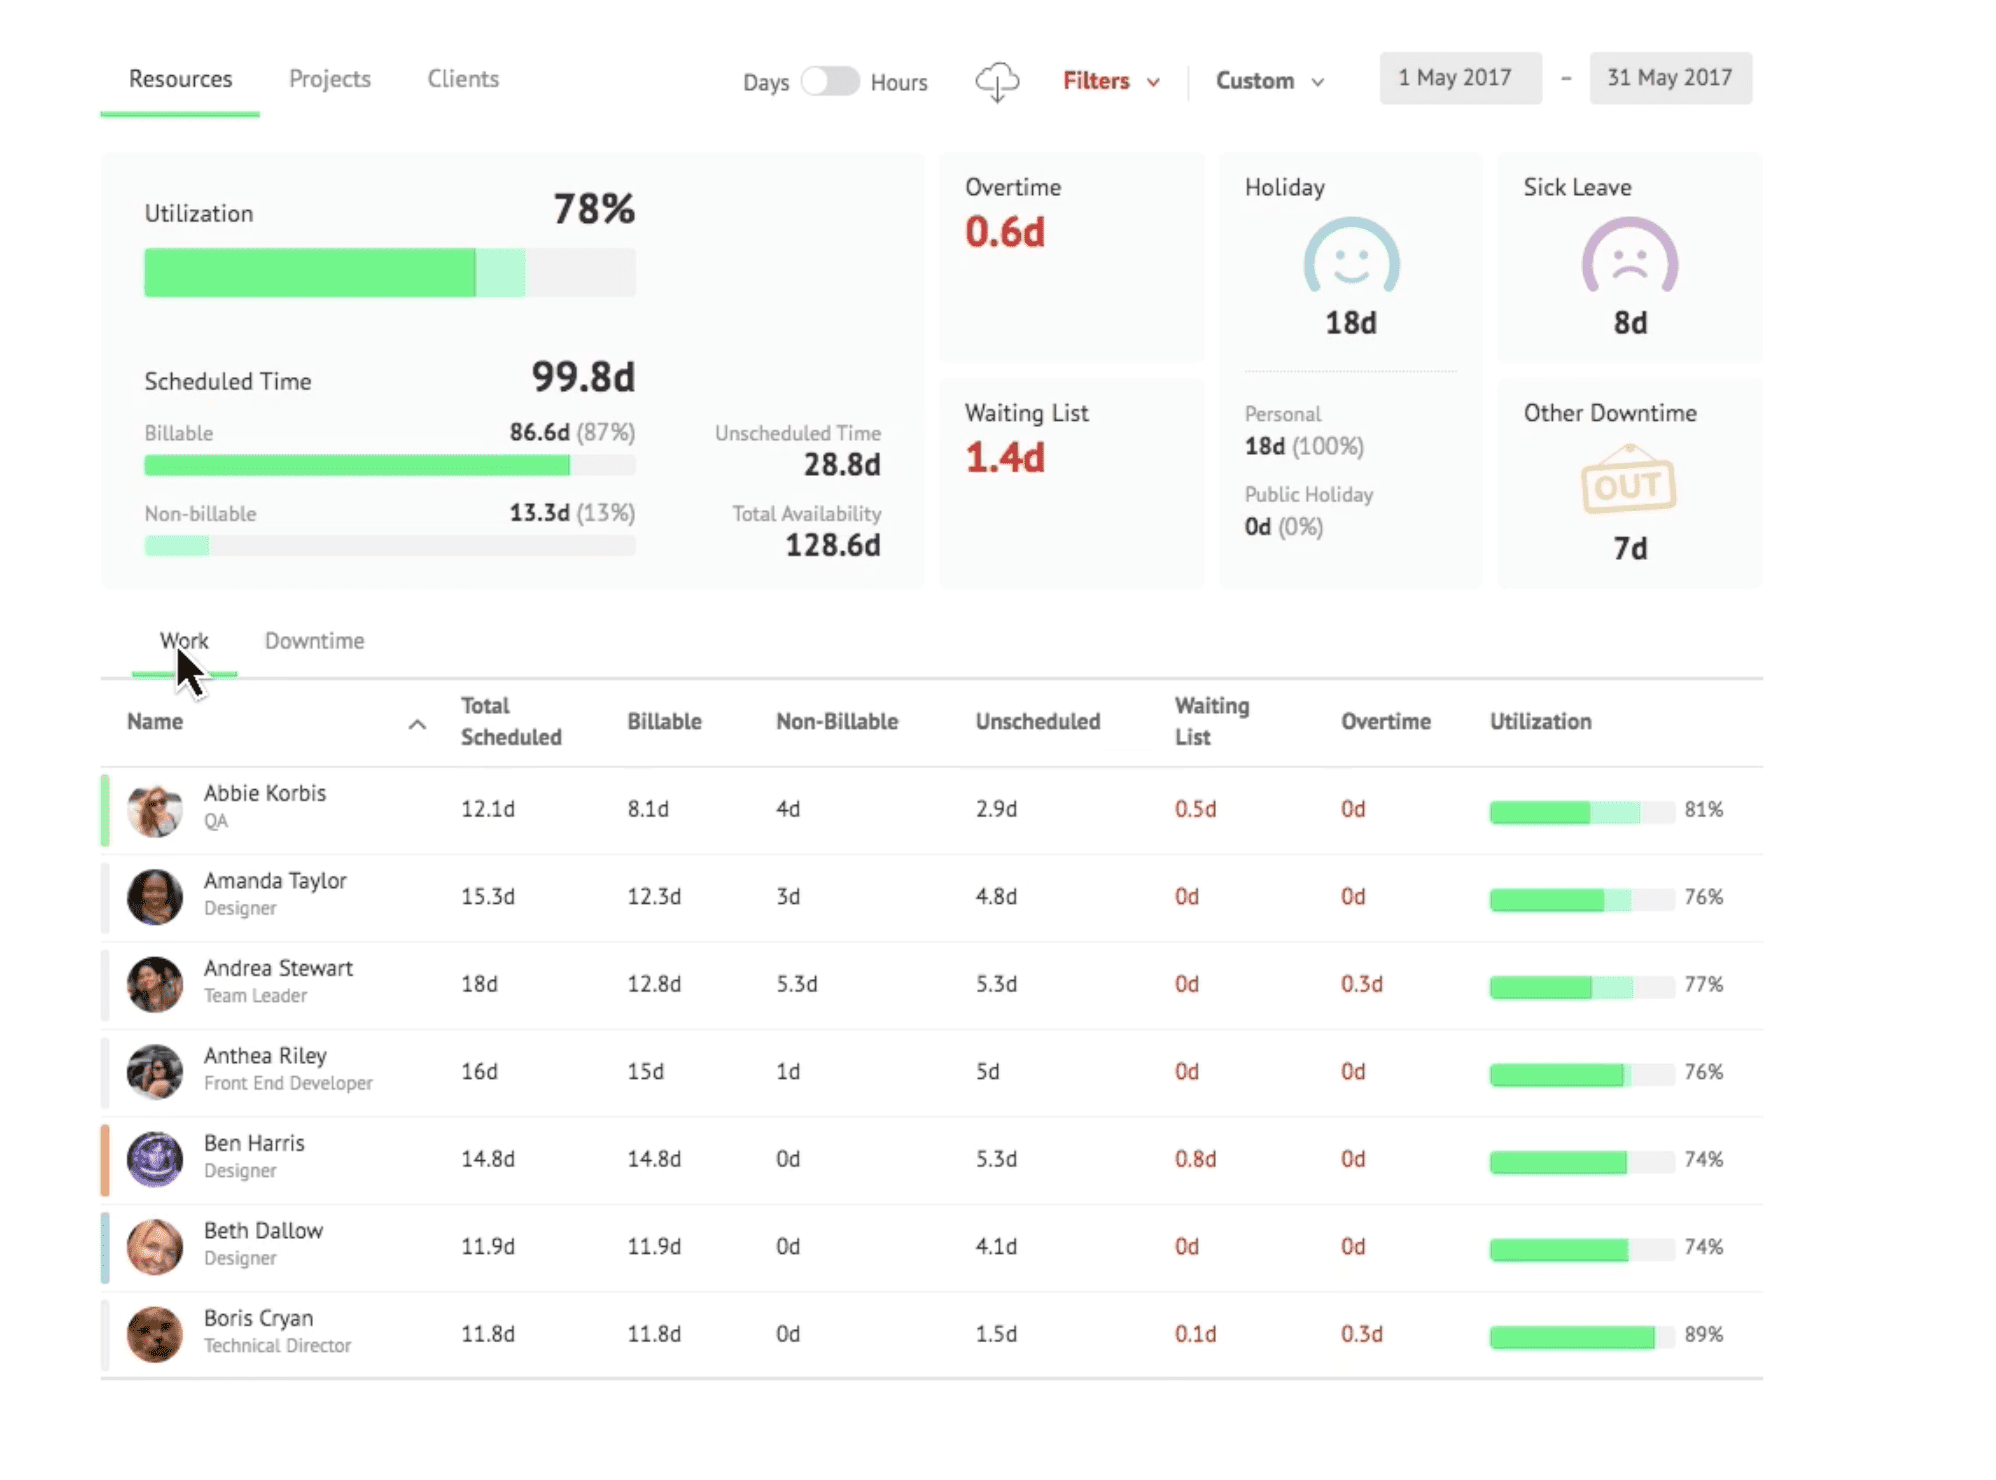
You can also use the “Filters” function to drill down into capacity of certain teams or job types. This can make it easier to see which teams need the most support, and where you might need to hire next.
Core features
- Project forecasting reports allow you to predict volume and resource capacity accurately
- Visual resource scheduler gives a birds-eye view of your team, projects, and capacity
- Clash management and waiting list features prevent overscheduling and improve gap and capacity analysis
- Centralized resource pool makes it easy to find the right person for the job — and keep your favorite freelancers on speed dial
Pricing
Resource Guru has three paid plans:
- Grasshopper: $5 per person per month
- Blackbelt: $8 per person per month
- Master: $12 per person per month
A 30-day free trial is available.
3. Productive
Productive is an all-in-one agency management software that provides resource capacity planning tools to manage current and future work.
The “Resourcing” view is your high-level dashboard to understand what’s taking up your team’s time.
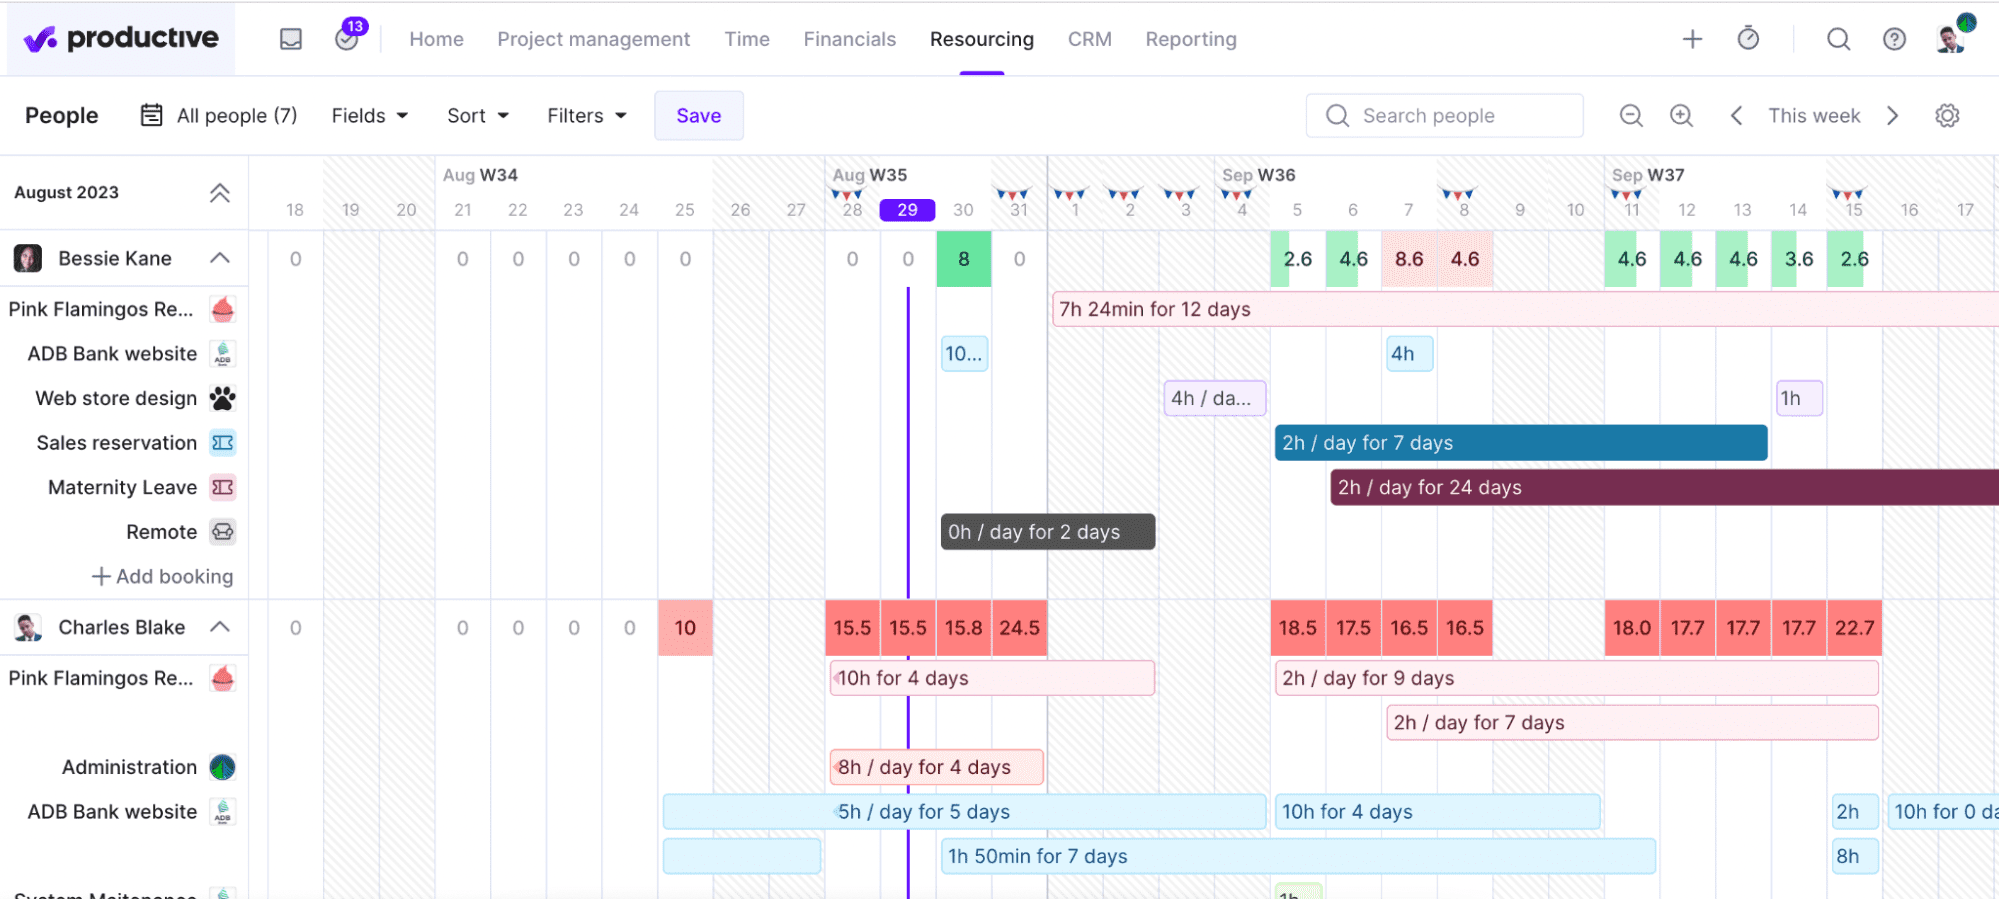
Zoom in or out on your timeline for weekly or monthly views. Use the arrows to see the current timeframe or look into the future.
Availability indicators at the top of each team member’s row show you the total number of hours booked for each day, plus a completion bar demonstrating their utilization. If a team member is overbooked, their availability indicator turns red.
From here, see at a glance what workloads look like and what your team’s capacity is for new projects is both now, next, week, next month, and even months into the future.
You can get more data from this view by customizing your “Fields.”
In the view header, go to the “Fields” dropdown. Select from dozens of additional data sets to add to this view, such as:
- Availability
- Scheduled
- % Billable / Worked Hours
- Cost
- Overtime
- Tentative Schedule
- and more
Use the “Fields date range” to see this data calculated for the current week, month, or any custom date range you choose.
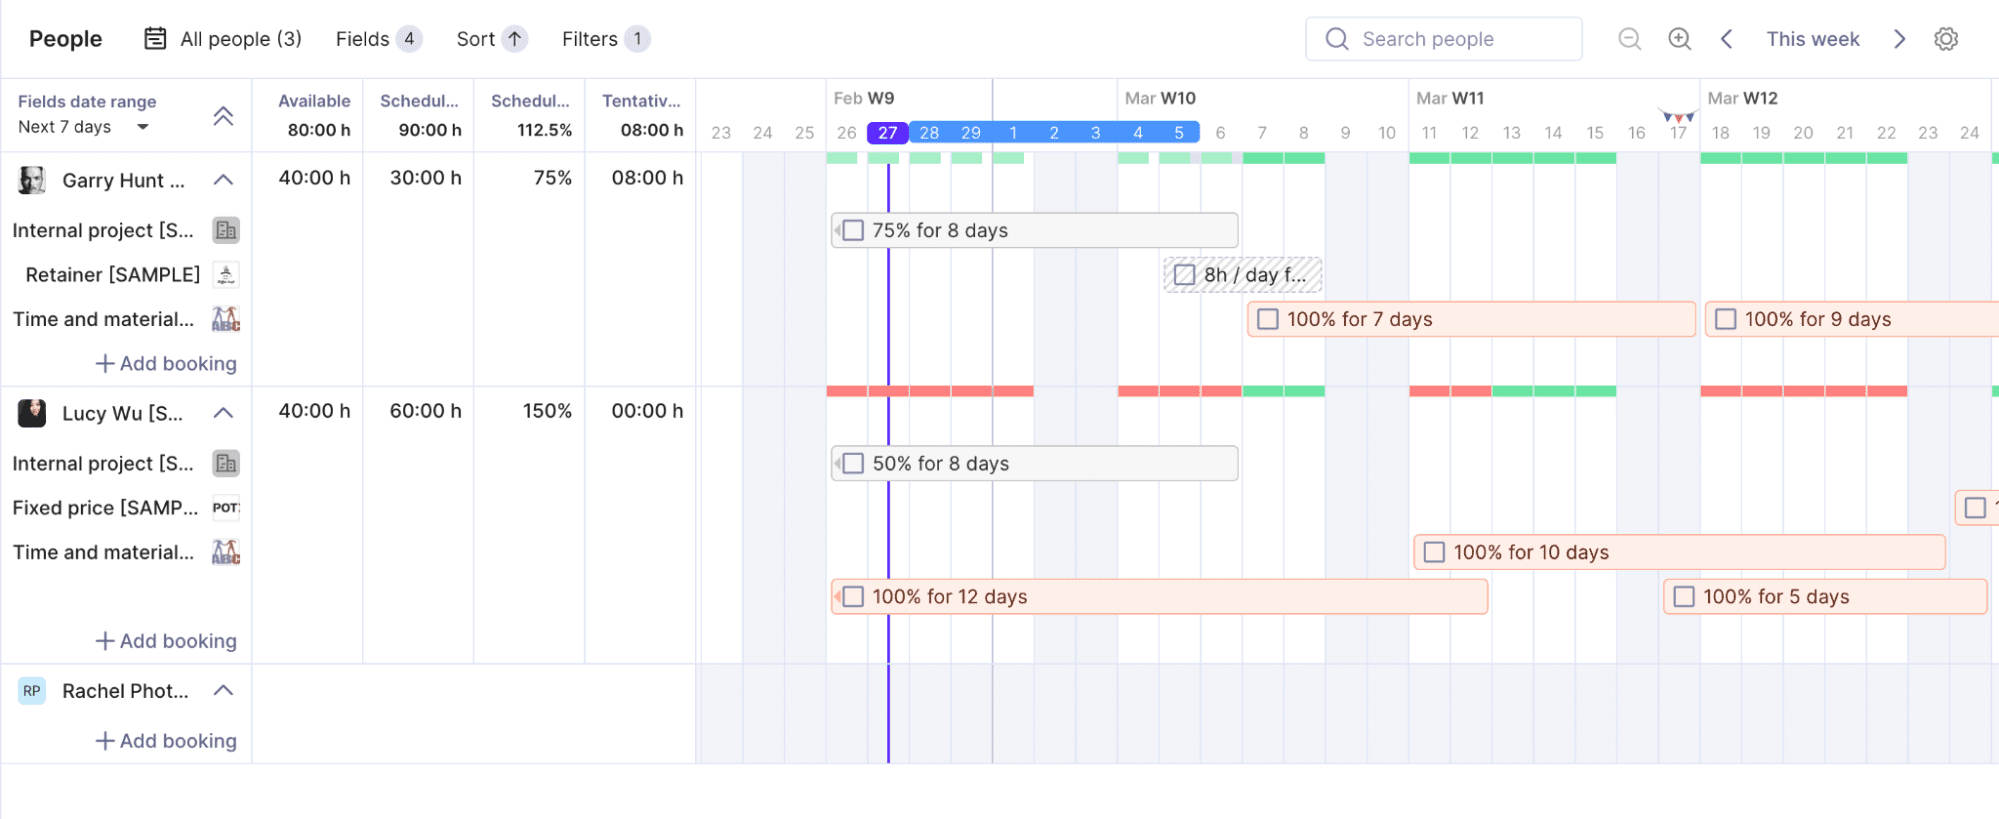
Time allocations and long-term capacity planning all in one place make it easy to conduct a gap analysis, optimize your resources, and ensure you always have the right staffing level for upcoming projects.
What you’ll love
The “Reports Library” in Productive allows teams to manage demand forecasting, utilization optimization, and long-term capacity planning.
For example, look at the “Forecasted billable utilization by month” report.
The chart shows your team’s utilization as a graph, with the percentage of utilization shown along the left-hand side. Below, you can see how much available time your team has compared with the amount of scheduled client work, sorted by month.
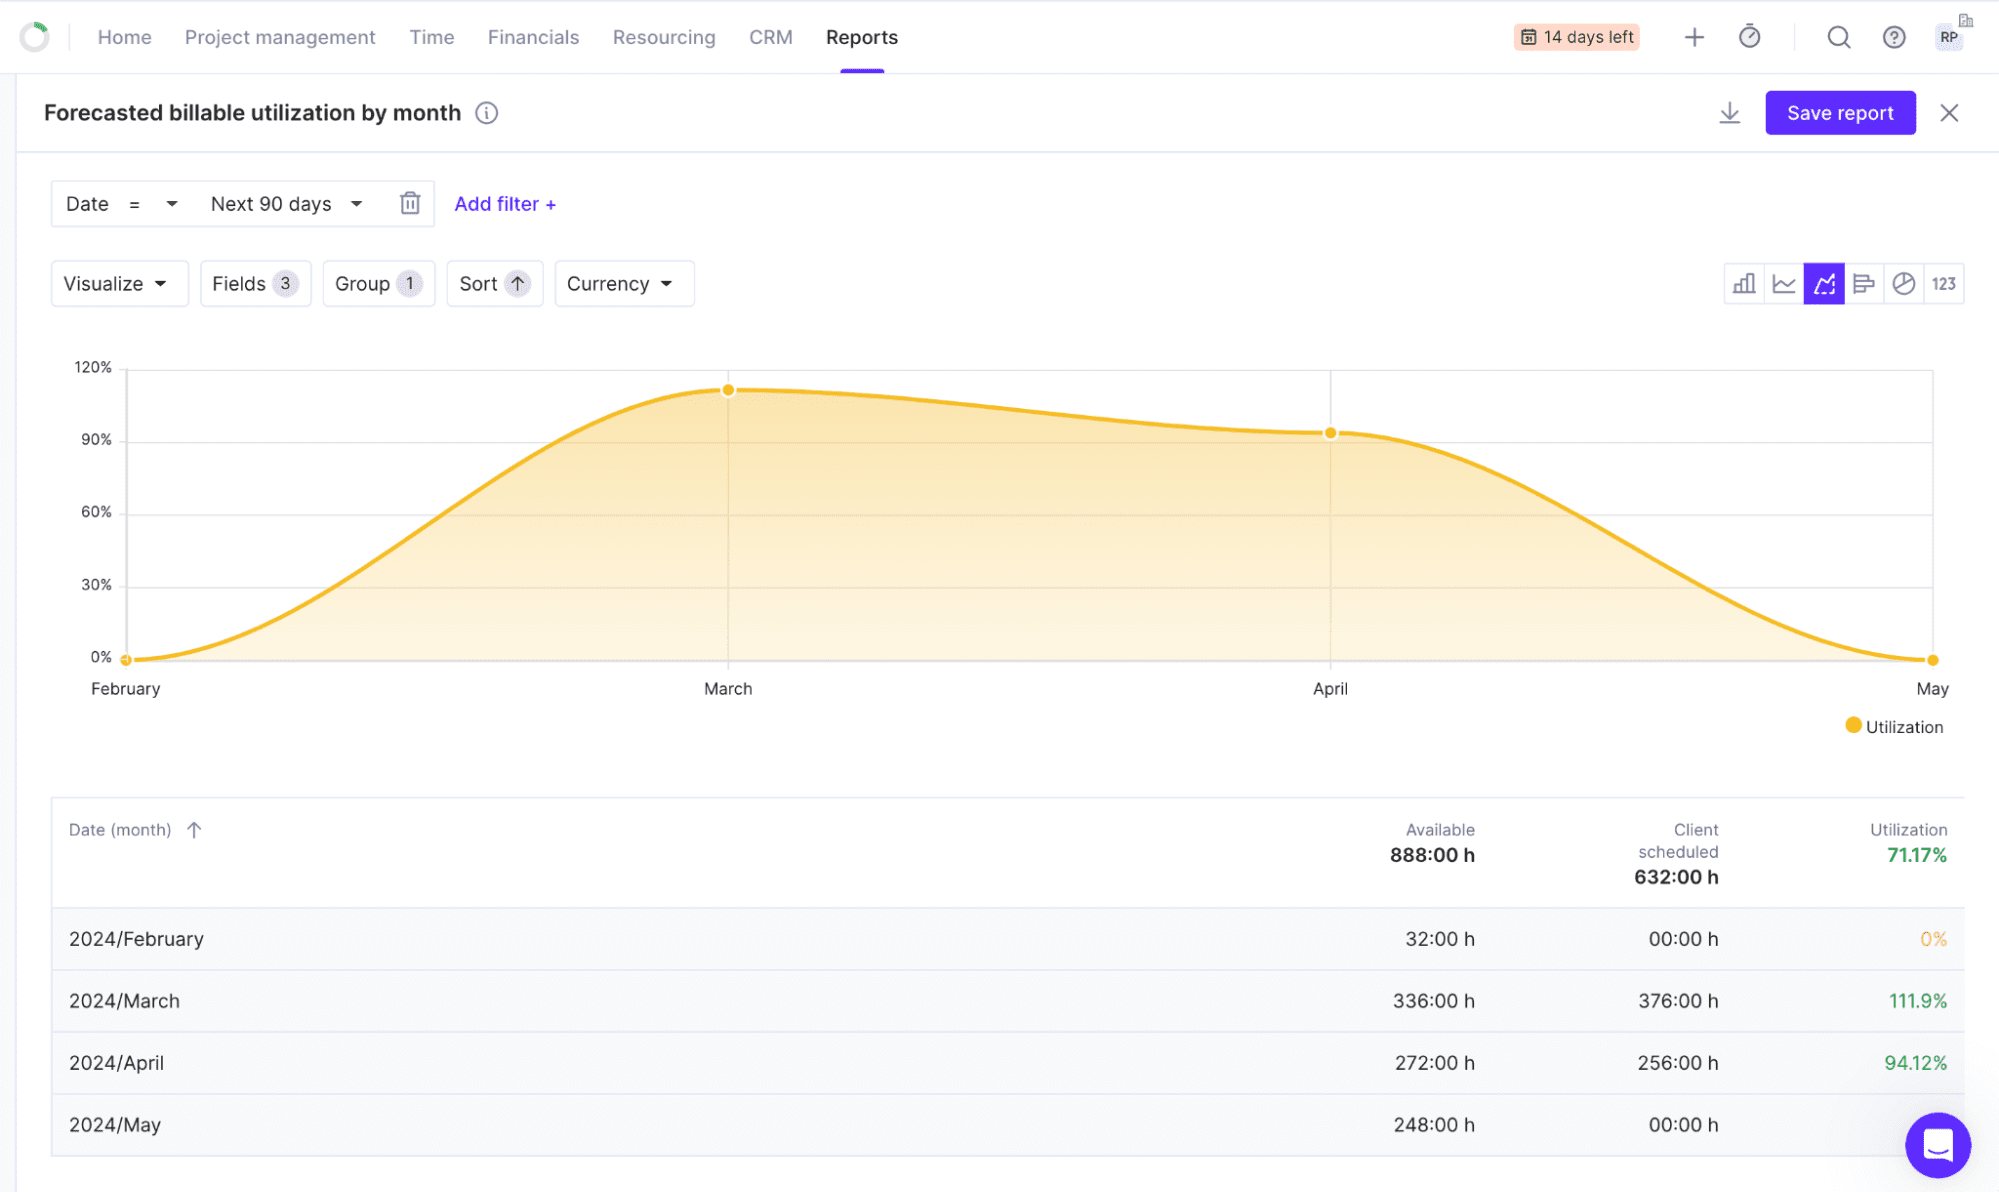
With forecasted utilization, you can take action before a problem begins. Click on an overscheduled month to see which team members are over capacity or which projects are being overserviced.
You can also view by “Placeholders” to see how much upcoming work has yet to be assigned to an available team member.
As a result, you can make informed hiring decisions based on true demand, accurately analyze gaps, and ensure team members are being adequately utilized.
Core features
- Capacity heatmaps show you exactly who’s available and what everyone’s workload looks like
- Future forecasting tools allow you to monitor resource allocations for upcoming work and ensure the needed coverage
- Placeholders let you scenario plan and make better hiring decisions
- Automations help optimize workflows and automatically keep team members in the loop
- Reporting library with 50+ templates puts data behind all of your decisions
4. Float
Float offers a simple, visual solution to resource and capacity planning all from one dashboard, the “Project Plan.”
On the “Project Plan,” you get a Gantt-chart-style project tracker, broken down by tasks assigned to each team member. From the same view, you can also see everyone’s workload and overall capacity.
The colored boxes on the Gantt chart view show everyone’s workload or time off. Larger project phases are shown across the top row, while individual tasks and assignments are displayed in the column of each team member.
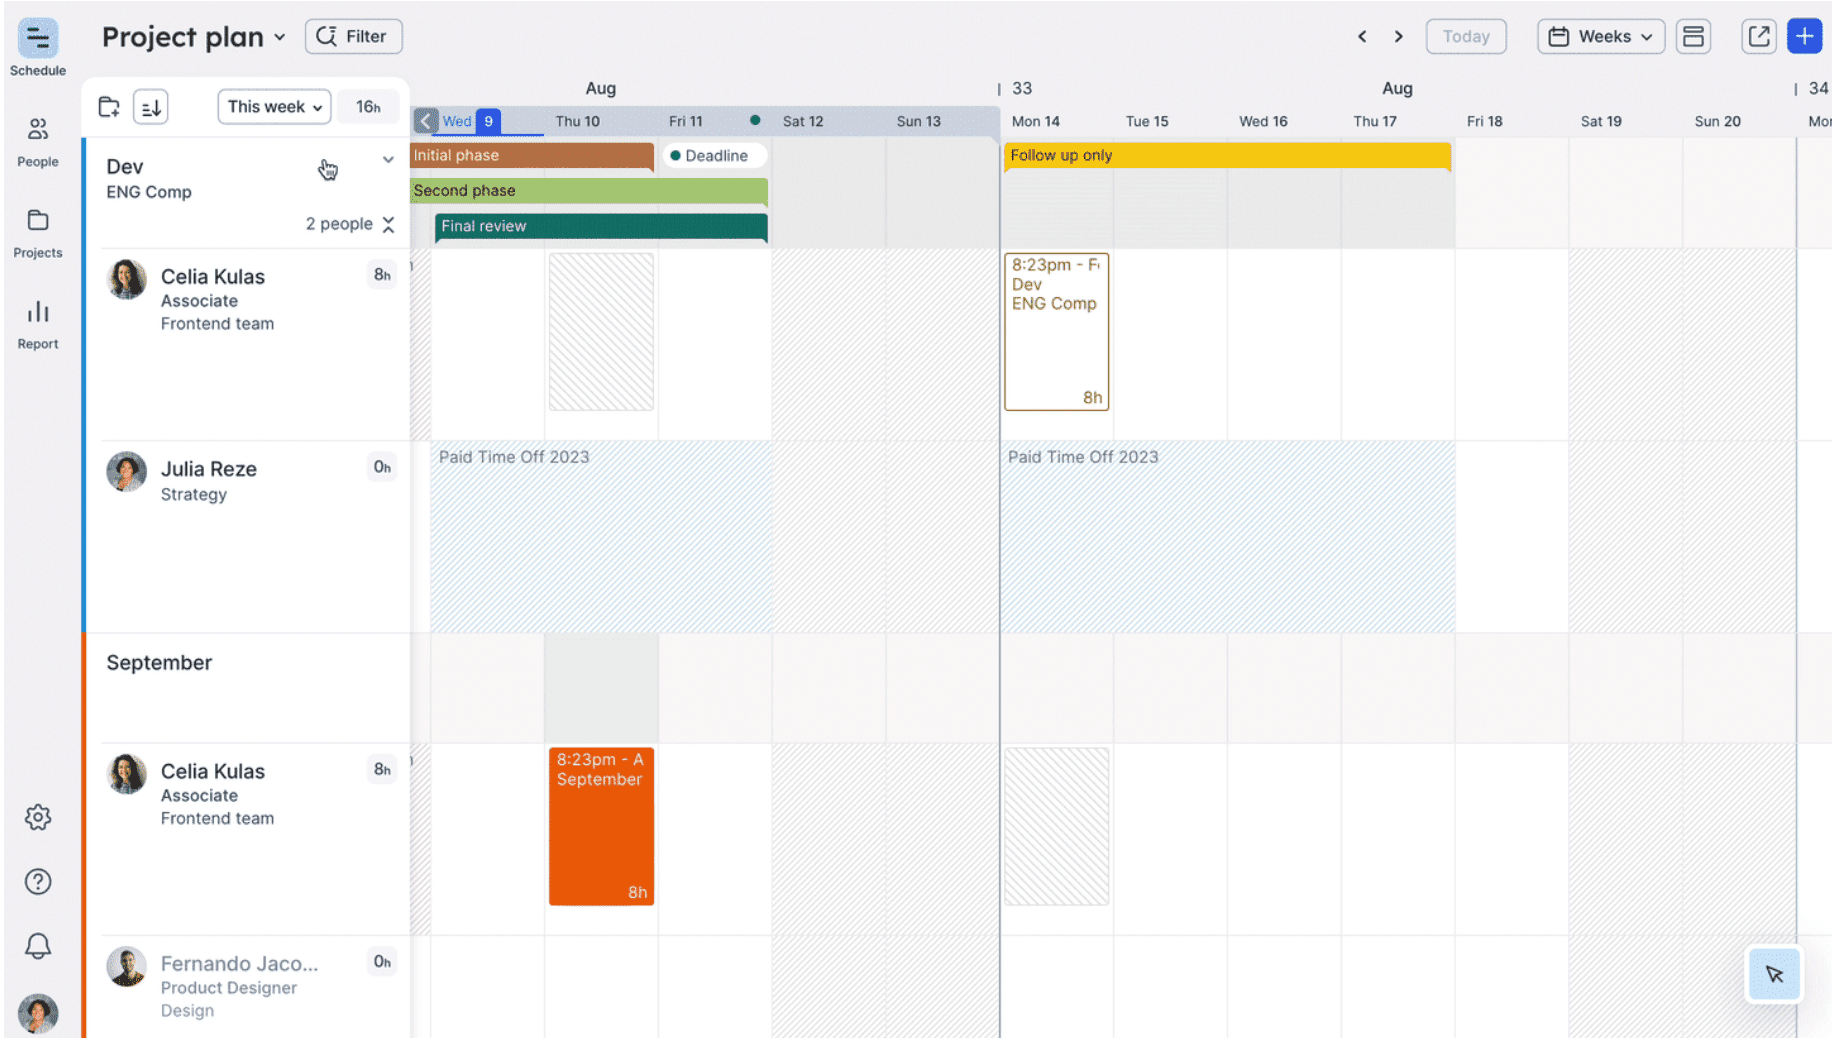
To see team member’s overall capacity, click and drag over any date range in the calendar or use the date range dropdown in the left sidebar.
Then, use the toggle to select “Show utilization in hours” or “Show utilization in %.” to see their capacity.
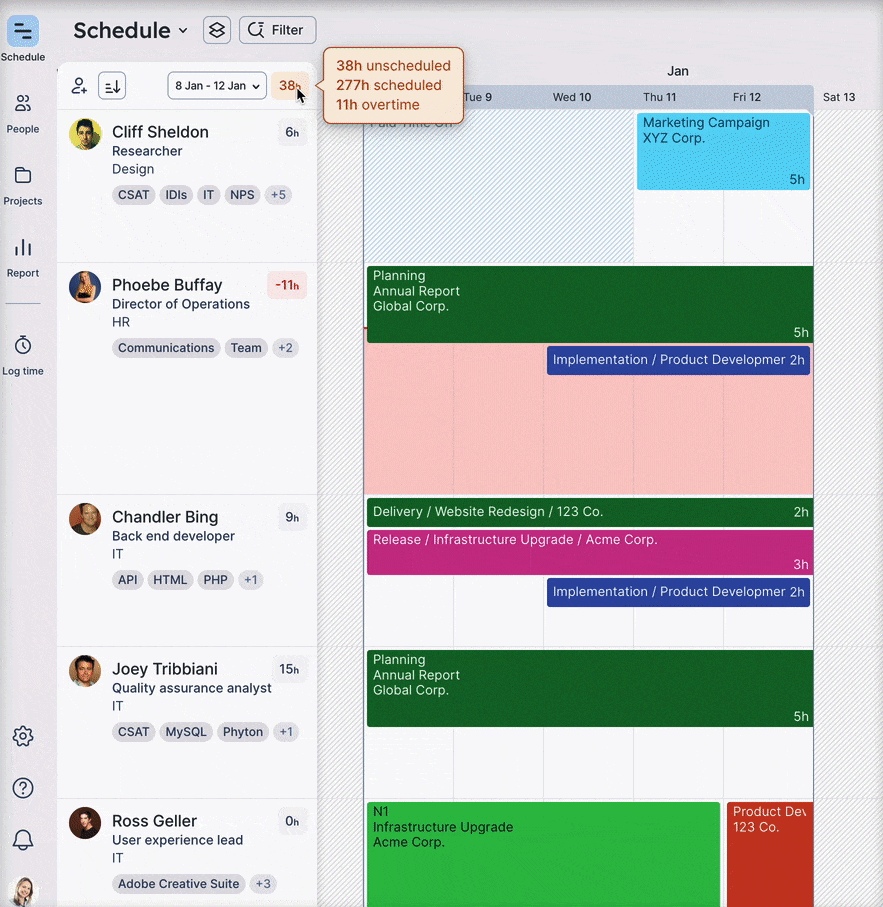
Sort your results by “Unscheduled Time,” “Role,” or “Department” to see who’s taking on too much and who you can reallocate project tasks to. Drag-and-drop tasks to reassign them, and keep your projects moving forward while optimizing team member utilization.
What you’ll love
Float’s “People” report is perfect for operations managers who need to drill down into their team’s utilization, forecast overservicing, and better understand capacity.
You’ll find it in the “Report” section — toggle to “People.”
From here, you’ll see a bar chart showing your team’s total capacity, scheduled work by billable and non-billable time, tentative projects, time off, and more.
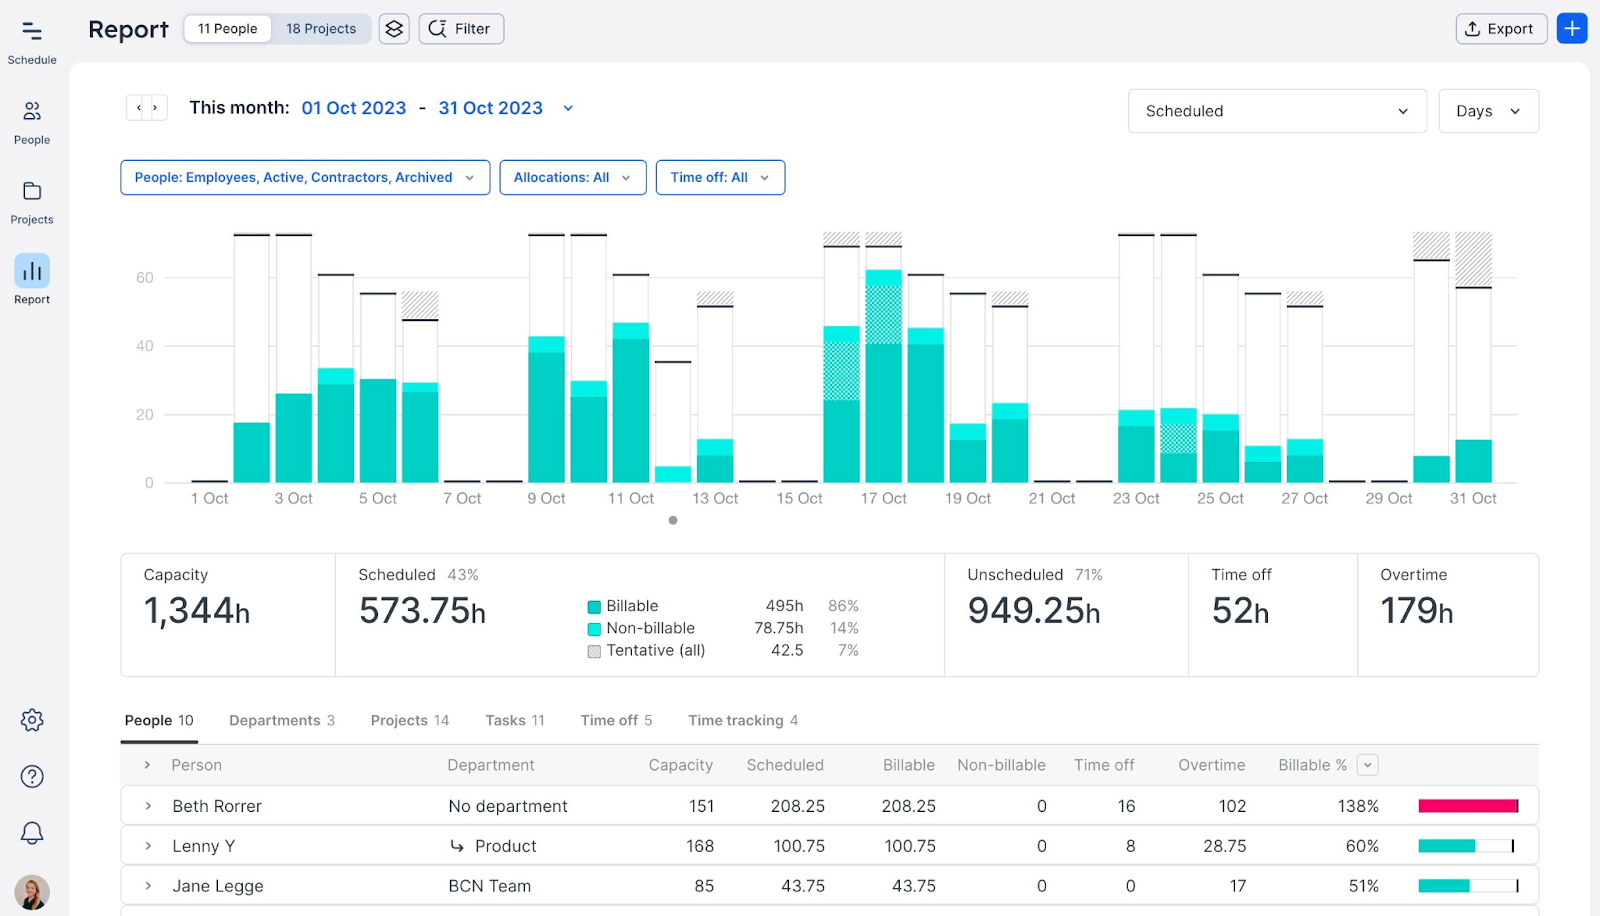
When you’re ready to zoom in on this data, you can see these details broken down by individual employees, departments, projects, and more in the table below.

This table gives you insight into the following:
- Individual capacity
- Scheduled hours
- Billable vs. non-billable tracked time
- Time off for the given period
- Overtime worked
- Scheduled hours/capacity
- Utilization %
With both high-level and detailed data in one view, you can quickly assess capacity, optimization, overscheduling, and more.
Core features
- Custom work hours and billable rates help you understand each person’s capacity — even if they’re all different
- Time tracking lets you monitor budget, scheduled vs. logged hours, and workload in real-time
- Tentative tasks and placeholder roles to see the impact of every possible scenario
- Reporting gives you data into forecasted capacity and profitability based on project budgets
- Searchable team member profiles detailing skills, experience, job title, and more allow you to allocate resources effectively
Pricing
Float has three pricing plans:
- Starter: $6 per user per month
- Pro: $10 per user per month
- Enterprise: custom pricing available based on needs
Float offers a 30-day free trial of either of their paid plans.
5. Runn
Runn is a resource capacity planning software designed for teams who need built-in scenario planning and powerful forecasting features.
The “People Planner” dashboard shows your entire team’s availability and utilization, allowing you to assess your capacity for upcoming projects and balance workloads quickly.
You’ll see every team member as a column across a timeline view from here. You’ll be able to see at a glance whether a given team member is at capacity, overscheduled, or has availability — and if so, when and how much.
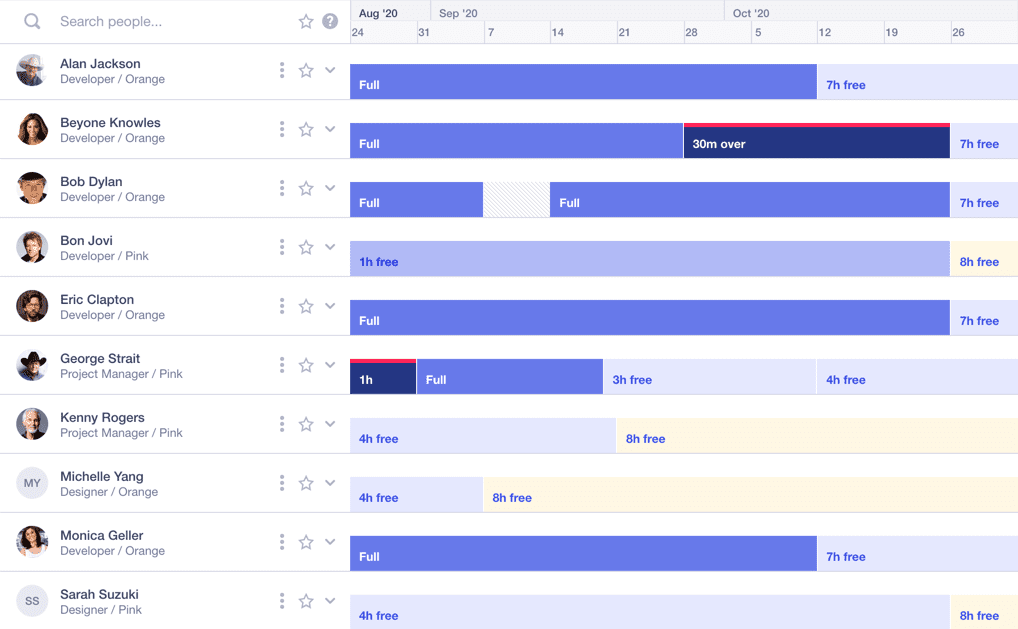
These at-a-glance details allow you to monitor upcoming utilization and prevent bottlenecks.
Runn also allows you to forecast how different versions of upcoming projects might impact your team’s workload and utilization.
From the “Project” planner, you can create a tentative project coming down the pipeline or even multiple versions with different scopes or start dates. Once you’ve added your tentative projects, turn on “Charts.”
Then, turn on the “Tentative” toggle in the header to see the impact of all your tentative projects, or toggle them on and off individually from the project row to see how different scenarios will impact your team.
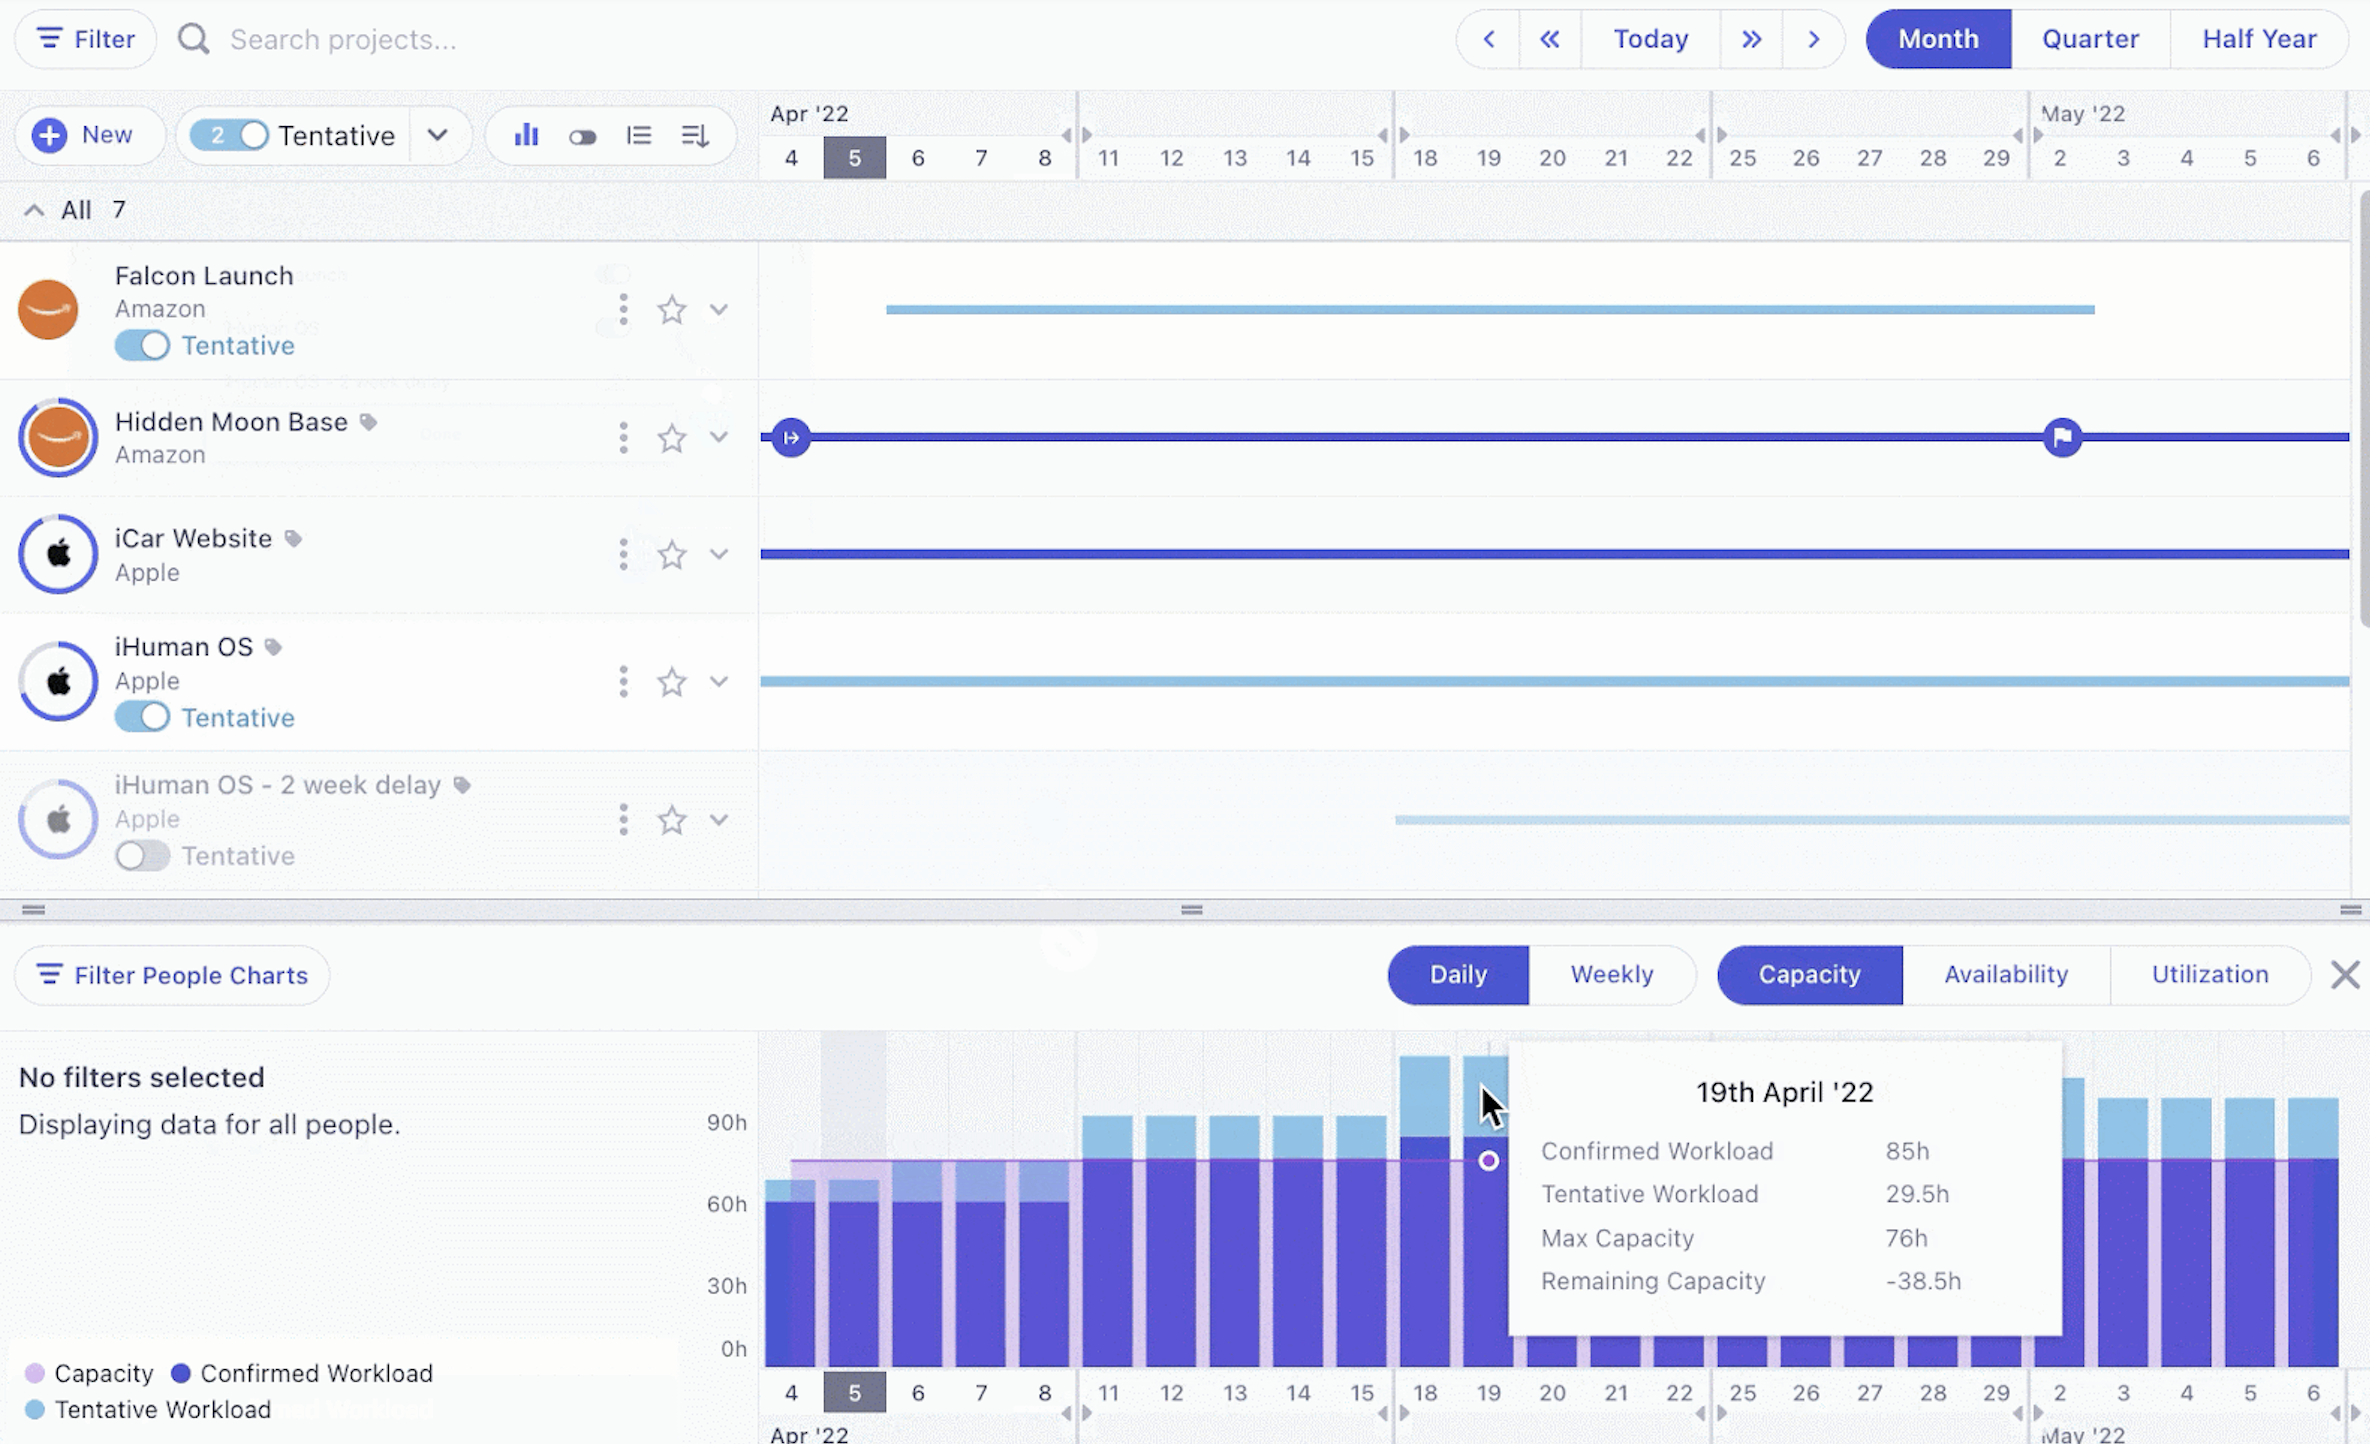
From here, it’s a snap to see how projects coming down the pipeline will impact your team’s workload and utilization. Use this data to see when to hire additional support, which new projects to take on, and to identify capacity gaps as projects are confirmed.
What you’ll love
A key feature of Runn is the ability to forecast future hiring needs accurately through “Placeholders.”
These allow you to see combined future resource needs that have yet to be assigned, letting you make informed staffing, hiring, or subcontracting decisions to meet demand.
When looking at future capacity and workload in the “People Planner”, see how much of the scheduled work is assigned to “Placeholders,” which either needs to be re-assigned or hired for.
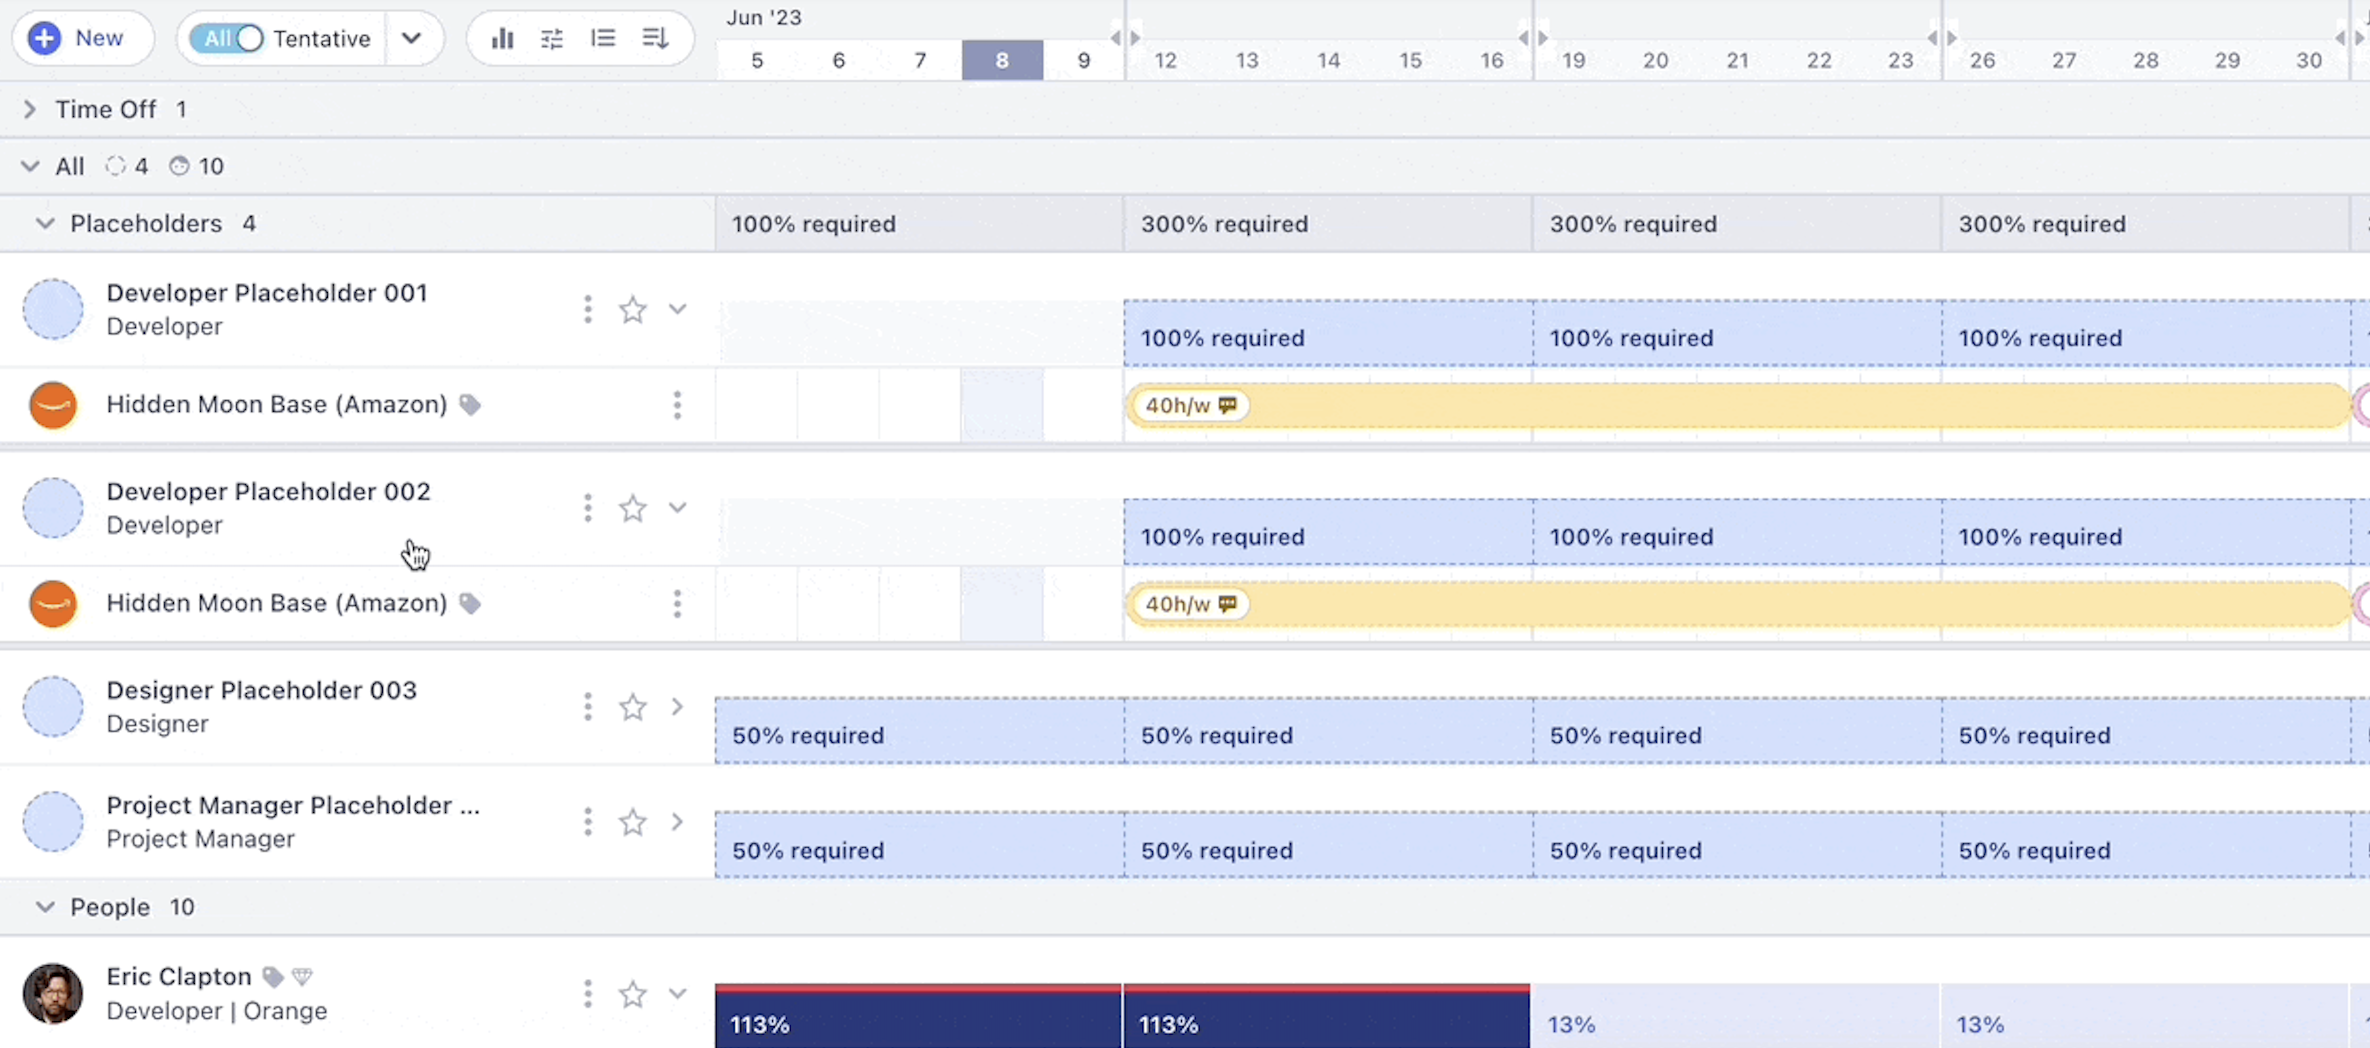
To forecast future hiring needs, toggle on “Weekly Summary,” then filter by “Person Type: Placeholders.”
The Placeholder group capacity bar will then show the number of FTE required for each week to manage your upcoming work.

With this view, you’ll have concrete data on exactly who you need to hire to optimize utilization and keep projects profitable and on time.
Core features
- Visual capacity forecasting charts help you keep workloads balanced over time and scenario plan for the future
- Team member tags allow you to sort and filter your employees always to find the right person for the job
- People and project placeholders give you real-time data on exactly who to hire, when, and for how long
- Reporting dashboards on capacity, pipeline, and utilization lets you keep an eye on future workload and resourcing needs while also optimizing current utilization
Pricing
Runn has a free plan and two paid plans:
- Free: up to five users with unlimited projects
- Pro: $8 per user per month
- Enterprise: custom pricing for custom requirements
A 14-day free trial of Runn’s Pro Plan is available.
6. Forecast
Forecast is an AI-powered capacity management tool for teams that want to optimize resource allocation and improve project forecasting.
The “People Schedule” tool is an interactive Gantt chart that visually represents team member availability and utilization over time. The utilization heatmap, which uses red and green shading to show whether team members are over- or under-allocated, shows whether they are over- or under-allocated.
Click any team member’s name to see what projects take up their time.
Seeing a lot of red?
You can drag-and-drop any project or task to move it to another time or reassign it to a team member with more capacity.
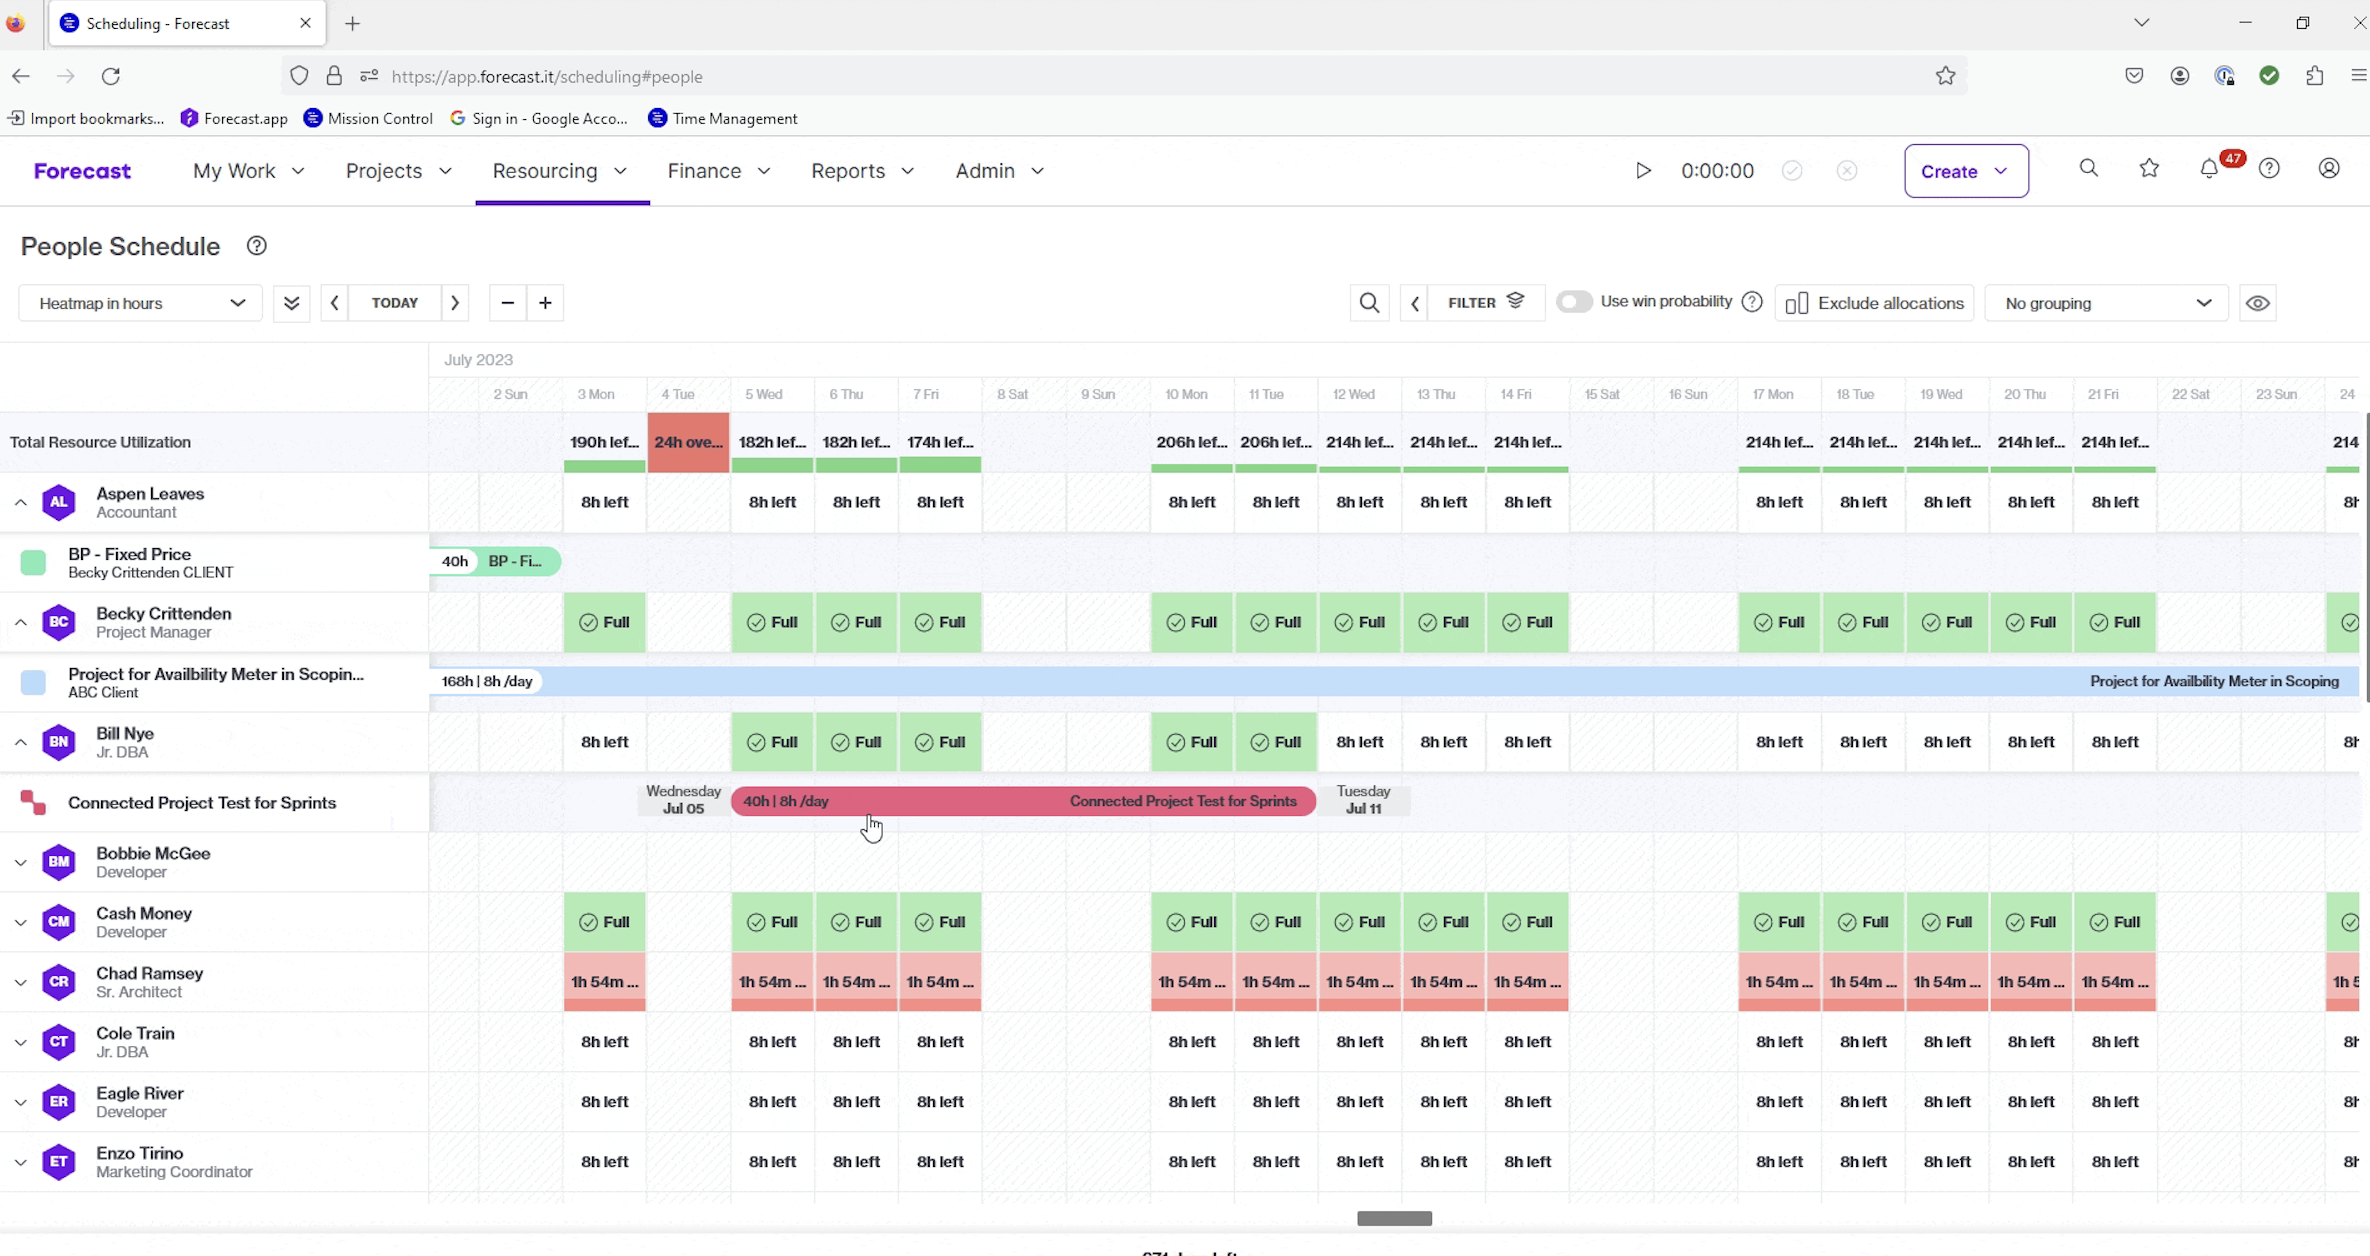
Real-time updates to utilization and availability clearly show where work needs to be done and how to optimize resources.
You can also allocate potential projects using “Soft allocations” and “Placeholders.”
“Soft allocations” let you hold space for tentative projects or demands, allowing you to see potential changes to capacity and utilization.
“Placeholders” let you assign a task to a general role if you’re unsure who will take it on.
Toggle on “Use win probability” to analyze resource demand and allocation based on the probability of winning tentative projects.
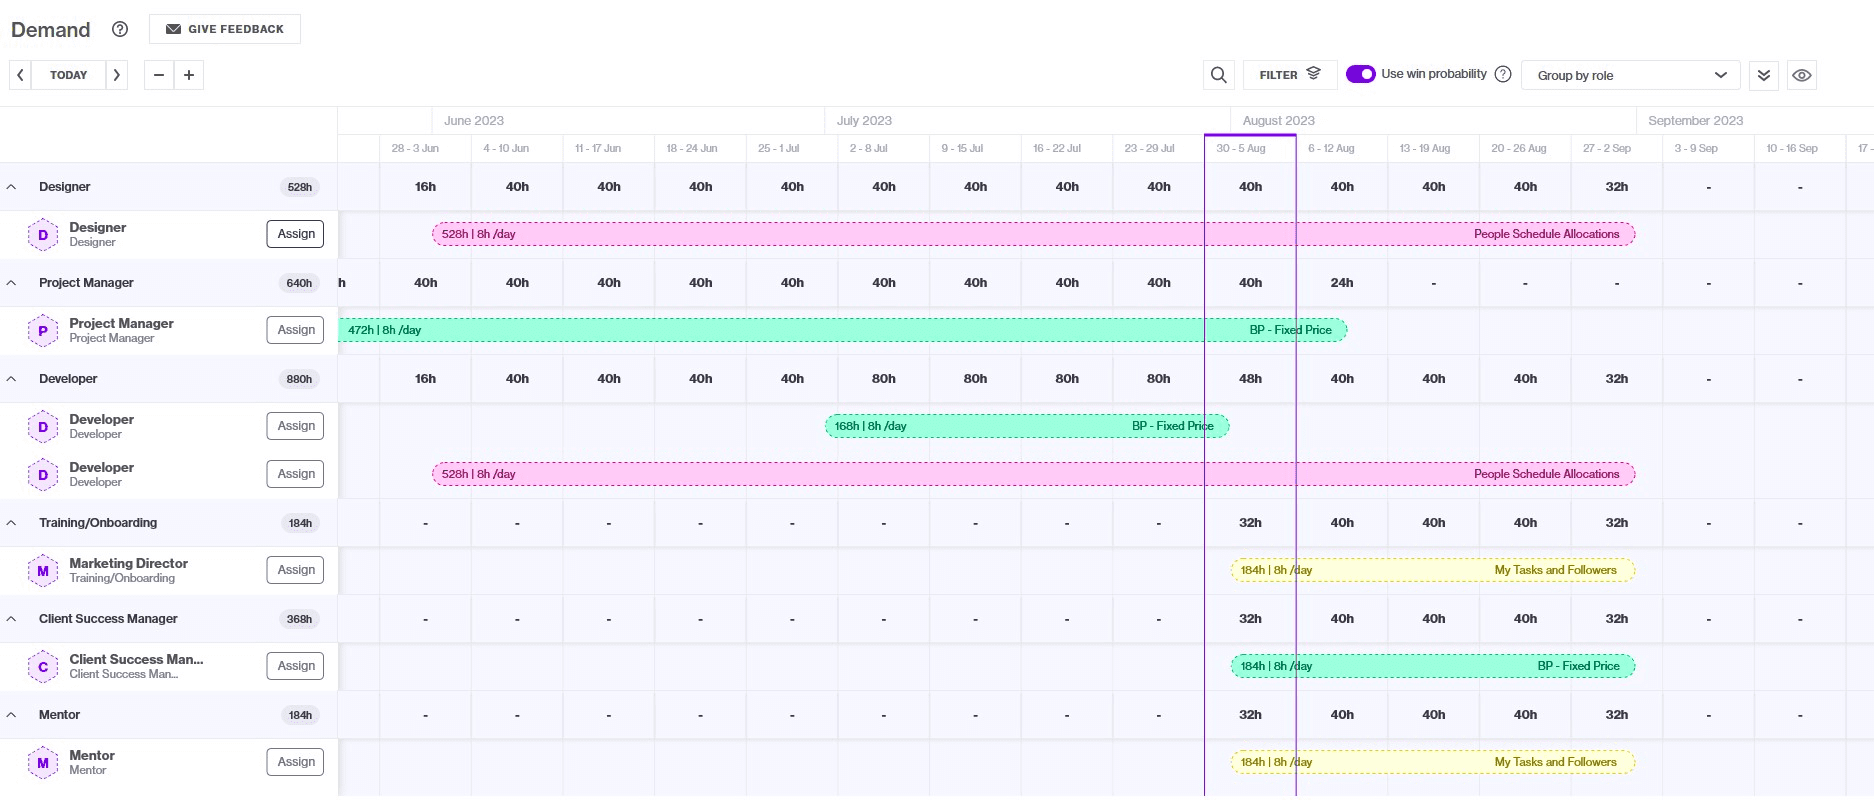
From here, you’ll see your most probable capacity needs and all possible scenarios, clarifying your upcoming demand and which roles you need to hire for additional support.
What you’ll love
One of Forecast’s key features is the “Capacity Overview,” which provides teams an analytical heat map to visualize resource capacity. This considers the probability of pipeline wins and compares current versus needed resources.
The color-coded heatmap shows total availability, placeholder projects, and soft (tentative) and hard allocations.
You’ll automatically view team members in groups by role, but you can also filter down into the individual level, or use the “Filter” function to add specific grouping.
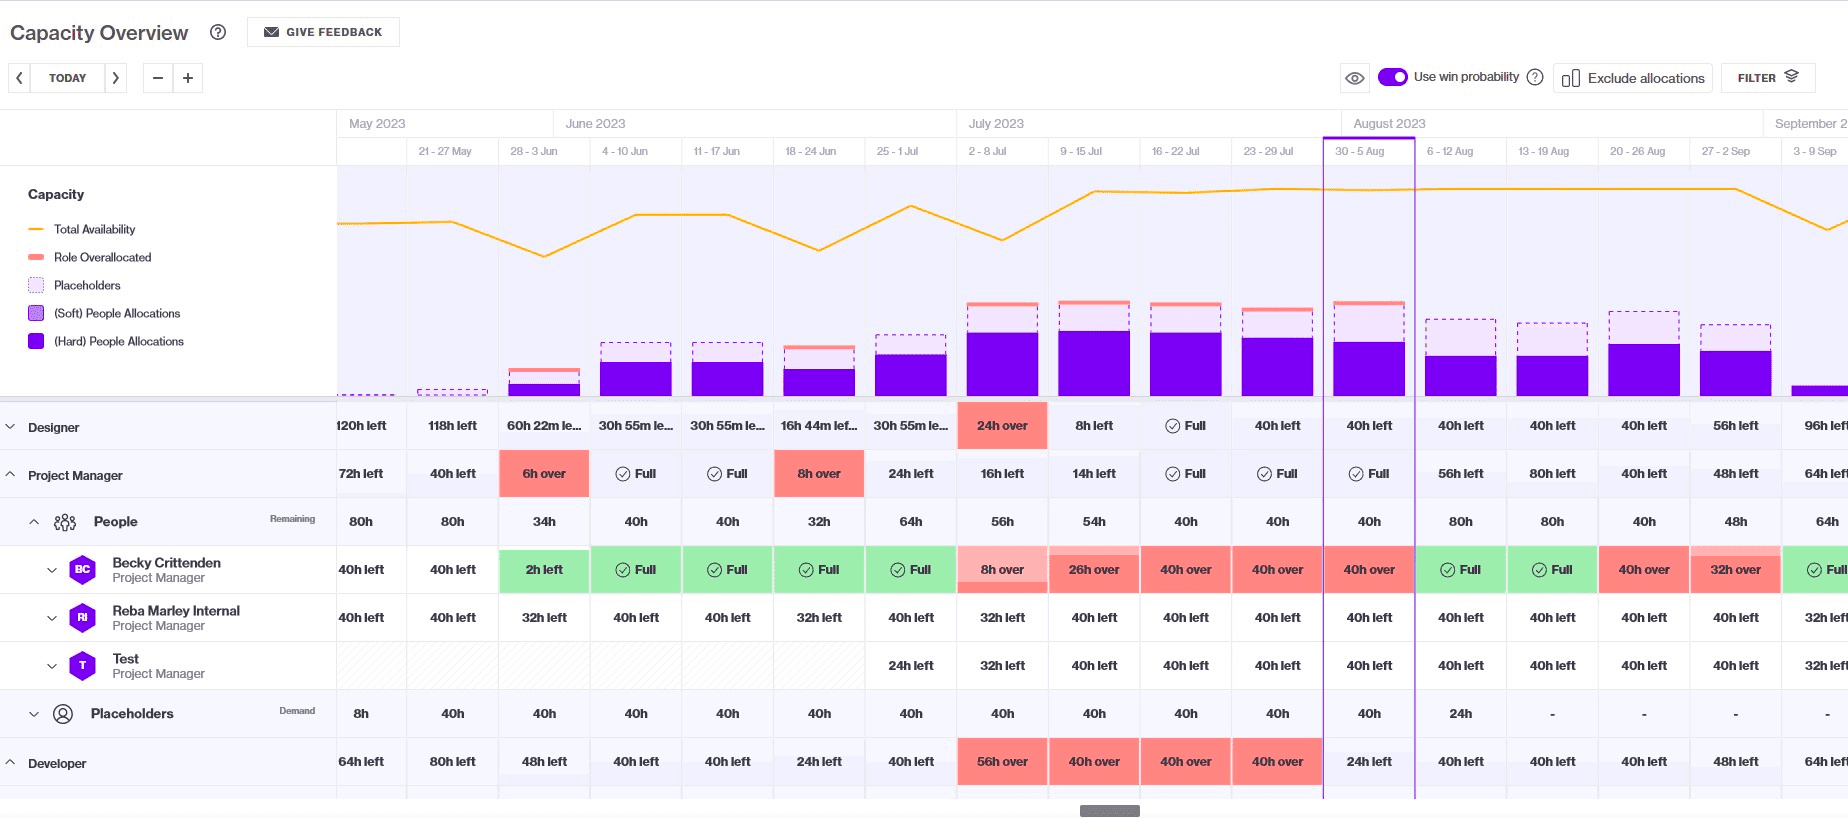
With all your capacity data and demand forecasting shown at a glance, you gain essential insights into upcoming resource demand. This allows better planning and allocation ahead of time to deliver projects smoothly, now or months down the line.
Core features
- Capacity overview dashboard gives you detailed insights in future demand, resource allocation, capacity, and more.
- Project win probability strengthens demand forecasting by seeing how likely each scenario is
- Staffing recommendations from internal AI tools help you quickly find the right people for each job
- Utilization reports let you keep a birds-eye view of your whole portfolio and improve efficiency
Pricing
Forecast offers custom pricing based on the number of users you need. Their “Core” plan starts at 25 users.
7. Toggl Plan
Toggl Plan provides visual work management tools for small teams, allowing for resource optimization and long-term capacity planning.
In the main “Team View,” you’ll see everyone’s assigned tasks and projects in a timeline view. You’ll automatically have a “Team view” with your entire team, but you can also create “Team views” for individual departments.
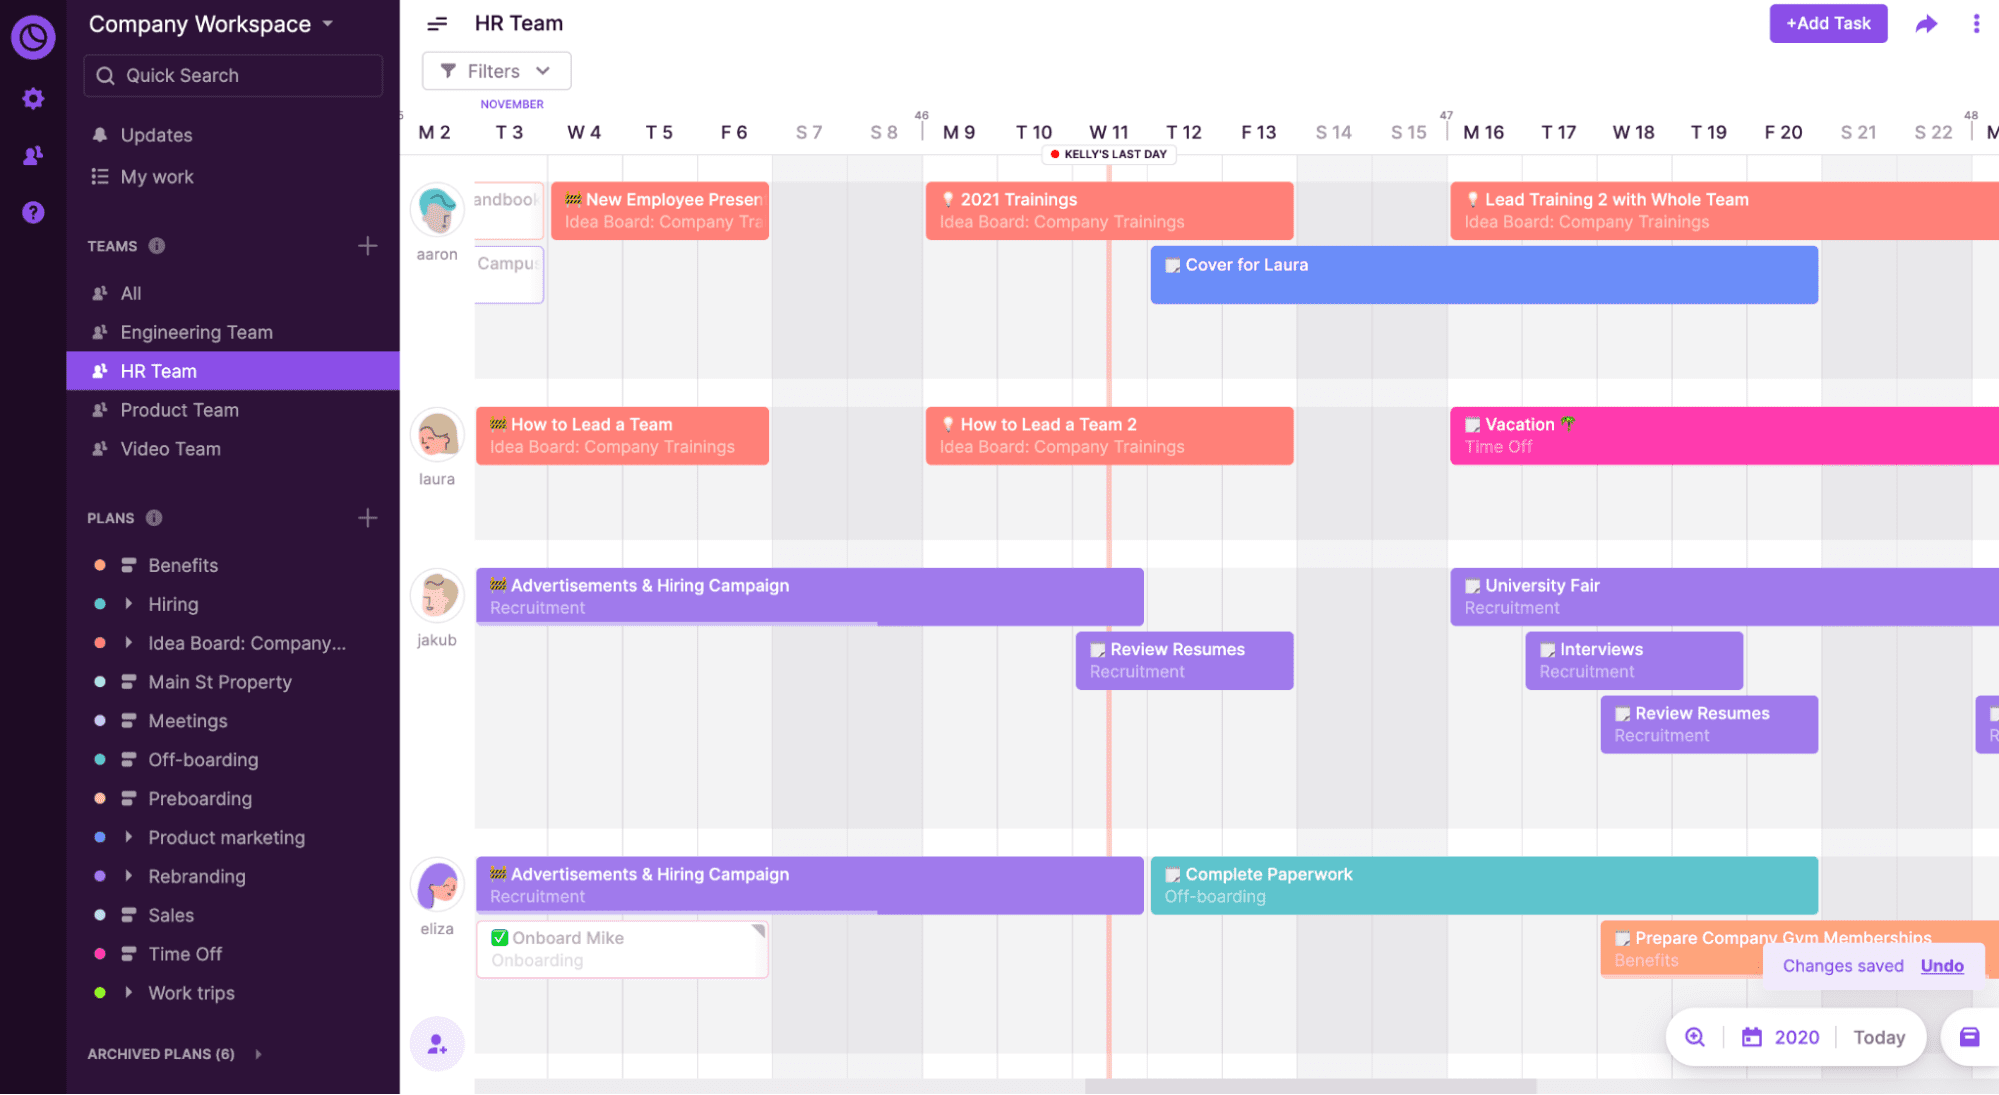
This can make it easier to see exactly which teams are overworked and who you might need to hire to meet client demand.
Within “Team view,” use the magnifying glass icon in the lower right-hand corner to toggle between zoom levels.
Weekly and monthly views are perfect for short-term planning and continuously monitoring current workloads to optimize resource allocation.
The three-month view and annual view highlight only your largest projects, giving you a high-level look at project volume in the coming quarters.
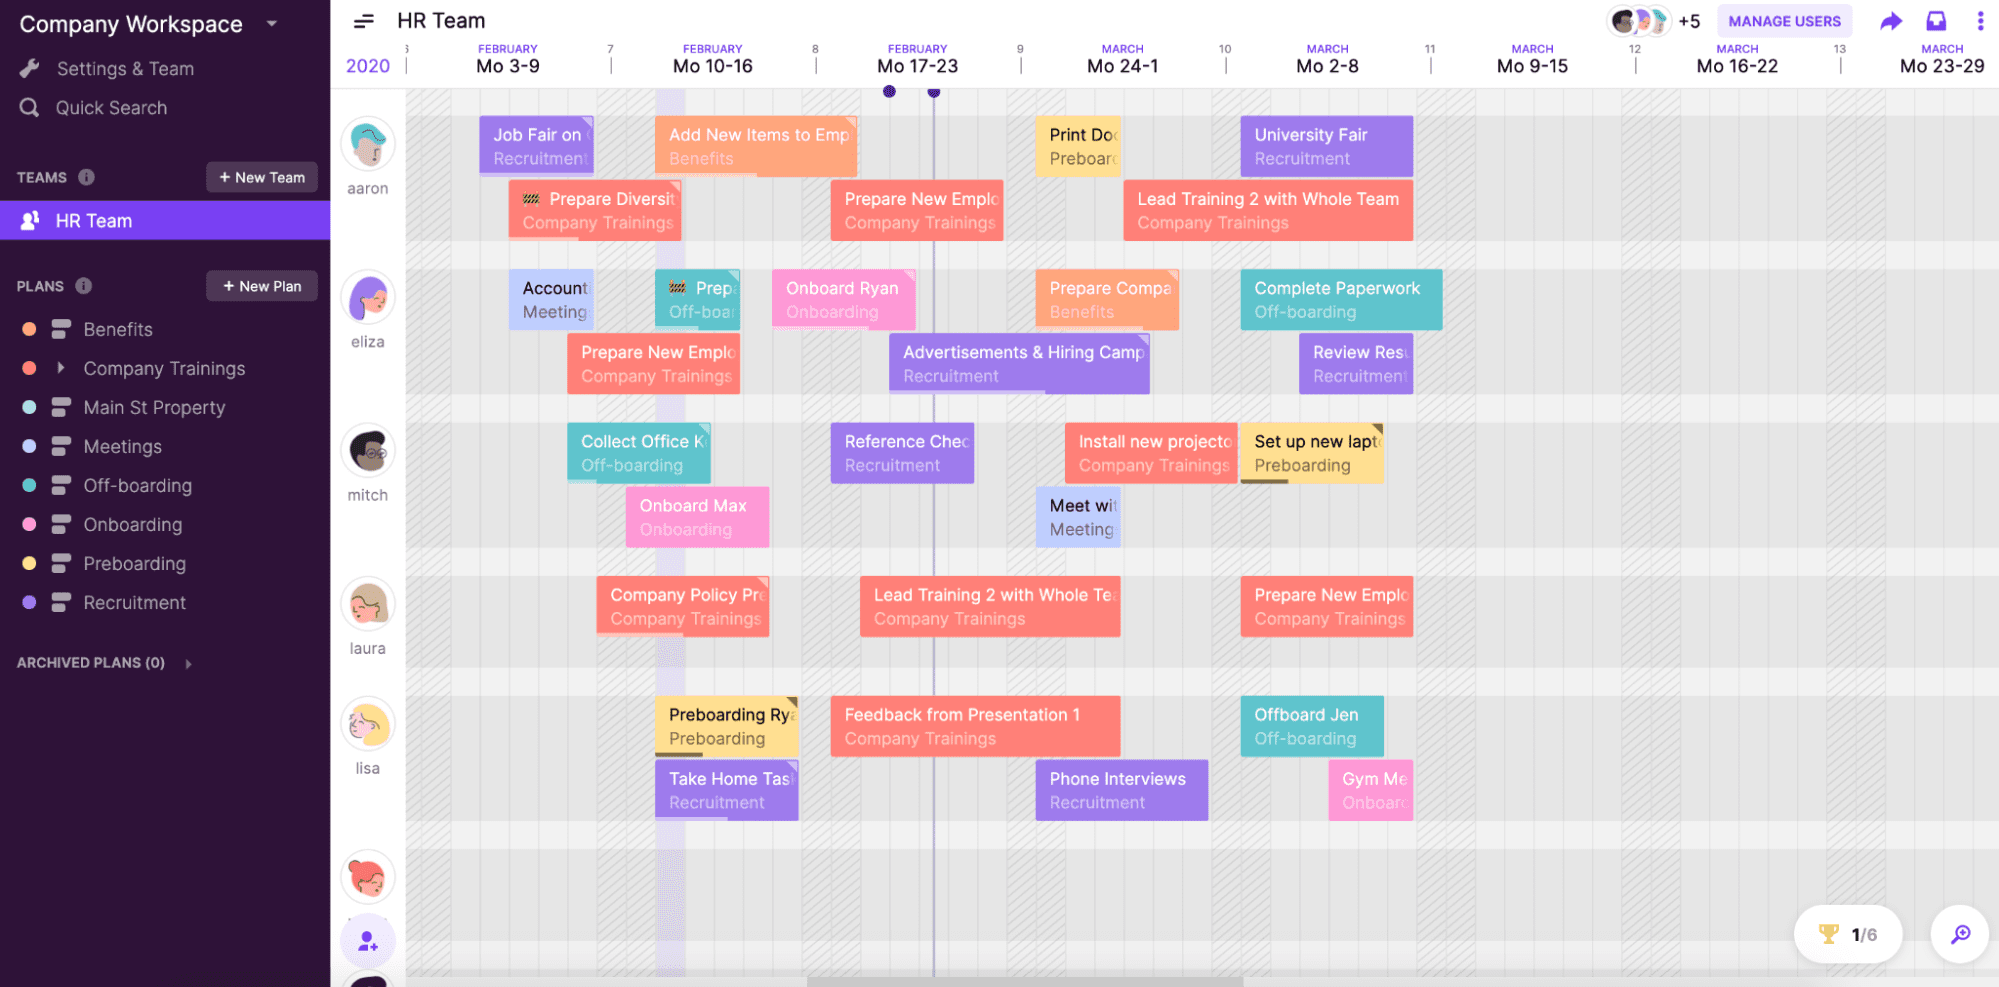
Toggl Plan’s high-level data allows you to keep all your planning in one place for easier coordination and accurately assess if you have the right support bandwidth to handle upcoming workloads.
What you’ll love
Operations Managers will love Toggl Plan’s “Availability Overview.” It provides an at-a-glance view of your team’s availability, capacity, and utilization for any upcoming time period.
The colored bar visualization displays the percentage booked and the number of hours available for each person. Red indicates someone is overbooked. Hovering shows further details like total working hours and workload.
From here, you can easily visualize workload distribution. Drag-and-drop tasks to reallocate work and immediately see availability adjustments.
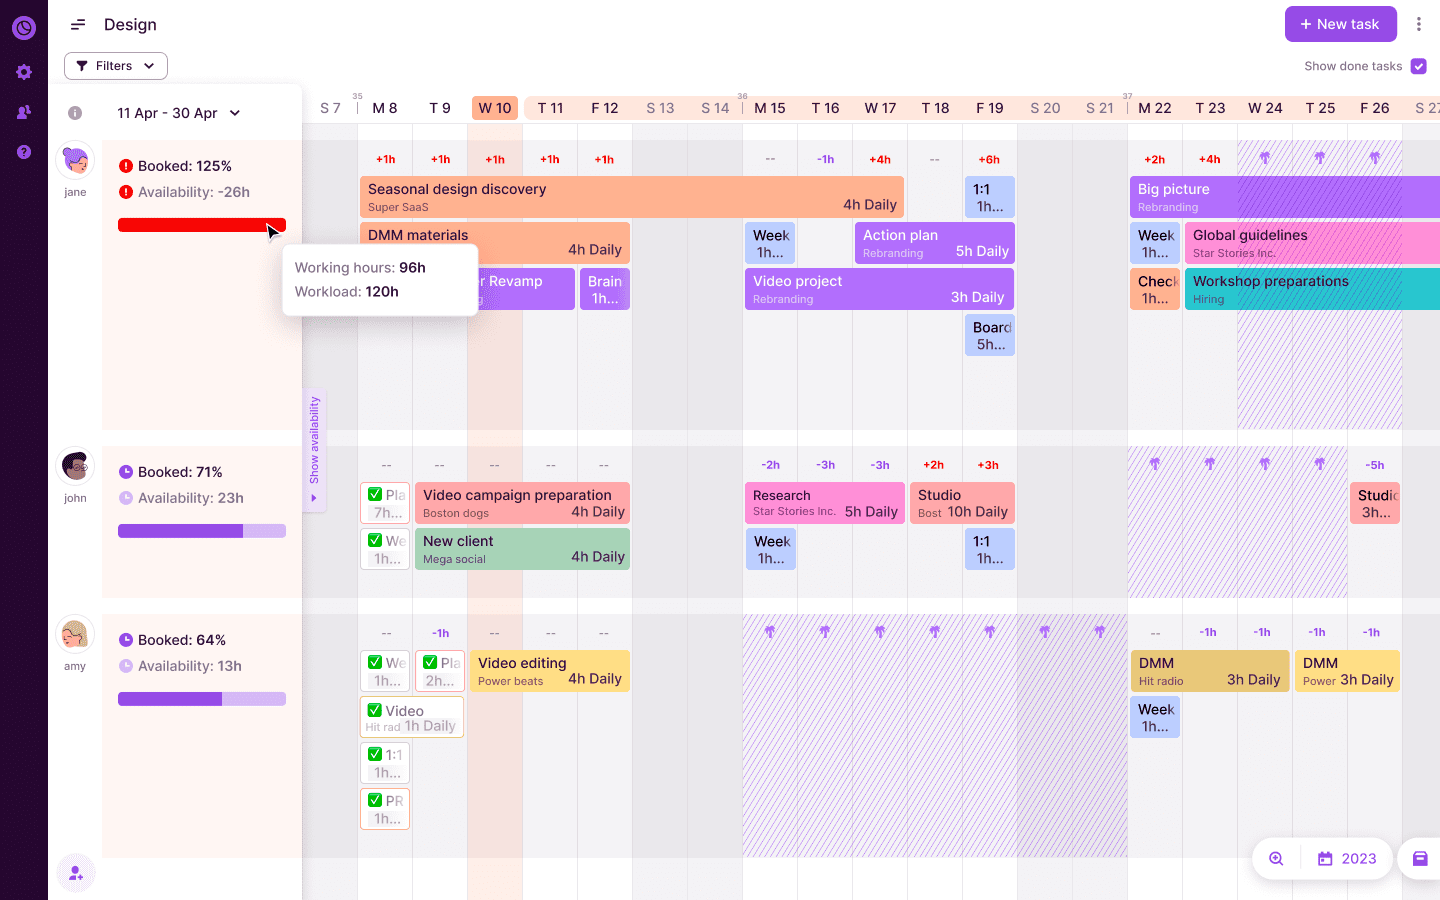
This provides a quick way to adjust work based on upcoming capacity, and allows you to ensure tasks are properly allocated for efficient resource optimization.
Core features
- Visual team scheduler lets you identify capacity and availability for up to one year.
- Drag and drop scheduling let you assign and re-allocate work based on project timelines or team capacity
- Notifications and tags make communication and collaboration simple
- Integrations with Slack, Google Calendar, Toggl Track and more let you manage calendars, communication, and time tracking seamlessly
Pricing
Toggl Plan has two plans:
- Team: $8 per user per month
- Business: $13.35 per user per month
A 14-day free trial is available for the Team plan.
Which tool is right for your team?
Finding the right capacity planning tool brings a lot of data to consider.
Operations managers need to focus on forecasting and modeling future workloads alongside optimizing and balancing staffing needs based on various scenarios.
While you could try to do that in a spreadsheet, a proper capacity planning tool will save you so much time and headaches and make your forecasting a lot more accurate.
If you’re ready to implement an end-to-end solution designed for agencies and professional services, try Scoro. Scoro has everything operations managers need to forecast client demand, make data-driven decisions, and optimize your resources as your business grows.
Start your free trial of Scoro today →


