All these signs point to issues with resource scheduling.
Improve your scheduling process to establish clear assignments and due dates, eliminate delays and miscommunications, and boost your team’s overall productivity.
Here’s what you need to know:
What is resource scheduling?
Resource scheduling involves assigning tasks with defined start and end dates to specific team members. And matching individual skills and availability to daily tasks.
The process converts high-level project plans into day-to-day work. Each task has a designated owner and timeframe to prevent confusion and delays.
For example, UI designer Sarah knows that she has three days to deliver wireframes by a Wednesday deadline, while developer Tom also has to deliver the login box within that time frame.
Capacity planning vs resource planning vs resource scheduling
Resource scheduling in project management is the final, detailed step in a three-part process of managing your team’s workload. Each step narrows the focus and moves the project from a high-level overview to individual, daily tasks:
- Capacity planning evaluates your overall ability to take on projects. It answers questions like: “Do we have enough developers to handle three new website builds next quarter?”
- Resource planning determines which roles and team members suit specific projects. For example, “Which designers have the right skills and availability for our upcoming app redesign?”
- Resource scheduling assigns precise tasks and timelines. For example, “Emma will work on the product page layouts on Monday and Tuesday and deliver at the end of the day (EOD). And Jake will work on implementing the navigation menu from Wednesday through Friday with an EOD deadline.”
Resource scheduling prerequisites: What you need before you start
Before creating your resource schedule, you first need three specific elements in place:
- Your capacity plan: A clear picture of your team’s available time, considering existing workloads, skill sets, and upcoming projects and PTO. Effective scheduling ensures you have enough people with the right skills to complete the project without overworking anyone.
- Your detailed project scope: A well-defined project scope with specific deliverables and milestones. The project scope outlines what work needs to be done, which guides how you’ll create tasks and deadlines.
- Your resource plan: A clear roster of which roles and people will work on certain projects, established during the resource planning phase. This influences how you’ll create and allocate tasks.
Without them, you risk creating an inaccurate, unrealistic, or completely unworkable schedule, leading to delays, budget overruns, and frustrated team members.
Top Tip
Scoro can help you automate and manage all these key pieces. For example, Cosmonauts & Kings was able to increase billable utilization, gain control over external costs, and improve project margins with Scoro’s unified platform.

How to schedule resources for your projects
Outlining and assigning tasks to your team members instead of just telling them what end product they need to deliver takes time and effort.
But it’s worth every minute you put into it.
With clearly defined steps in a resource schedule, you’ll see:
- Fewer mix-ups between team members
- Less scrambling to meet deadlines
- More successful projects
This all translates to projects completed on time and within budget, leading to increased profitability and happier clients.
Let’s walk through the steps to effective resource scheduling:
1. Break down the project work into tasks
Create a Work Breakdown Structure (WBS) to define the project’s key areas and tasks clearly.
Here’s what it looks like:
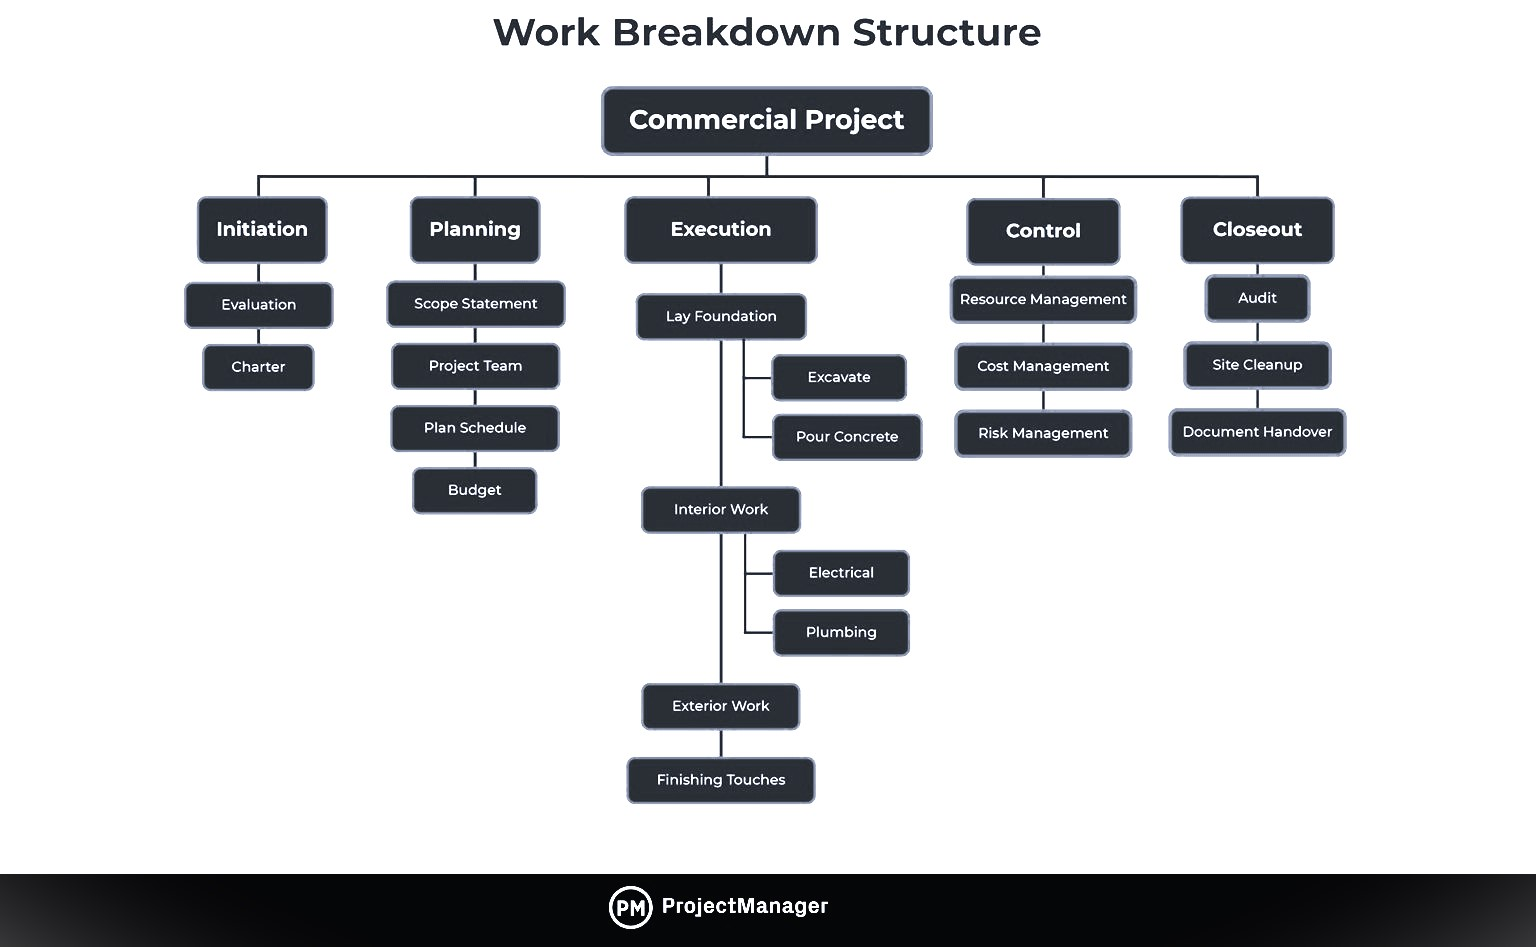
Use the info on deliverables and phases you listed out while scoping and estimating project costs as your starting point.
Now, break these down into more granular, actionable tasks. This is where you create the hierarchical structure of your WBS.
For example, if you’re working on a website redesign project, you might include these high-level phases: design, copywriting, and development.
Then, create specific tasks and task durations within each phase.
For instance:
Design phase:
- Create wireframes for homepage (Two days)
- Implement a new color scheme (One day)
- Develop responsive layouts for mobile devices (Three days)
Copywriting phase:
- Write new homepage content (Two days)
- Revise the “About Us” page (One day)
- Create product descriptions (Three days)
Development phase:
- Set up development environment (One day)
- Code homepage layout (Three days)
- Implement responsive design elements (Two days)
- Integrate content management system (Two days)
Once you’ve defined your tasks, resource management software like Scoro can automate the remaining process.
In Scoro, you have two options for this: quote-to-task or task bundles.
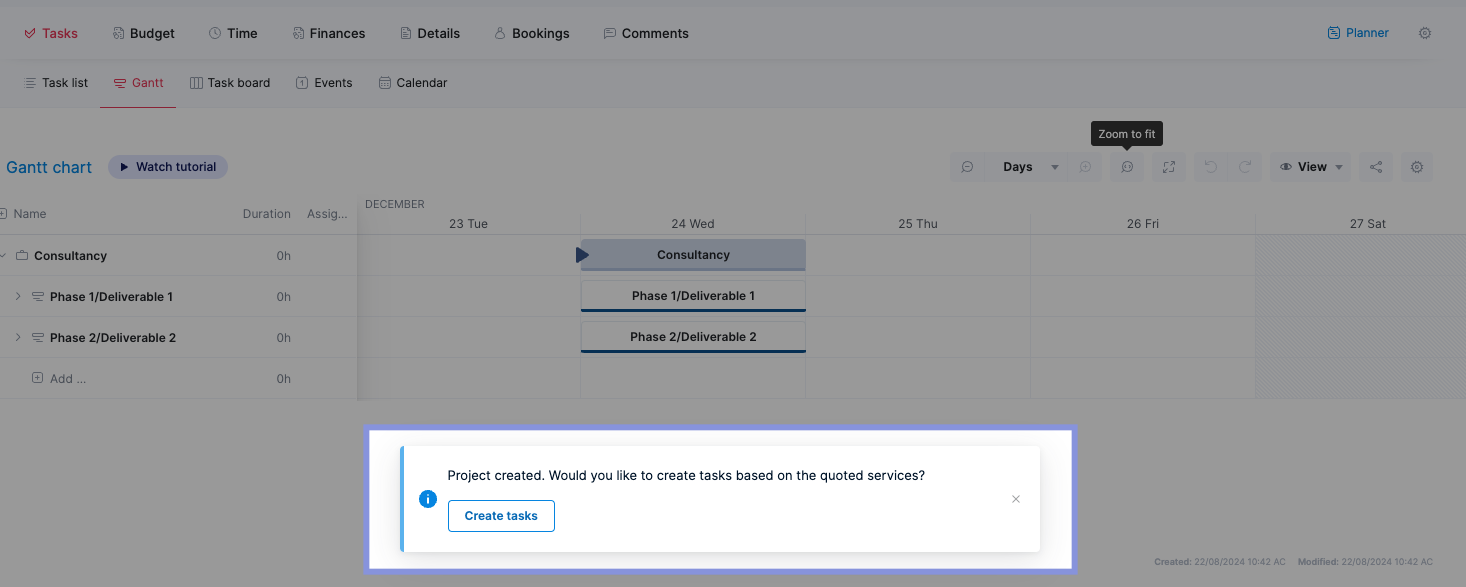
Use the quote-to-task feature if your initial quote closely mirrors your task list.
Once you turn your quote into a project, give it a project name, and hit save, you’ll see a quick-action pop-up that looks like this:
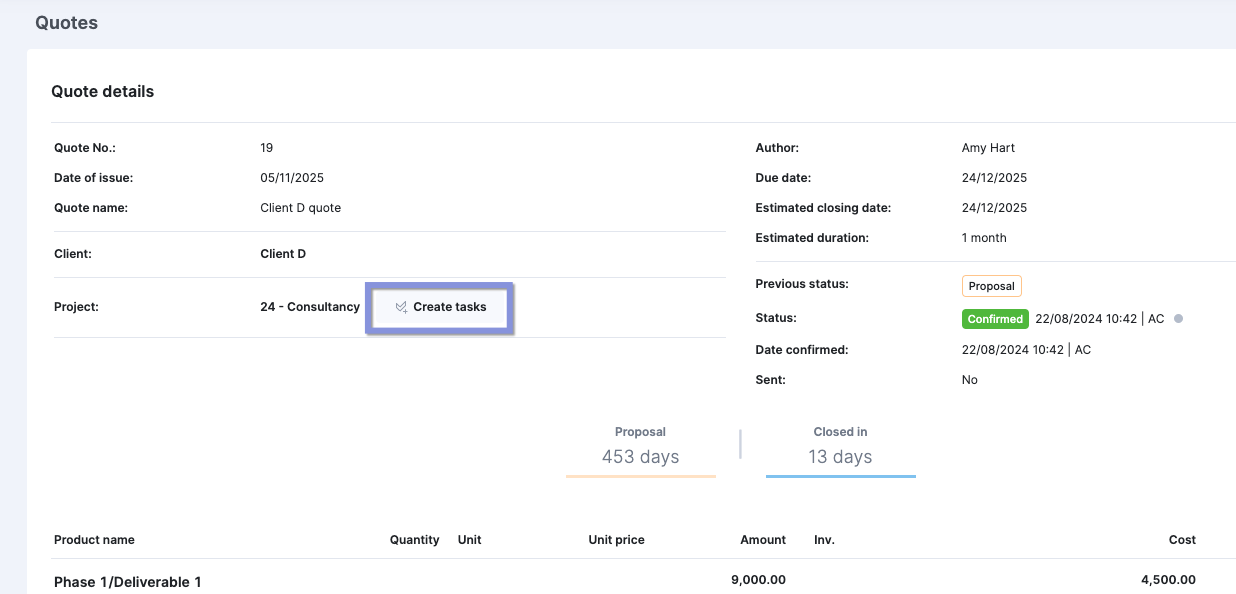
Or select “Create tasks” from within the quote:
Then, select the services you wish to assign as tasks. Remove any you don’t want to convert to tasks by clicking the “X” next to each item.
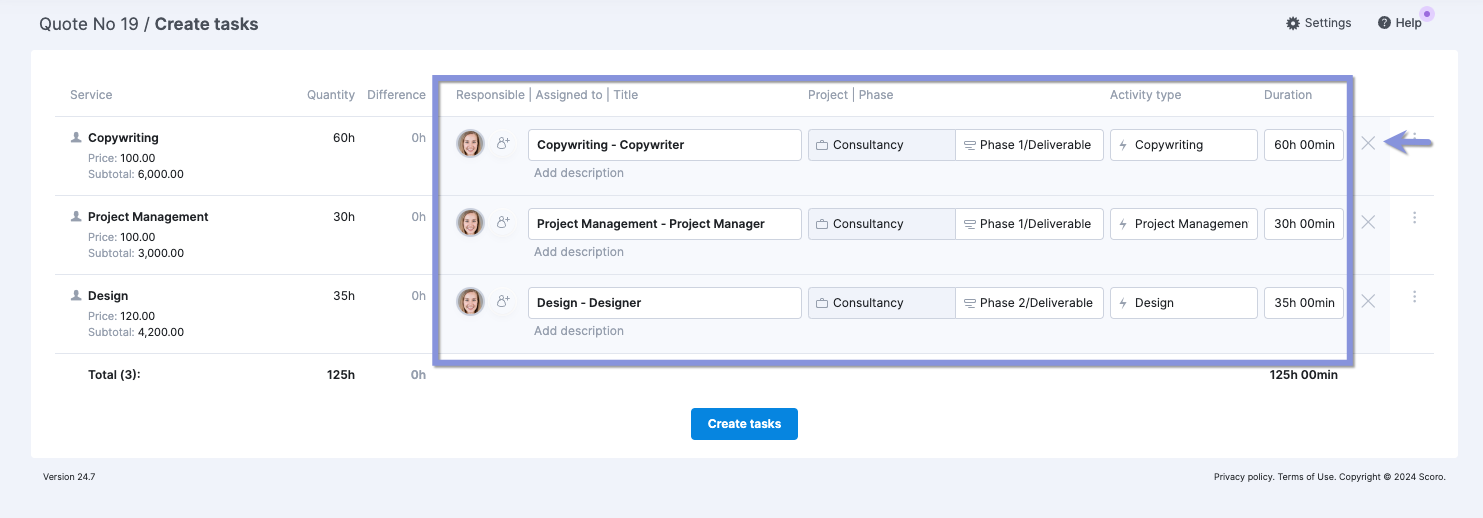
As you work through the list, you can rename the task and add or change its description if needed.
Once you’re all set, click “Create tasks.”
Your new tasks can be found within “Task list” under the “Tasks” tab in your project.
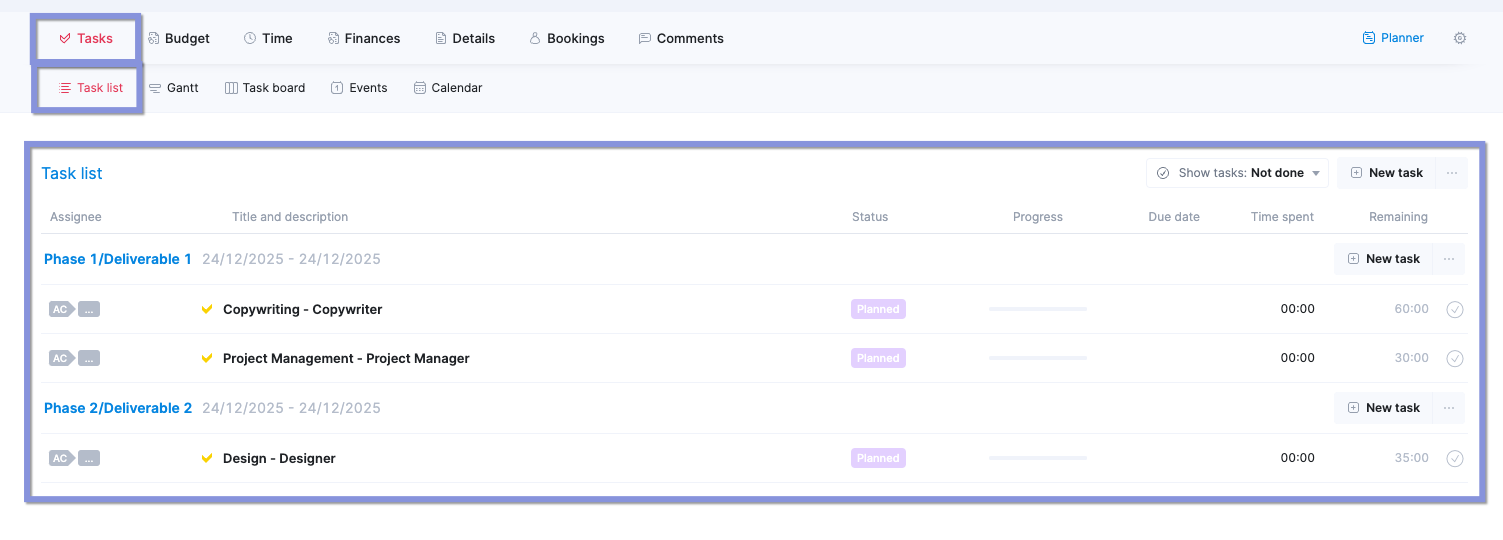
On the flip side, if your task list is structured differently than your initial quote, use Scoro’s task bundle option.
Task bundles are pre-defined sets of tasks you can create and save in Scoro for frequently recurring project types. This saves time and ensures consistency across similar projects.
Once you have a task bundle, you can easily add it to any new project and adjust it to specific task details.
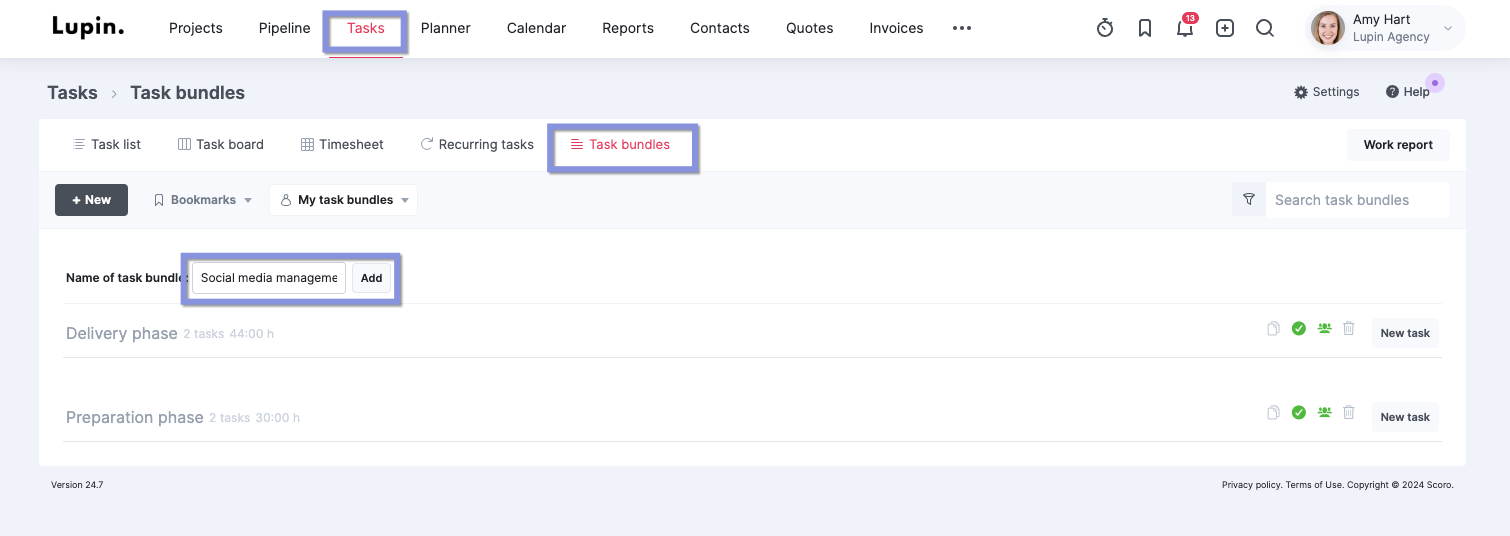
- Navigate to “Tasks” > “Task bundles”
- Click “+ New” to create a bundle
- Name your bundle (e.g., “Social media management”)
- Then, click “Add“
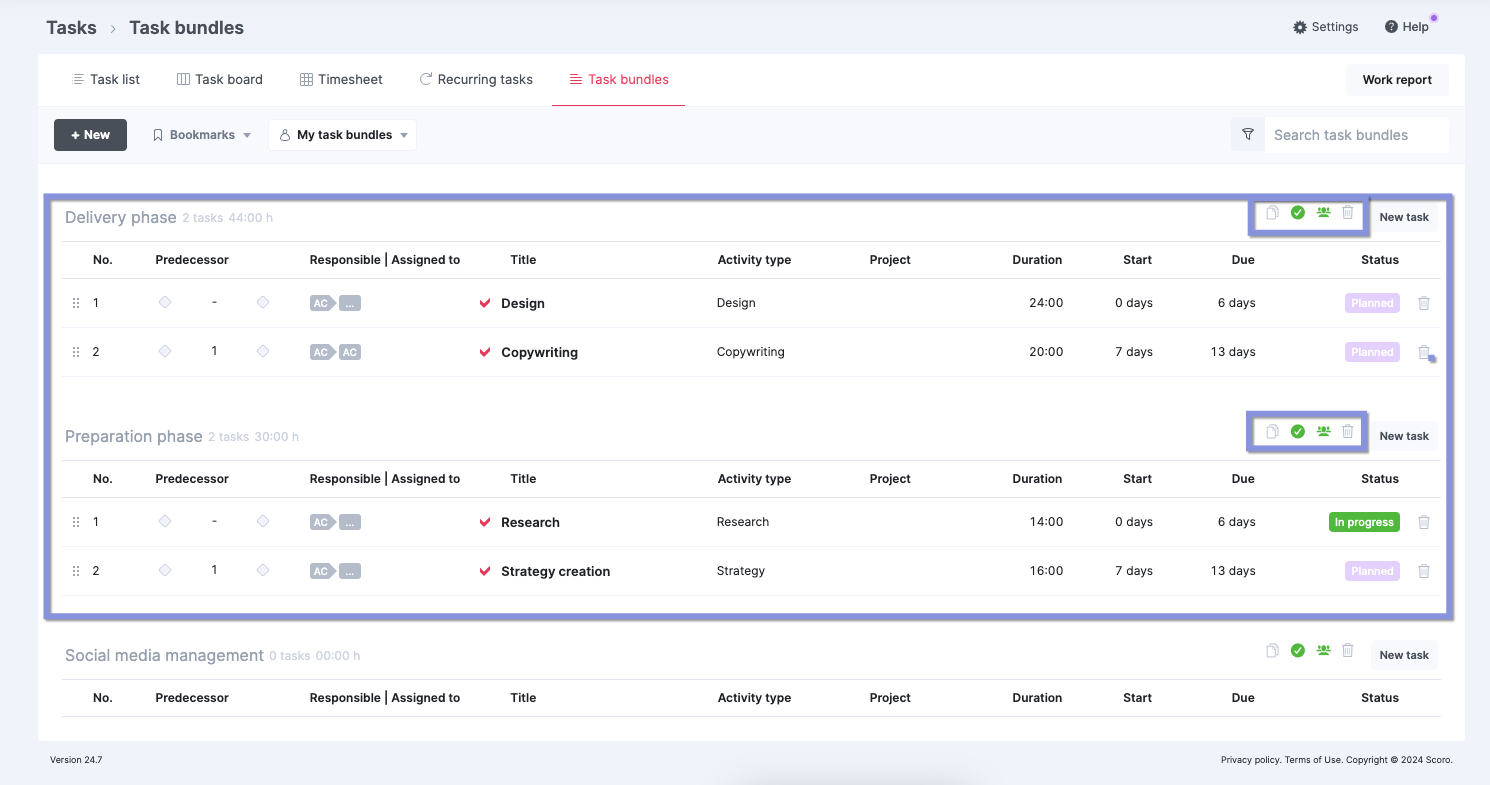
Within the newly created bundle, click “New task” to add individual tasks. You can set task durations, dependencies, assignees, and other details as needed.
Once you add the bundle, it’ll appear in the task bundle list as active, shared with other users, or empty with a green icon.
Here’s what each status means:
- Active: The task bundle is currently available for you to use in your projects.
- Shared with other users: The task bundle has been shared with other team members in your Scoro account, allowing them to use it in their projects as well.
- Empty: The task bundle does not currently contain any tasks.
2. Assign tasks to the project team
Once you’ve broken down your project into specific tasks, assign them to your team members.
When allocating tasks, consider the following factors:
- Skills: Match tasks to team members with the most relevant skills or expertise, like assigning complex coding tasks to your senior developers
- Availability: Distribute tasks based on team members’ current schedules to prevent overbooking and project delays
- Billable utilization: When assigning tasks, aim to keep your team members billable utilization rates between 70 and 80% to avoid costly burnout or disengagement
- Learning and development: Assign tasks that challenge team members and help them grow their skills, giving hands-on experience that broadens the work your existing in-house bench can take on
- Priorities: Allocate high-priority, fast-turnaround tasks to your most experienced team members to ensure they complete critical work on time
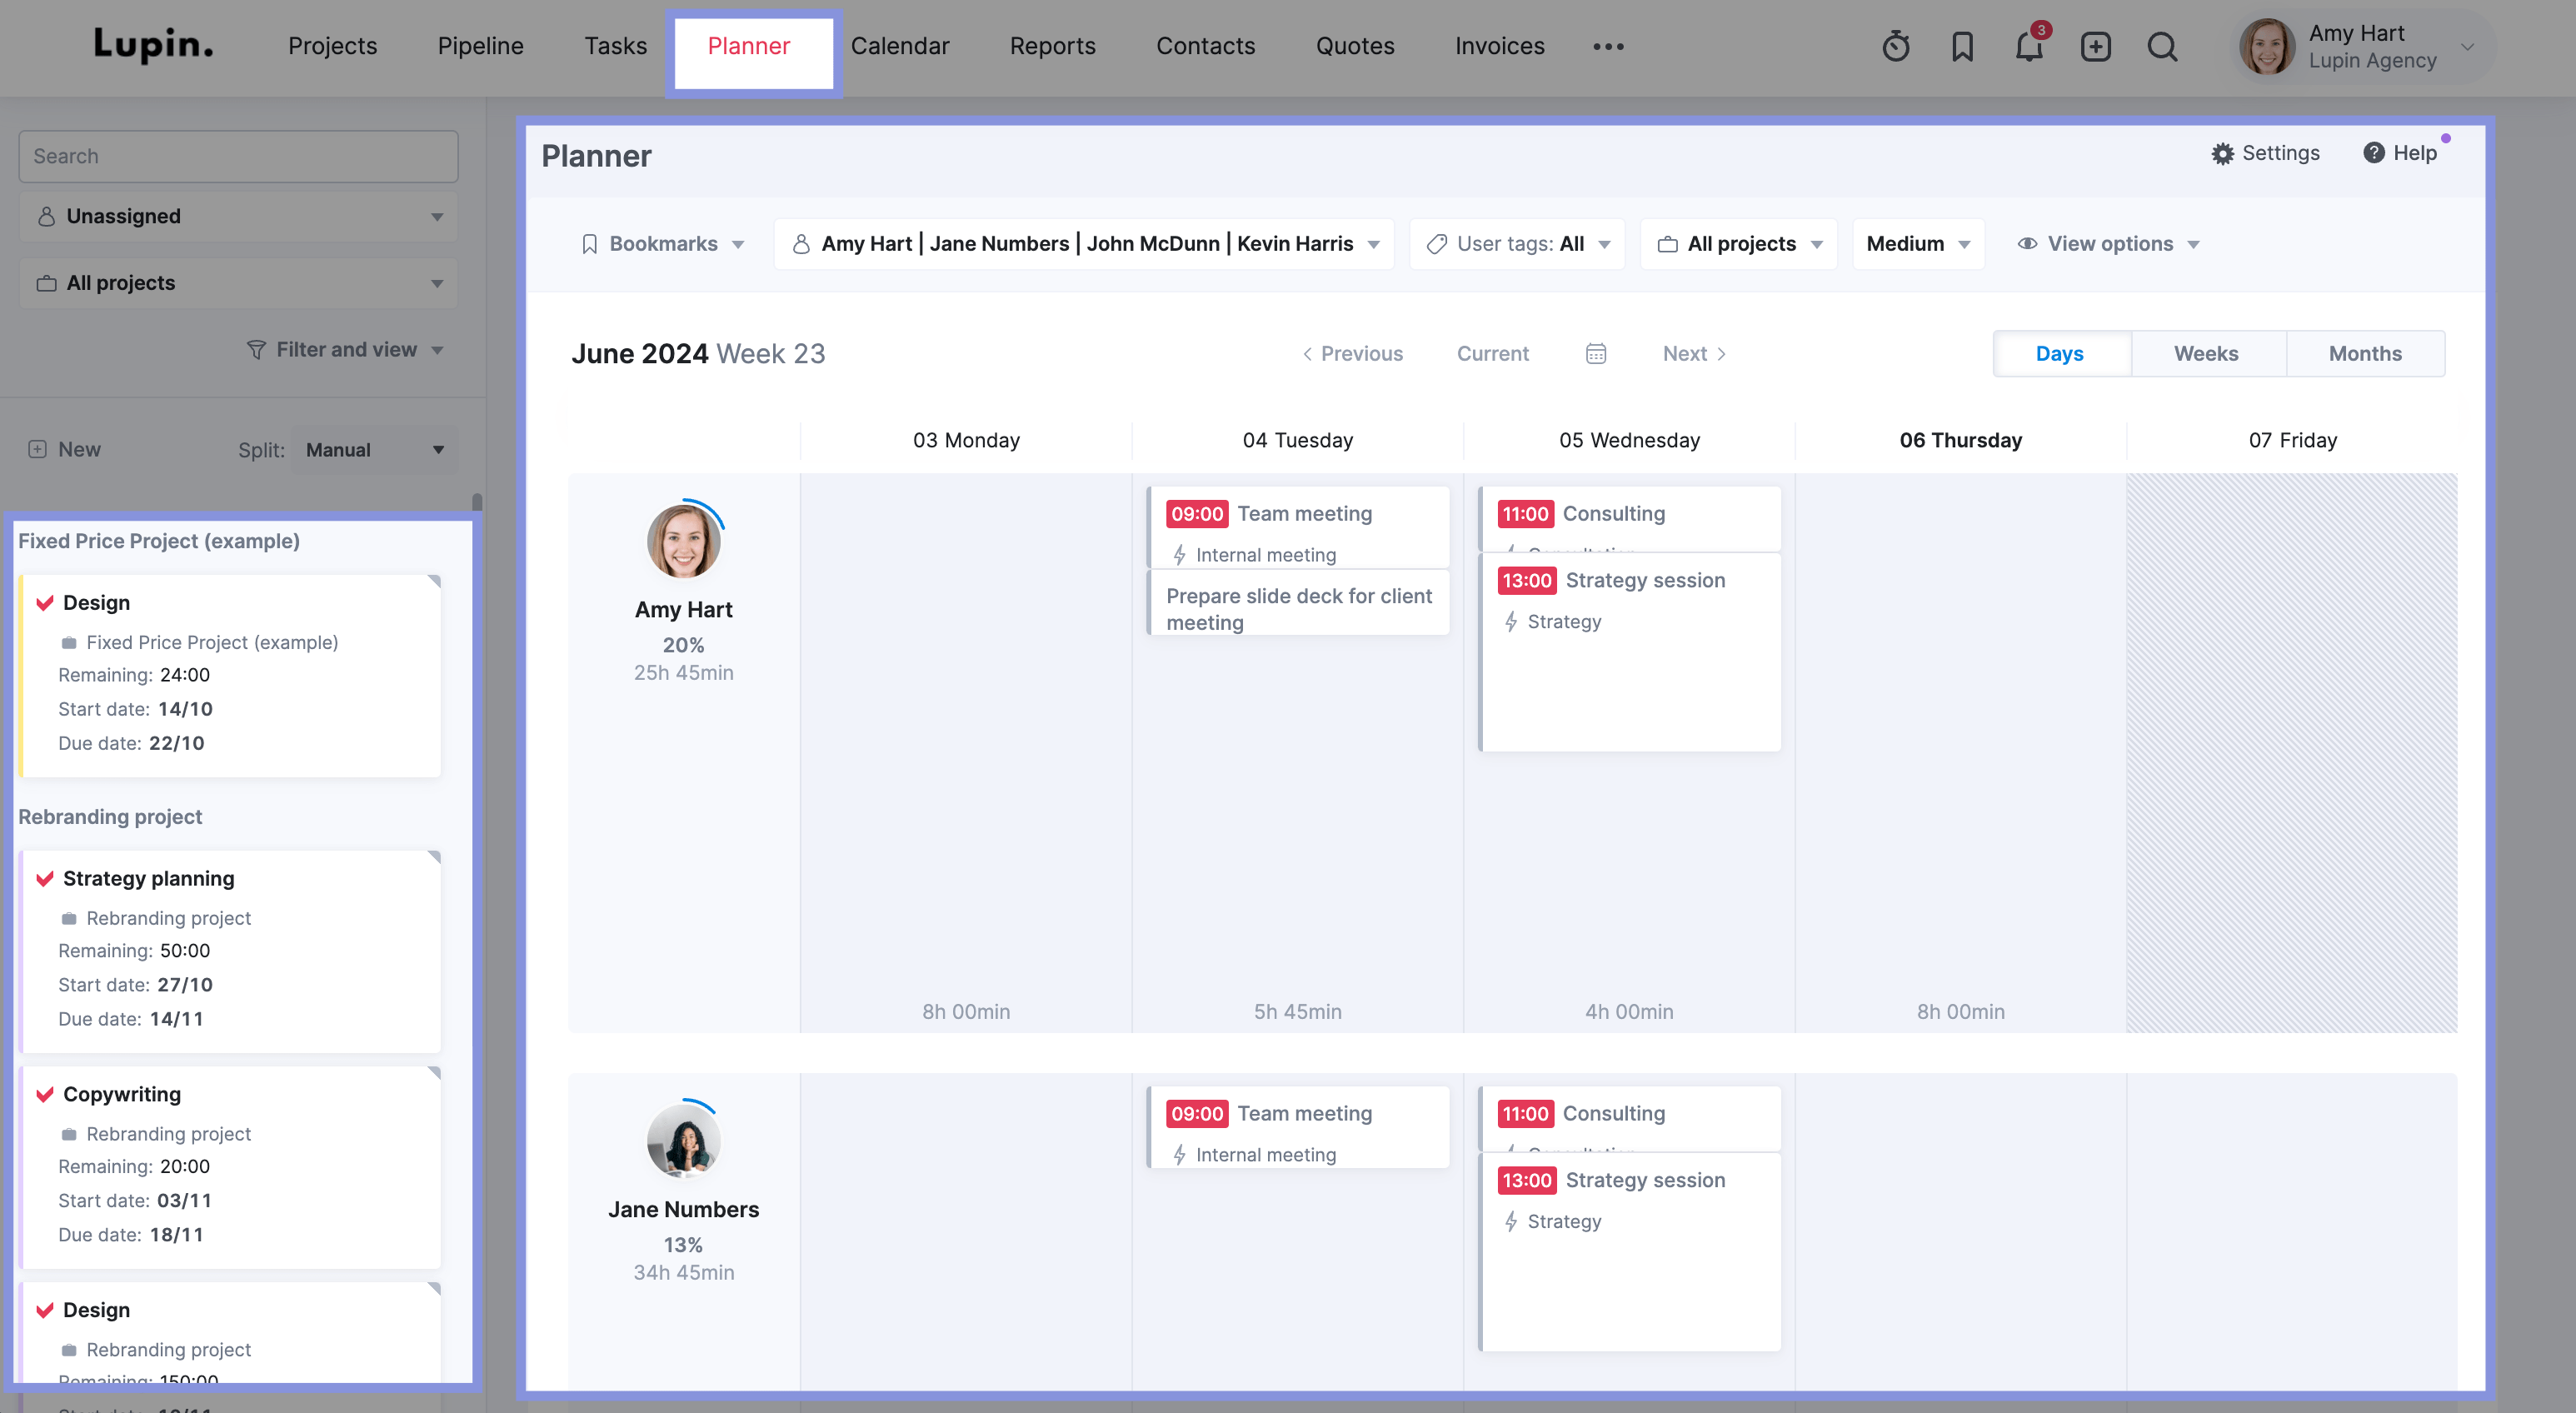
Once you decide who you want to work on each task, use the “Planner” tool to schedule work for your project team.
Here, you’ll see two main sections:
- Left panel: Shows all the unscheduled tasks waiting to be assigned
- Right panel: Shows your team members’ schedules, including their availability and any existing assignments
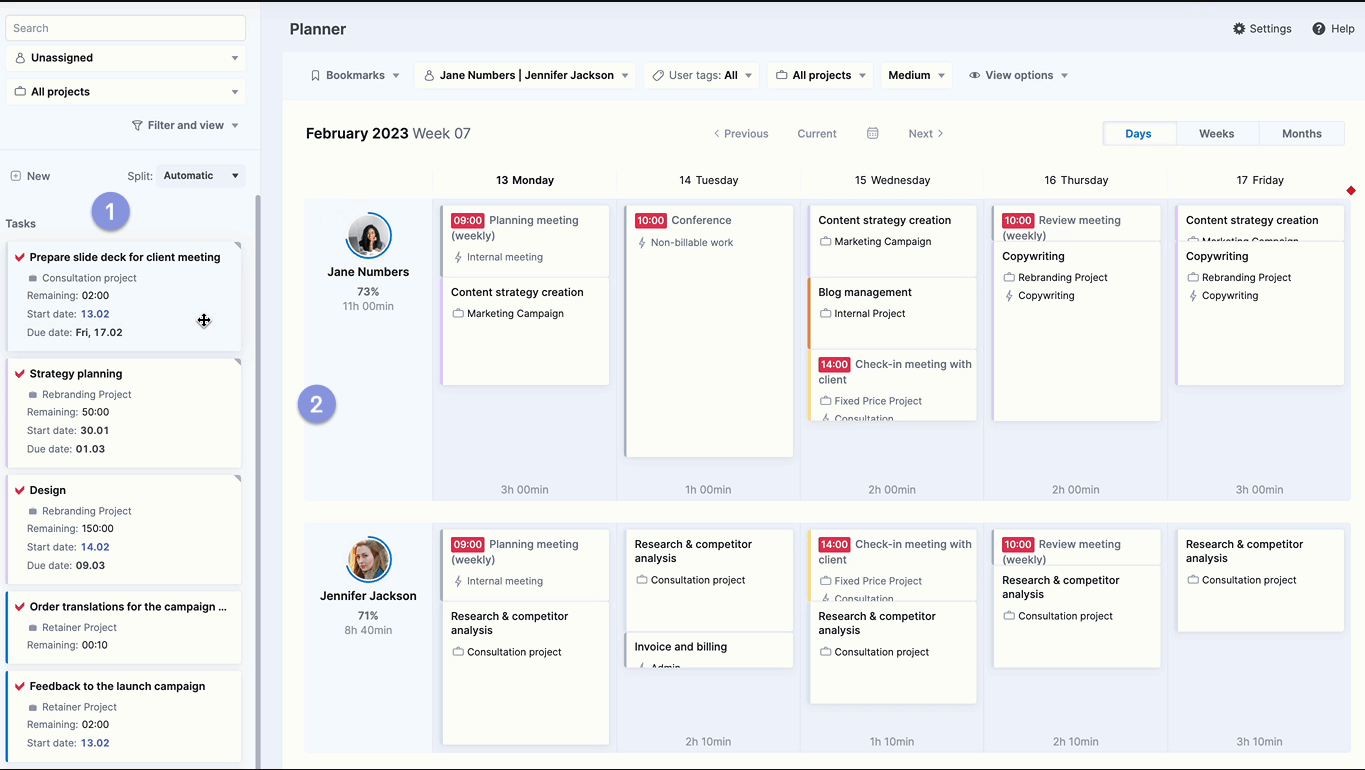
To assign a task, click on it in the left panel and drag it onto a team member’s schedule on the right.
From there, you have two main options:
- Automatic scheduling: Scoro can automatically fit them into available time slots in your team members’ schedules for shorter tasks.
- Manual splitting: For longer tasks (estimated to take multiple days or weeks) or when you need more control over placement, manually split them into smaller chunks and assign them across multiple days to ensure a balanced workload.
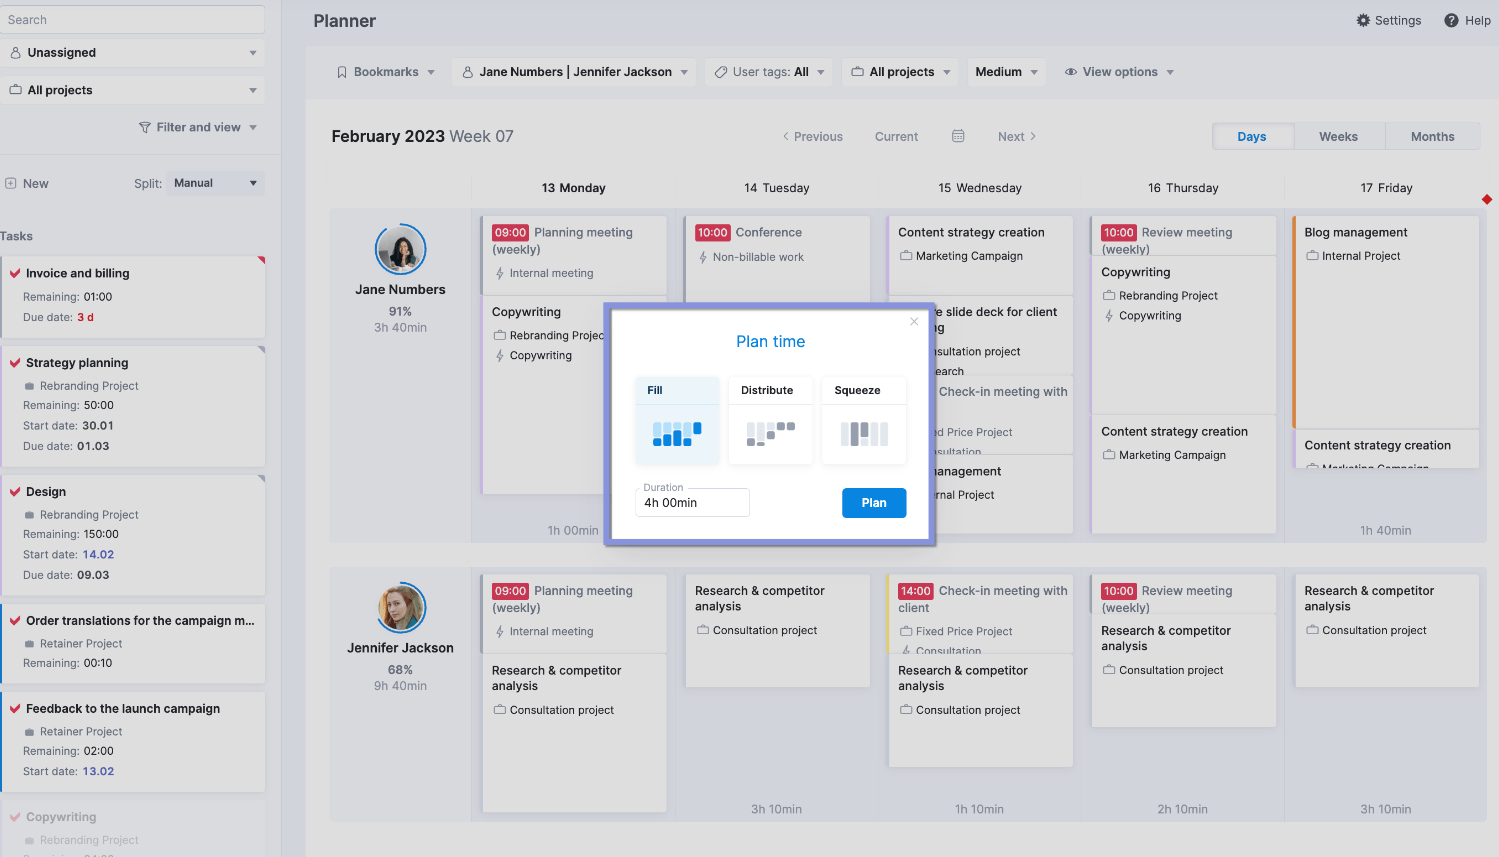
Choose from these options when assigning tasks:
- Fill: Use this when you want to utilize any free time in the team member’s schedule for the task.
- Distribute: This is useful for longer tasks that need to be spread out over multiple days, either optimizing for days with more availability or evenly distributing the work.
- Squeeze: Use this option for urgent tasks that need immediate attention, even if it means rescheduling other planned work.
Now, that team member will see the new task on their task list.
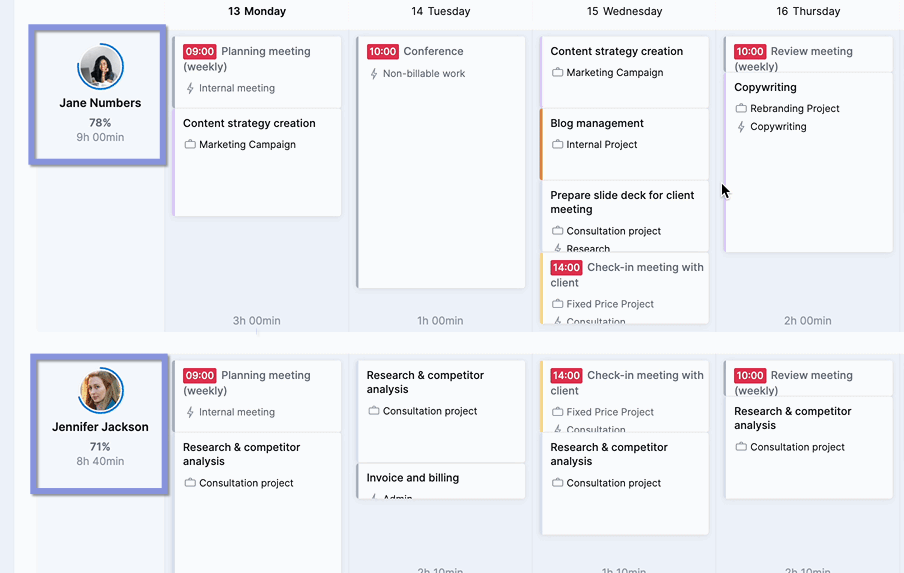
After scheduling tasks, review your team’s overall workload to make sure there’s no overbooking.
First, check the circle and percentage near each team member’s profile photo to see their capacity.
Remember: 75 to 80% is the sweet spot for billable work. Anything over that can lead to burnout. Meanwhile, lower numbers indicate a less productive (and profitable) use of their time.
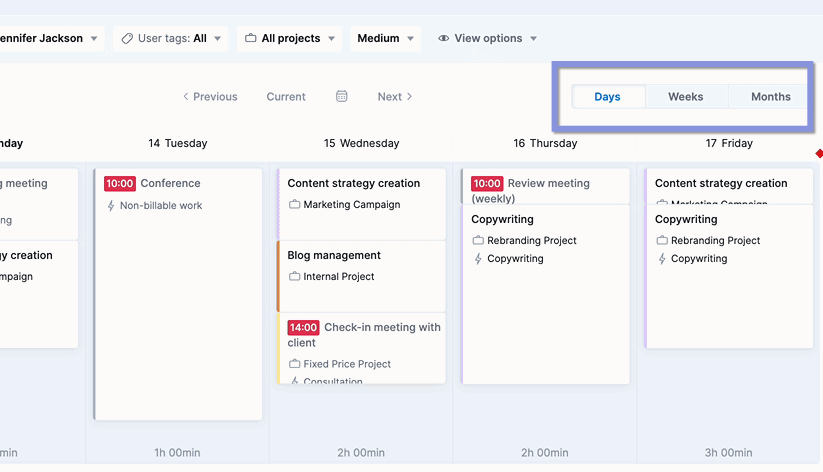
Fine-tune the schedule by reordering tasks or switching them to different team members if necessary.
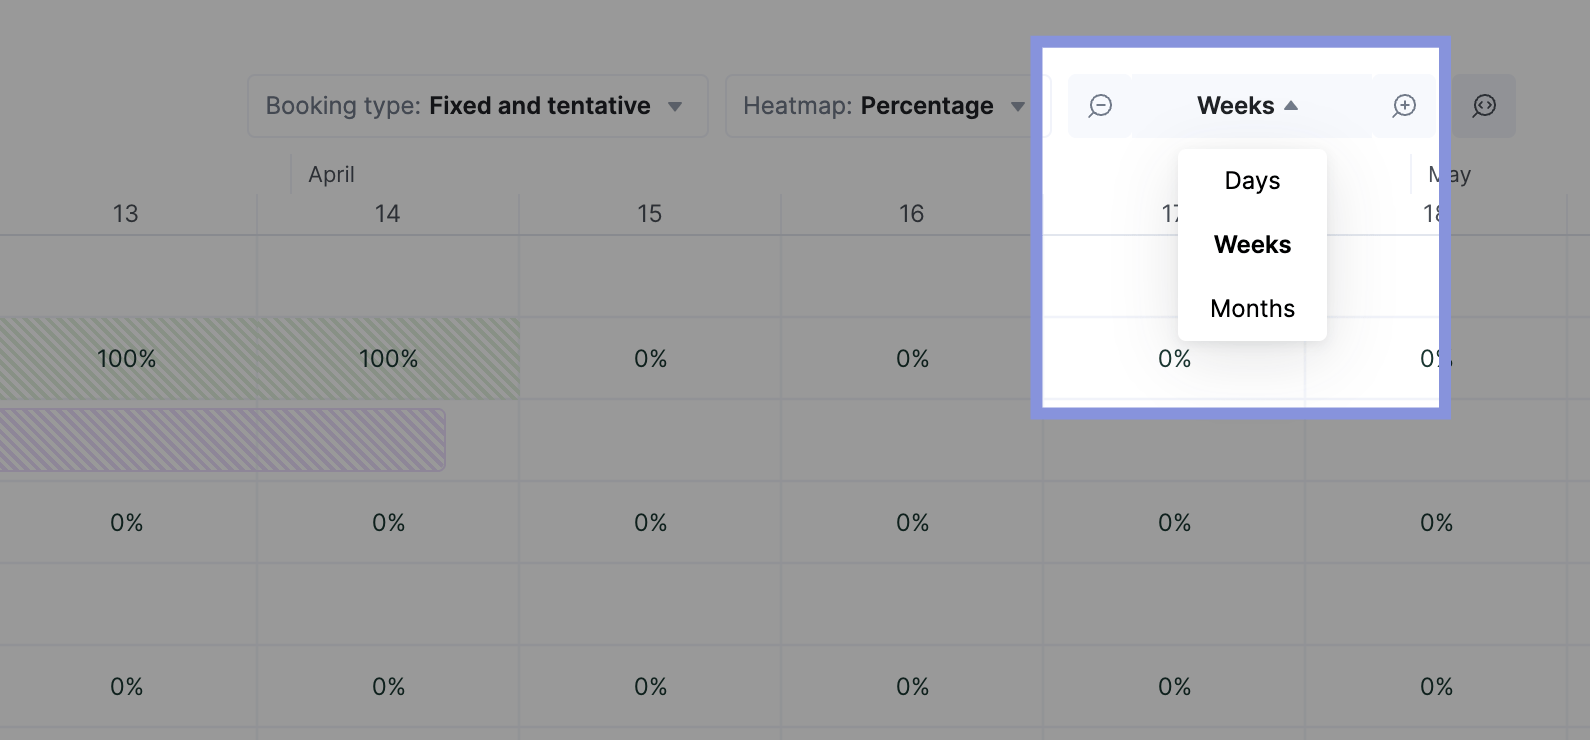
Then, use the “Days,” “Weeks,” and “Months” buttons in the upper right corner to toggle between different schedule views, making sure that any new assignments don’t conflict with future work.
3. Make it easy for your team to track their hours
With tasks assigned and schedules set, your project is ready to move into the execution phase. But to ensure your carefully crafted plan stays on track, there’s one more critical step: implementing consistent time tracking.
Accurate time logs give you a clear view of your project’s progress. This allows you to anticipate delays and helps the project stay on schedule and within budget.
Scoro offers three main ways to track time:
- Retrospective logging: Suitable for employees handling larger tasks or who prefer to log time after their work is finished
- Automatic tracking: Perfect for team members who consistently use their calendar to document their work
- Real-time tracking: Ideal for team members working on multiple smaller tasks throughout the day
As an example, let’s look at how the real-time tracker works:
Use the quick actions menu to select the clock icon. Then, select a recent task or use the search function to locate the task you’re about to start.
Click the play icon next to the task to begin tracking your time. When you’re finished, simply click the stop icon. The time you spent will be automatically logged for that task.
Or click the “Start time tracker” button in the Task view.
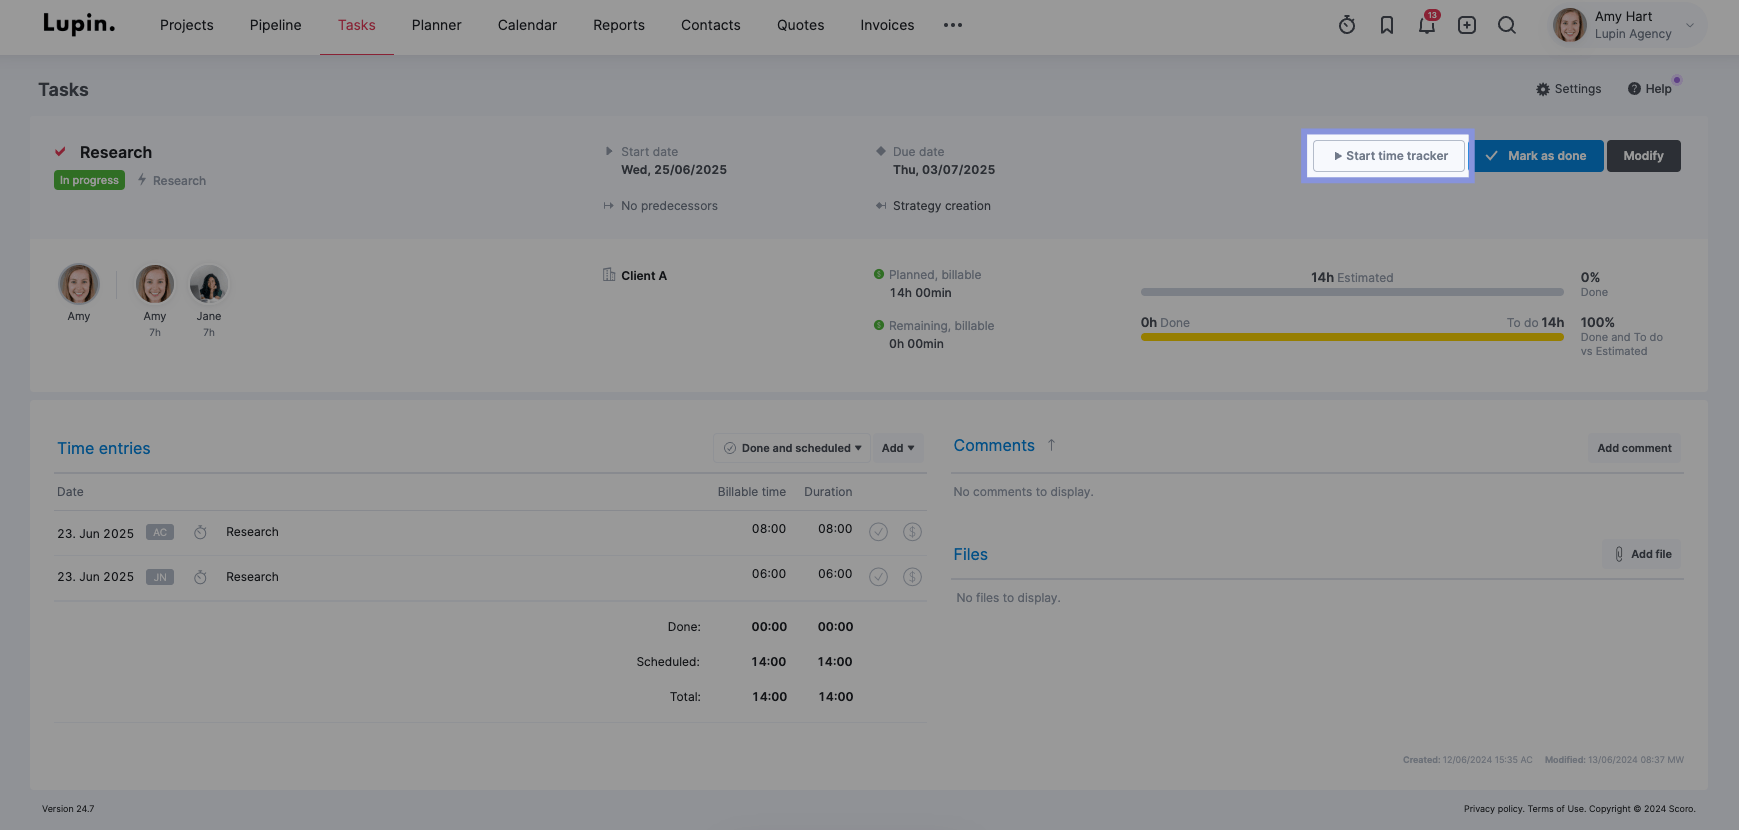
Want to pause and stop the timer? Just click the pause or “Mark as done” buttons.
Further reading: Time Tracking Best Practices to Get More Out of Your Time
4. Monitor and adjust workloads if needed
As your team progresses through tasks, unexpected challenges might pop up—maybe a key team member gets sick, a task takes longer than expected, or a client requests a major change.
These situations often require tweaking your team’s assignments and project timeline to keep things moving smoothly.
Regardless of the tracking method your team uses (manual time entries, the Scoro timer, or even third-party integrations, Scoro links all time entries automatically to their respective tasks and projects.
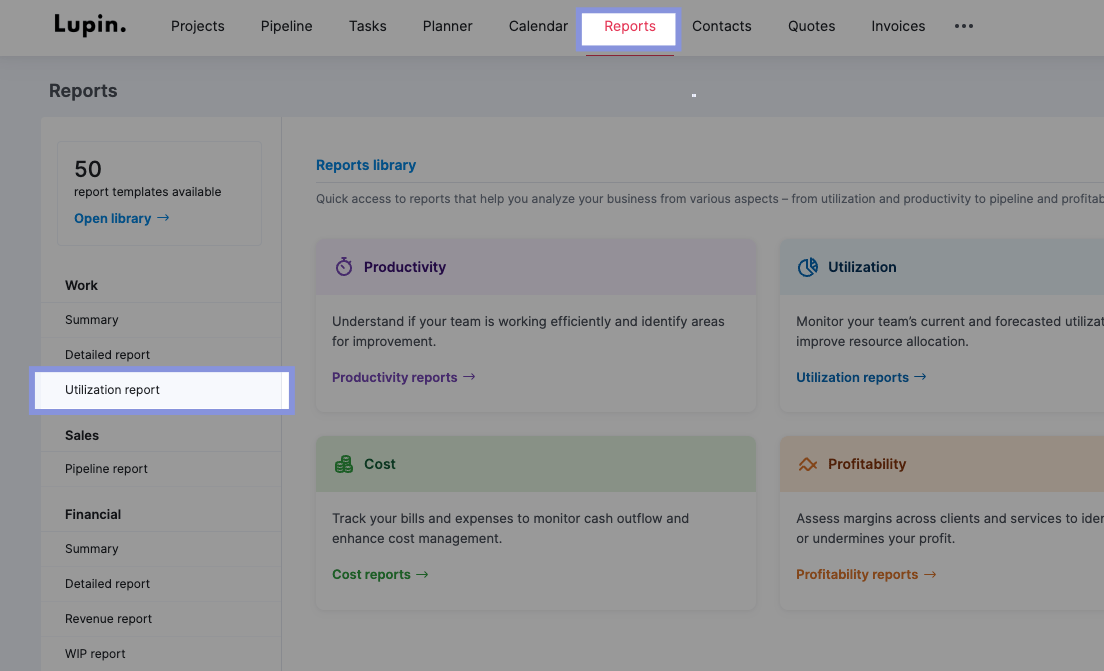
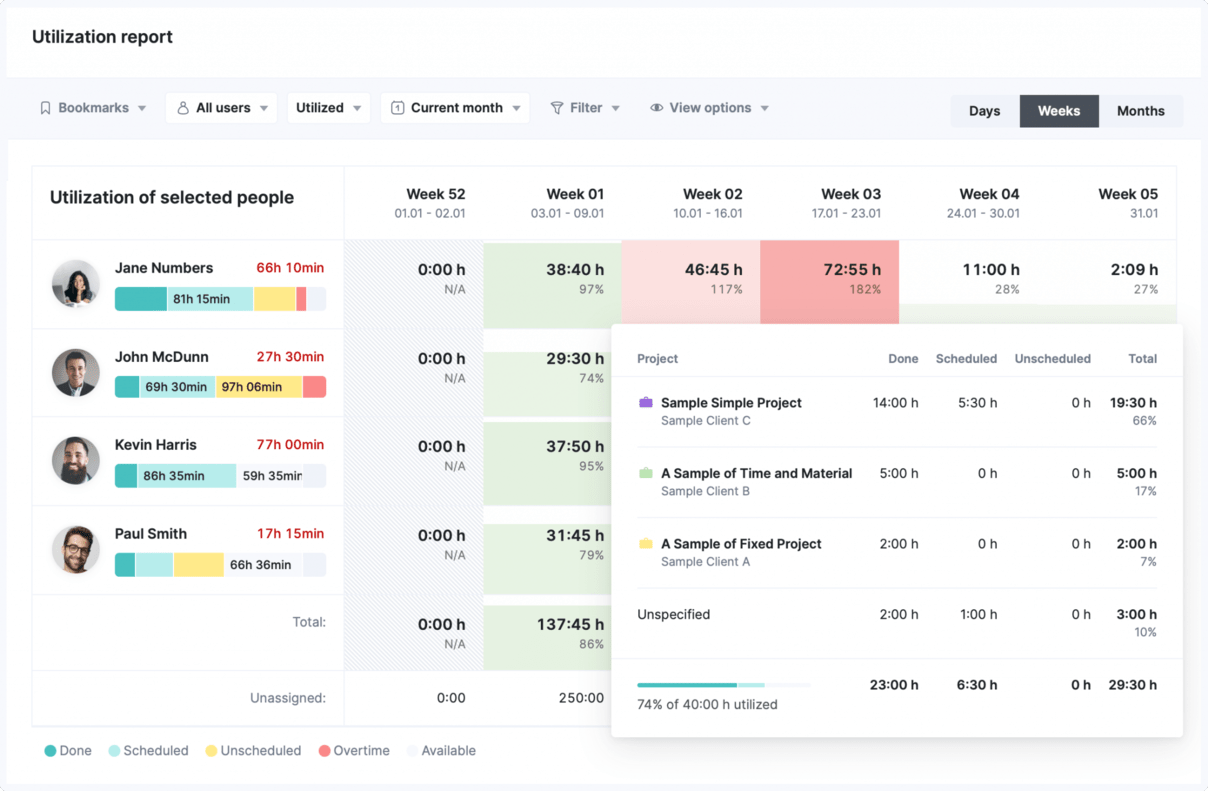
You can also see how your team uses their time in the “Utilization report.”
Click “Reports” from the main navigation menu. Select “Utilization report” from the panel on the left.
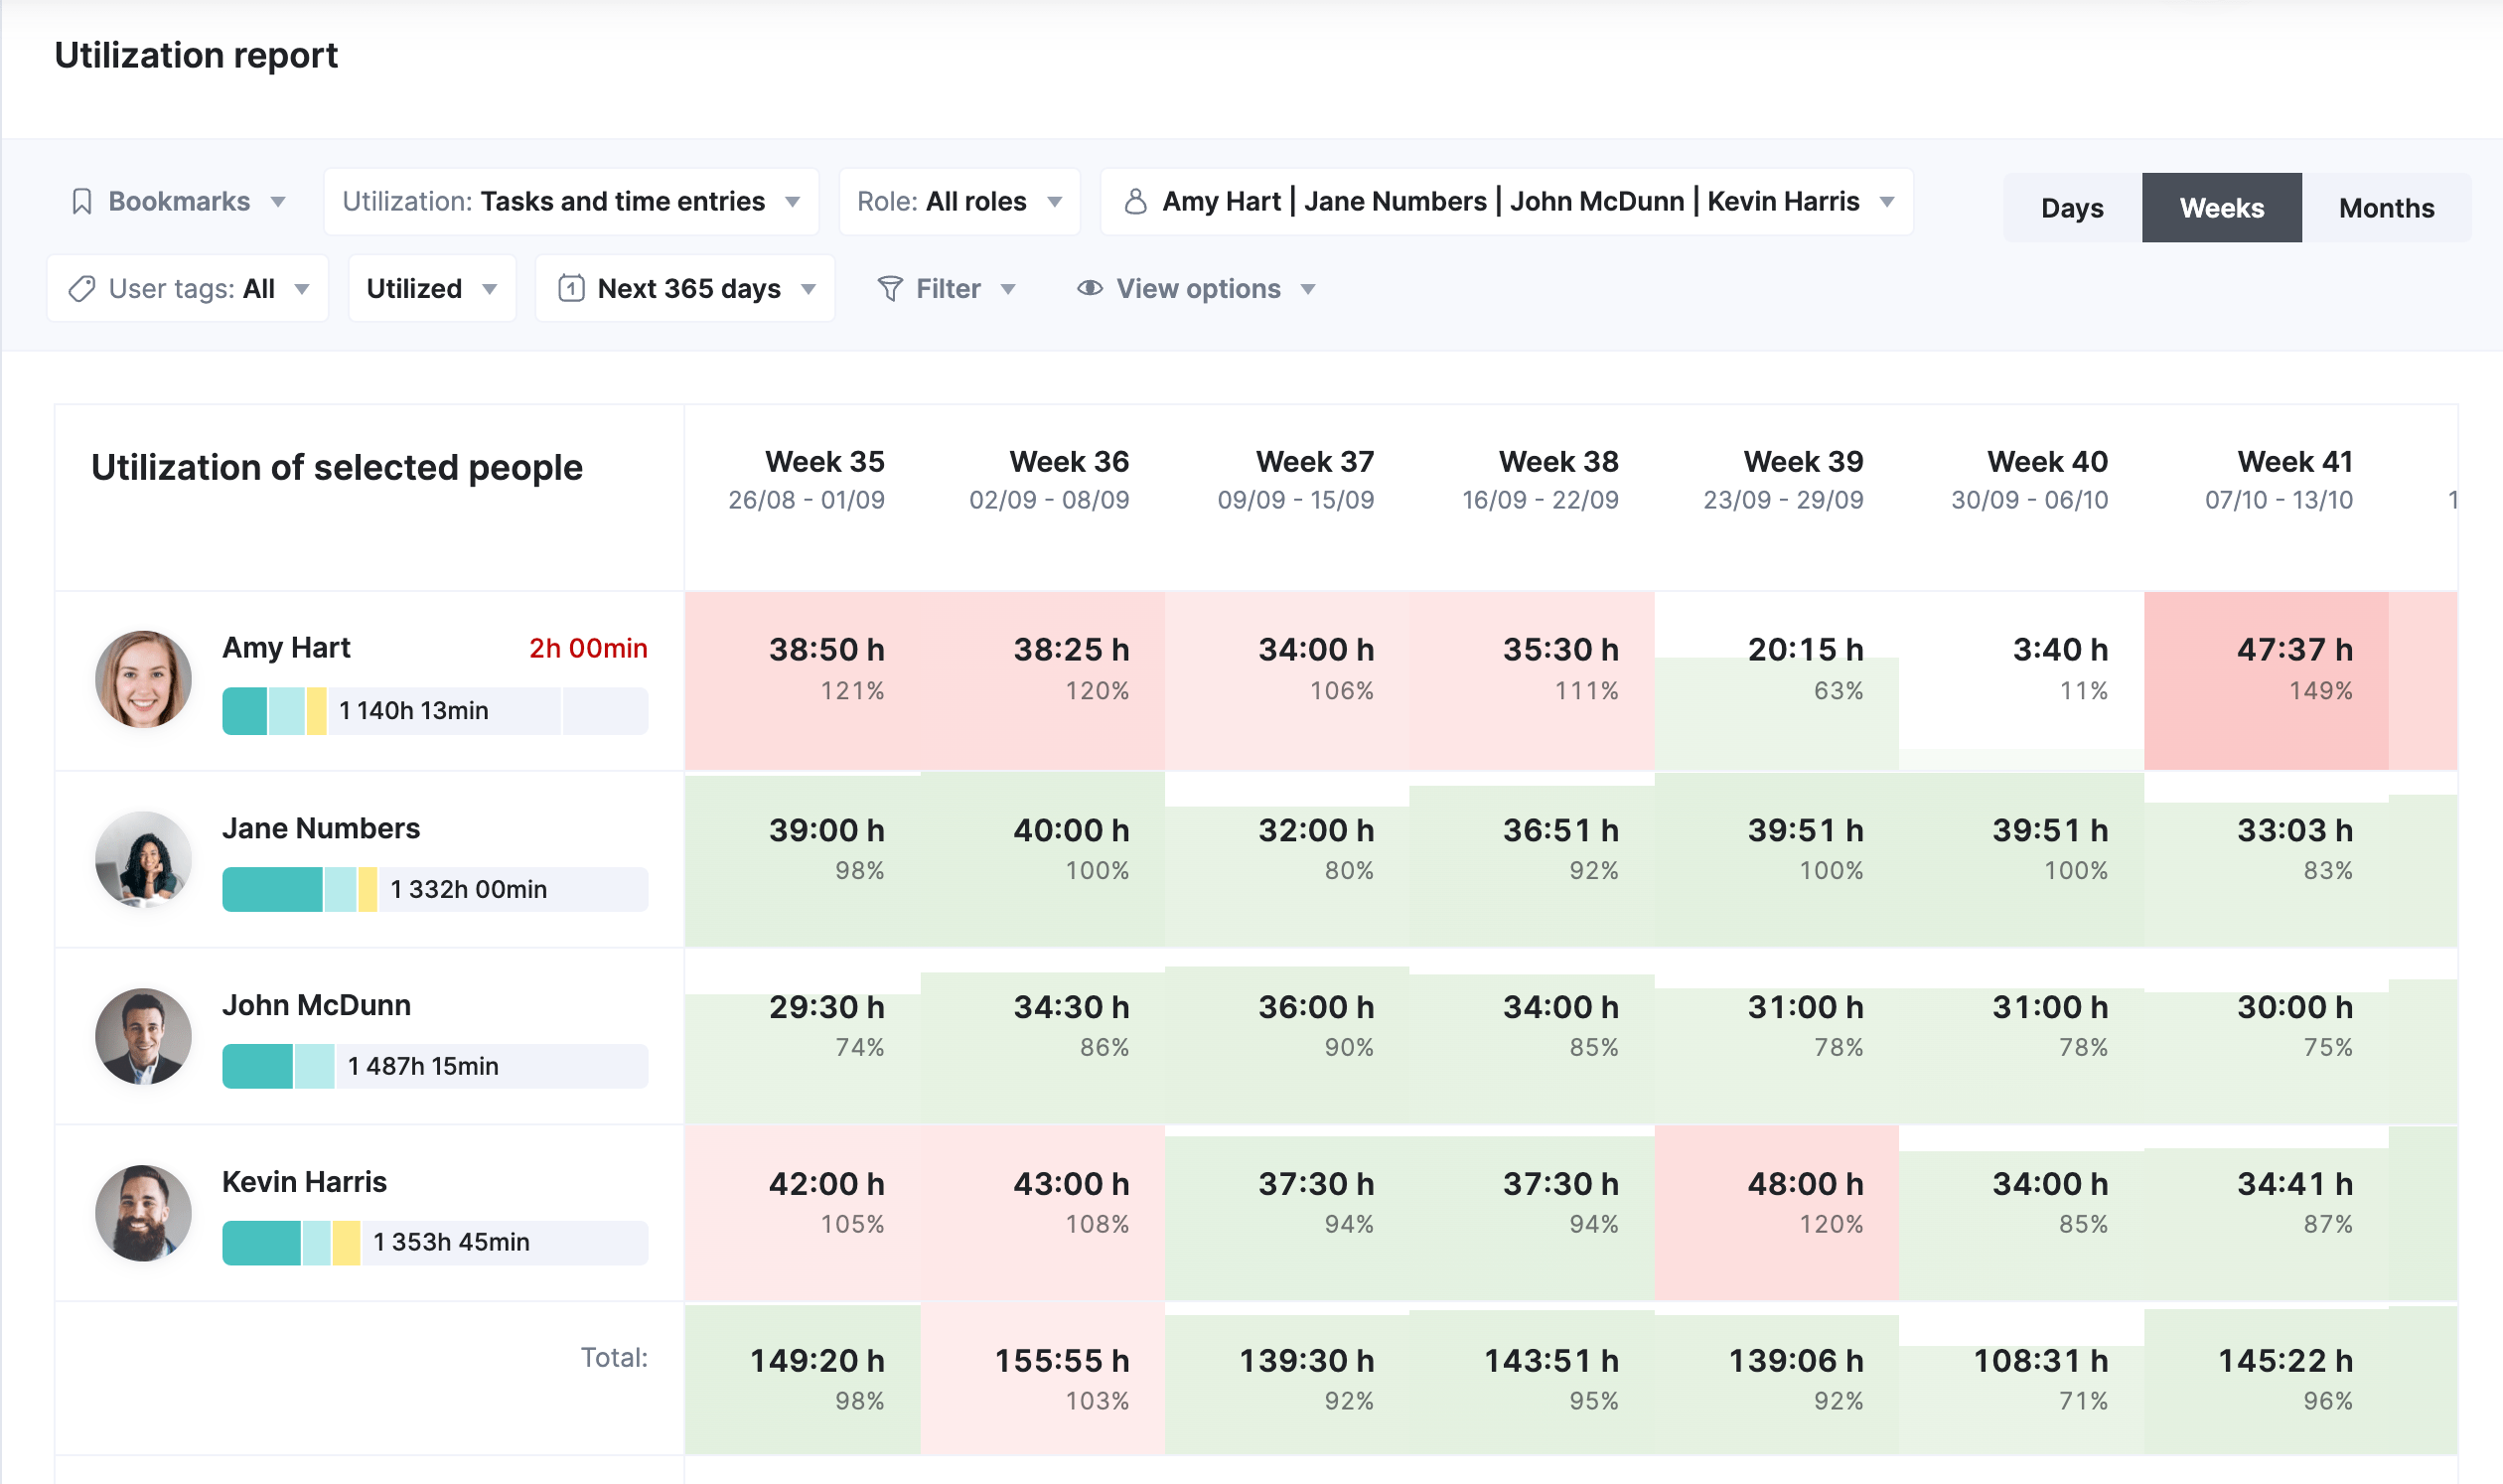
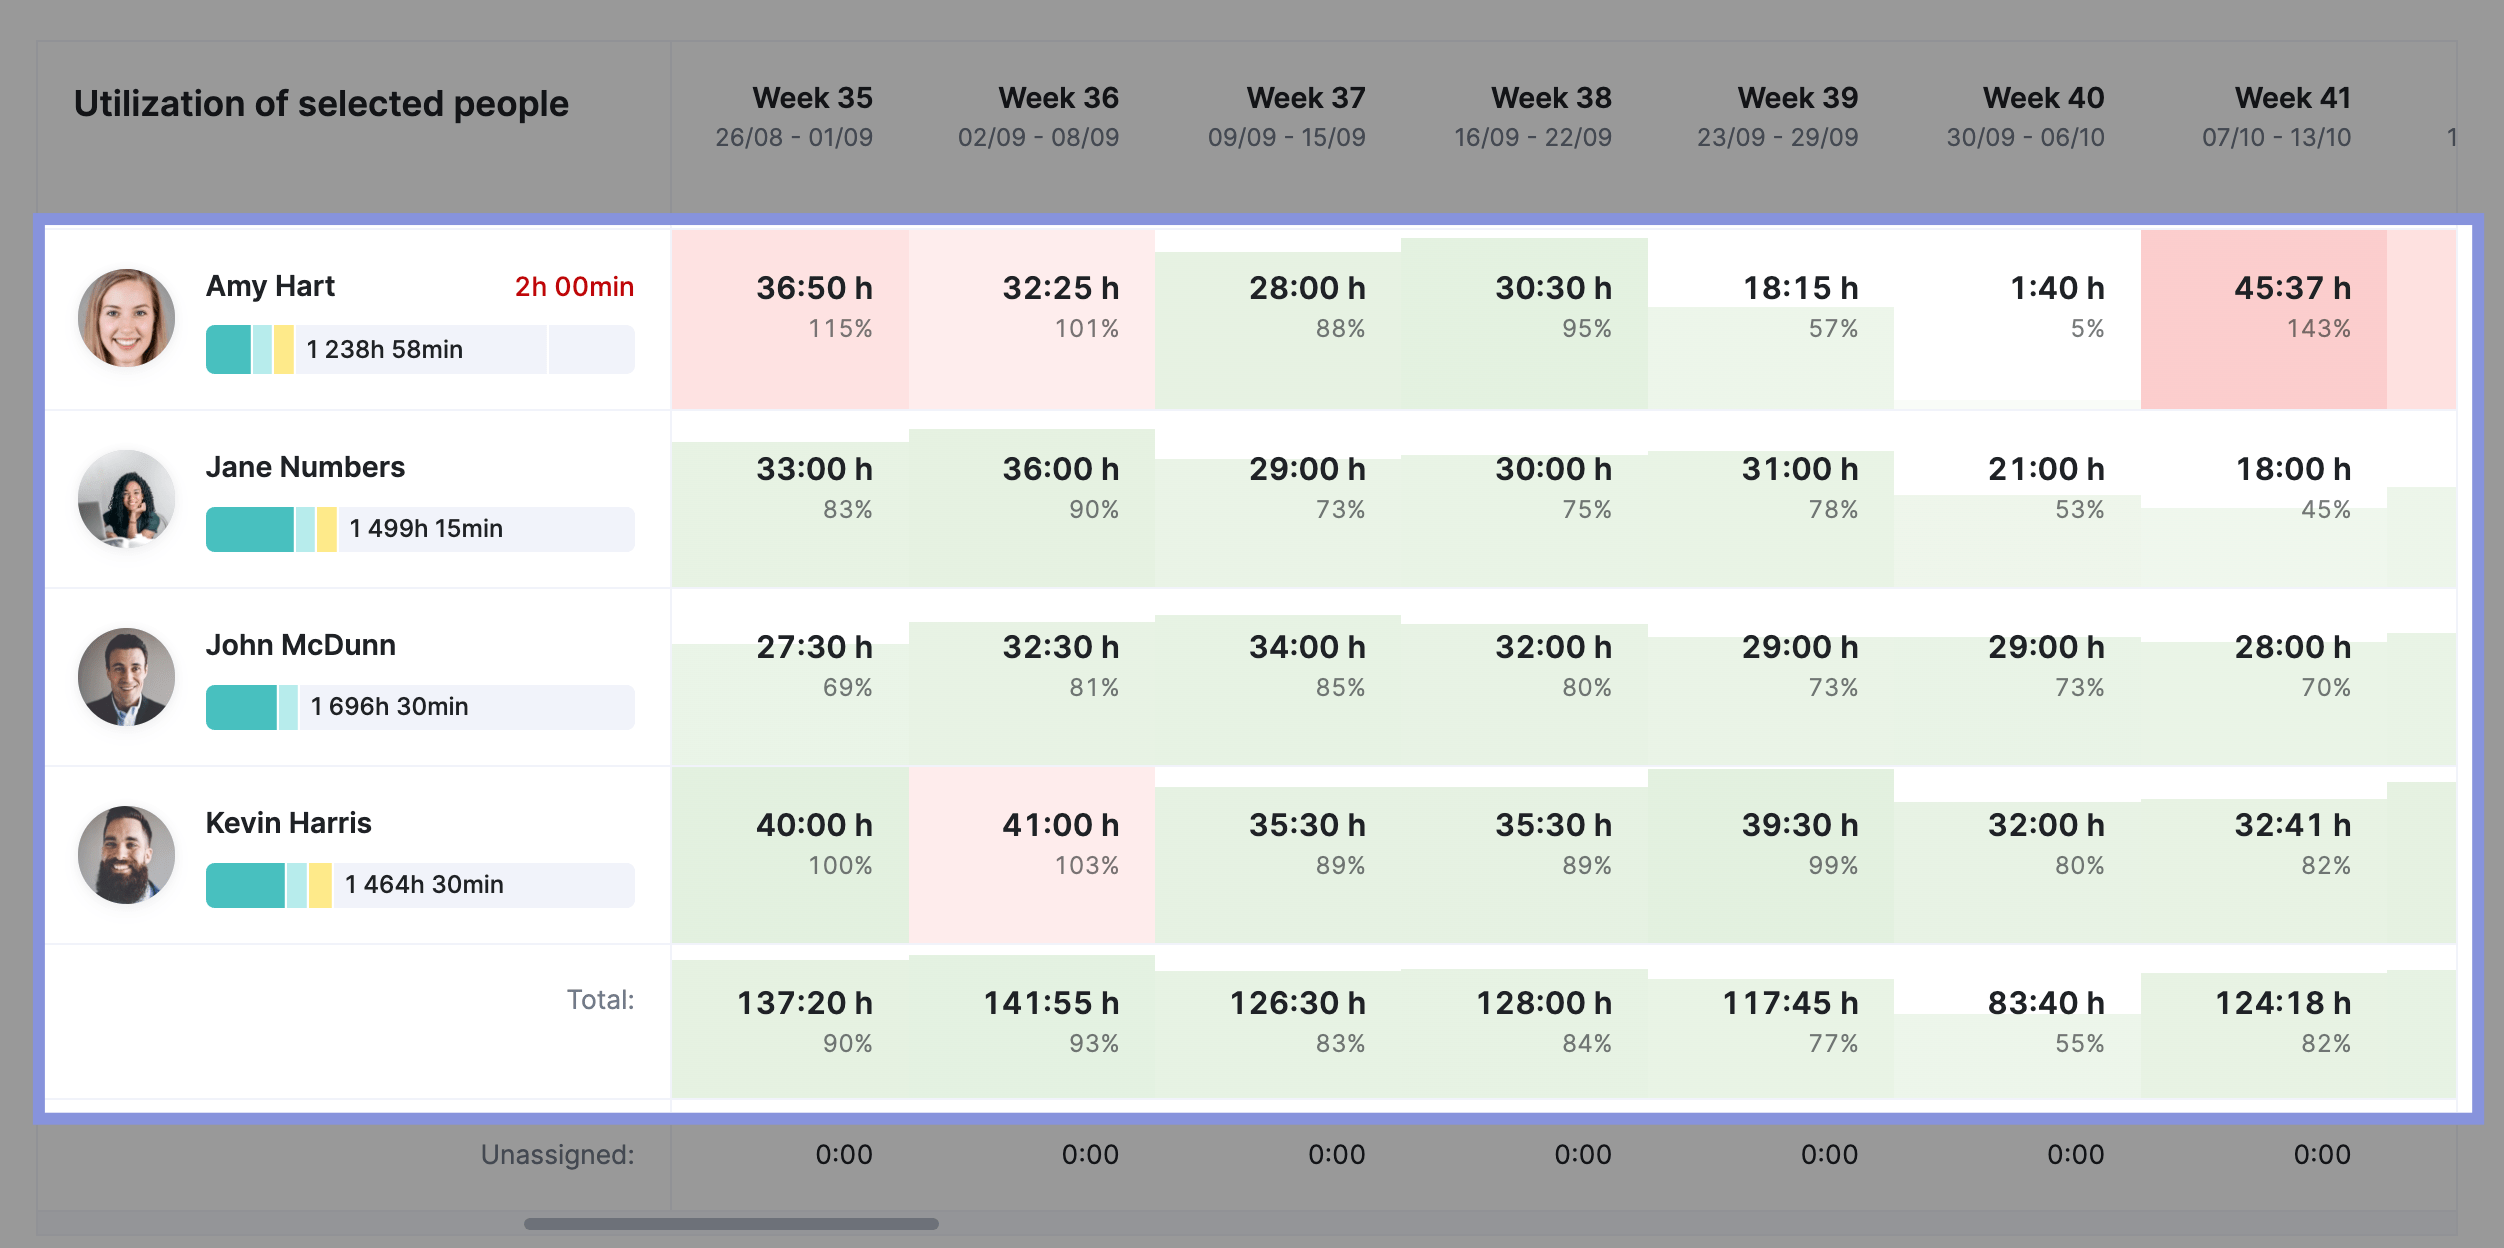
The “Utilization report” uses color-coded indicators to highlight workload levels:
- Green: Indicates a healthy workload, usually around 70-80% capacity
- Yellow: Signals a team member is nearing full capacity and might need attention to avoid burnout
- Red: Indicates overutilization. The team member has more work assigned than their capacity allows, increasing the risk of burnout and potential project delays
The summary column on the left provides a quick view of each person’s utilization percentage, with red text flagging those who are overutilized.
Further reading: Learn more about utilization reports in our guide: Employee Utilization Reports 101: Your Ultimate Guide
Suppose you’re managing a website redesign project. After a week of time tracking, you review the Utilization report and notice:
- Your senior designer’s utilization is at 110%, indicating potential burnout
- A junior developer is only at 60% utilization, suggesting they have the capacity for more work
- The content writer has logged significantly more time on product descriptions than initially estimated
With this data, you can:
- Redistribute some tasks from the overworked designer to the underutilized developer
- Adjust the project timeline to account for the unexpected complexity in writing product descriptions
- Refine future estimates for similar content creation tasks to avoid delays and preserve quality
These actions help prevent team burnout, improve resource use, and keep the project on track—all thanks to accurate time tracking and utilization reporting.
Scoro’s Gantt chart further enhances your ability to monitor all your projects and determine where you might need to get involved.
To access the Gantt chart, select “Projects.” Then, open your project from your list of projects.
Then, navigate to “Tasks” → “Gantt chart.”
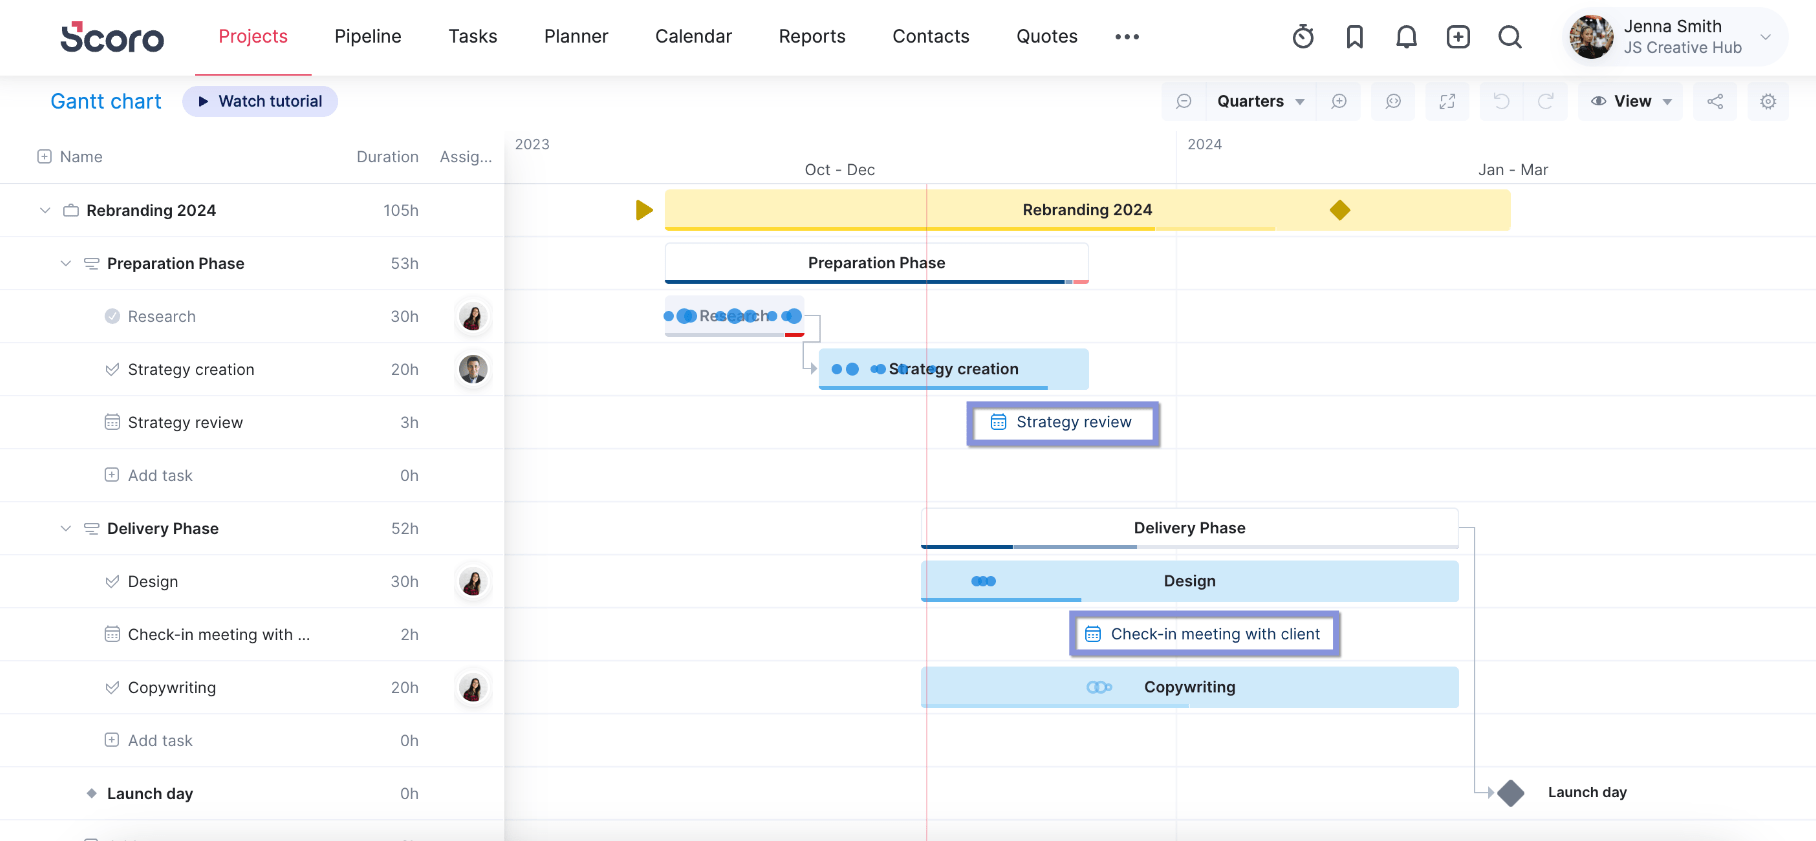
The Gantt chart provides a clear, visual overview of your project, including:
- Project phases (represented as bars)
- Milestones (represented as diamond shapes)
- Individual tasks (represented as bars within phases)
- Task dependencies (shown as lines connecting tasks)
- Scheduled time entries (shown as dots or circles on task bars)
- Calendar events (displayed on the chart)
The red, vertical line represents the current date, letting you see exactly how ahead, on, or behind schedule different tasks are. If any task goes over its initial planned due date, its progress bar will turn red.
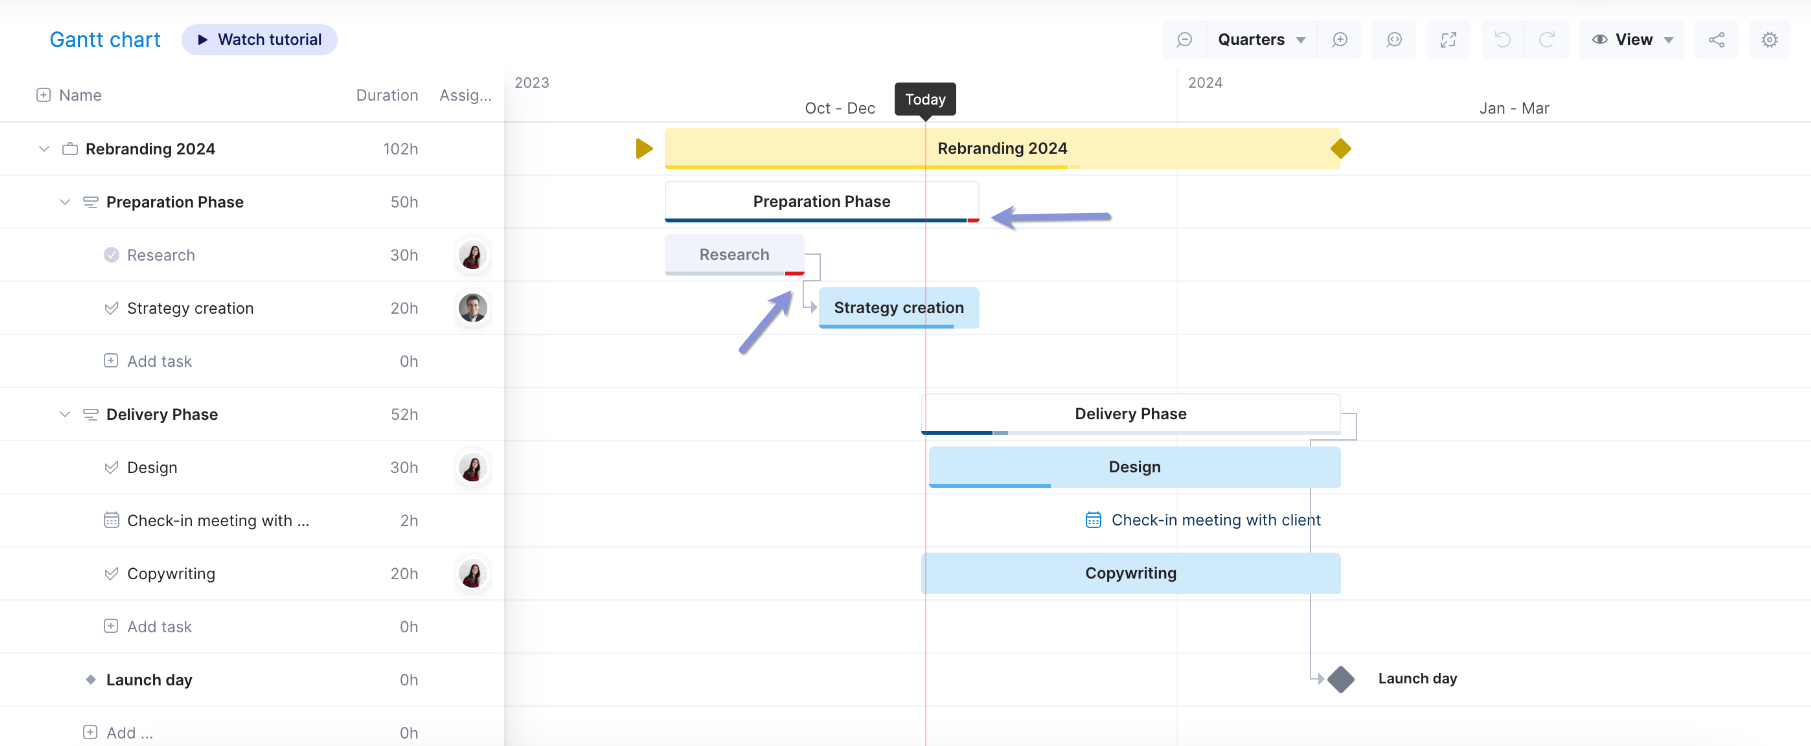
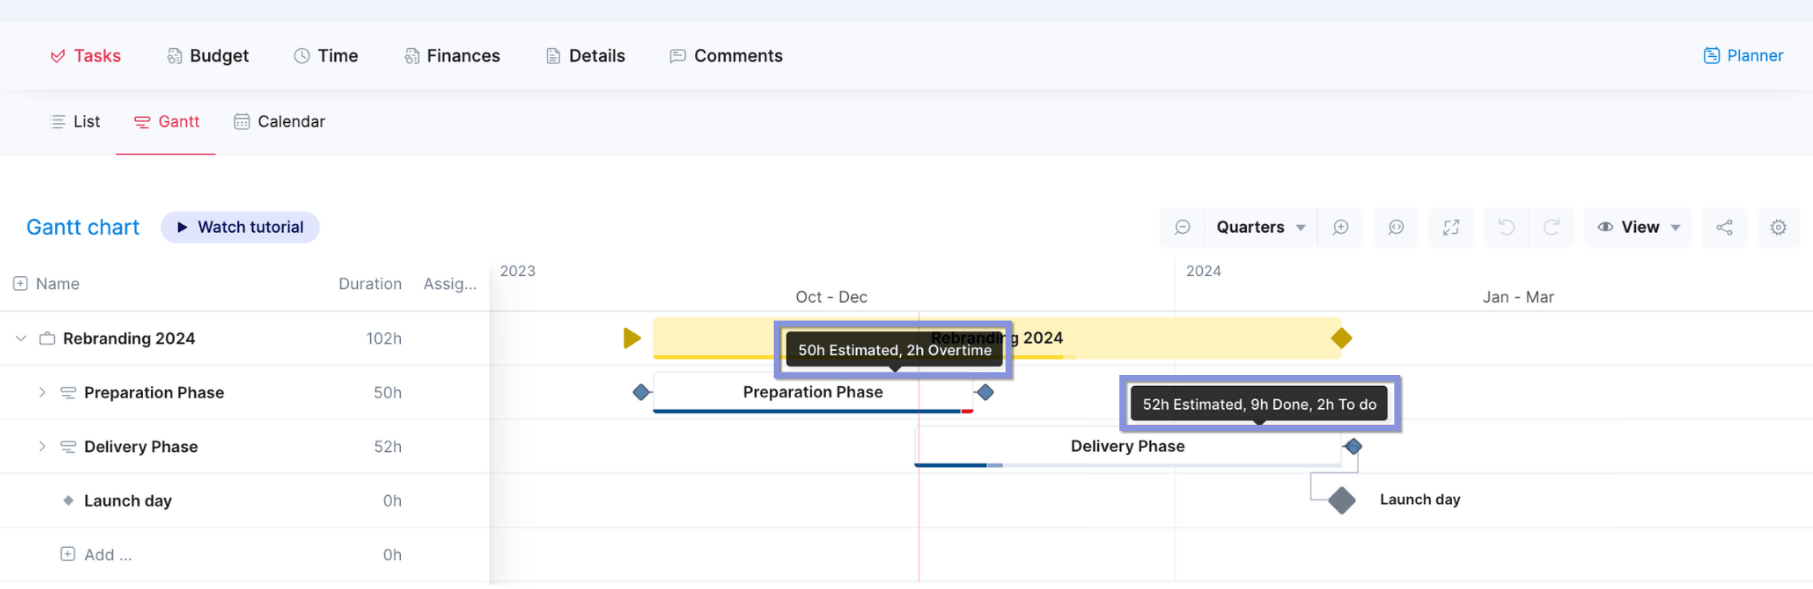
For more details about each task, hover over its name to see what’s:
- Estimated: Planned duration of the task
- Done: All completed time entries
- To-do: Scheduled time entries not yet marked as done
- Overtime: Time entries exceeding the task’s planned duration
- Overscheduled: Uncompleted time entries exceeding planned duration
To adjust task durations or dates, just click and drag the taskbar. From there, Scoro will automatically reschedule dependent tasks and time entries. It also factors in any scheduling conflicts and finds the next available time slot for team members.
Support your team and your projects with accurate resource scheduling
Effective resource scheduling ensures clarity, accountability, and balanced workloads across your team. So, team members can clearly understand their daily responsibilities, avoid missed tasks and deadlines, and deliver high-quality results—all while avoiding burnout and maximizing productivity.
Pair resource scheduling with Scoro’s robust quoting and budgeting tools to improve your project management even further. Gain complete financial oversight, track project costs in real time, and ensure your projects stay profitable from start to finish.
If this sounds familiar, take a closer look at your resource planning.
Effective resource planning can prevent missed deadlines, uneven workloads, and wasted talent—all while boosting your project success rates.
Here’s how to get it right:
What is resource planning?
Resource planning is a proactive, thoughtful approach to project staffing informed by team members’ skills and availability.
It helps maximize team productivity and project success by:
- Aligning team members with projects that match their skills and interests, leading to increased engagement and higher-quality deliverables
- Preventing burnout with balanced workloads
- Reducing resource conflicts and related project delays
Capacity planning vs resource planning vs resource scheduling
Capacity planning, resource planning, and resource scheduling are all related steps in managing resources. But they all serve distinct purposes:
- Capacity planning: A high-level assessment of your organization’s ability to take on new projects, typically looking three to 12 months ahead. It involves analyzing your team’s current and future bandwidth against the potential workload.
- Resource planning: A mid-level look at your team that involves deciding who should work on which projects—and why.
- Resource scheduling: A detailed look at the project scope and deliverables, where you assign team members to tasks with deadlines.
Benefits of effective resource planning
Strong resource planning means using your team’s skills, career goals, and available time to support your projects and bottom line best.
Here’s how:
- Optimized project teams: Resource planning helps you build all-star teams with the right blend of current skills and growth potential.
- Balanced workloads: No one likes being overloaded with work. And no project benefits from underutilized team members. By intentionally distributing work more evenly, you can prevent burnout while supporting productivity.
- Greater transparency: When team members can see who’s working on what and when, it reduces miscommunications, redundant work, and delays. For instance, the designer can easily track when the copywriter will complete their ad copy. And both developers know which parts of code they’re responsible for—no duplicate efforts here.
- More on-time deliveries: Overbookings and resource conflicts are notorious for causing project delays. By reviewing everyone’s schedules and workloads well before kickoffs, you can avoid them—and resulting missed deadlines.
- Increased team morale and productivity: When team members have manageable workloads and aren’t being shuffled around unexpectedly, they’re less likely to feel frustrated or distracted at work. Which translates to better deliverables and happier employees.
How to implement effective resource planning
While it may take some time to master, the return on investment of resource planning is massive. As you practice and refine your planning process, you’ll reduce overtime costs, meet project milestones more consistently, and increase project profitability.
Following a structured system like ours reduces understaffing, overbooking, and missed deadlines, improving your on-time delivery rate and client satisfaction.
1. Outline the project’s estimated scope
Start with a clear Work Breakdown Structure (WBS) to divide your project into phases, deliverables, and tasks.
Like this:

After creating your WBS, consider turning it into a Gantt chart. This project timeline view helps you quickly see task dependencies and project milestones.
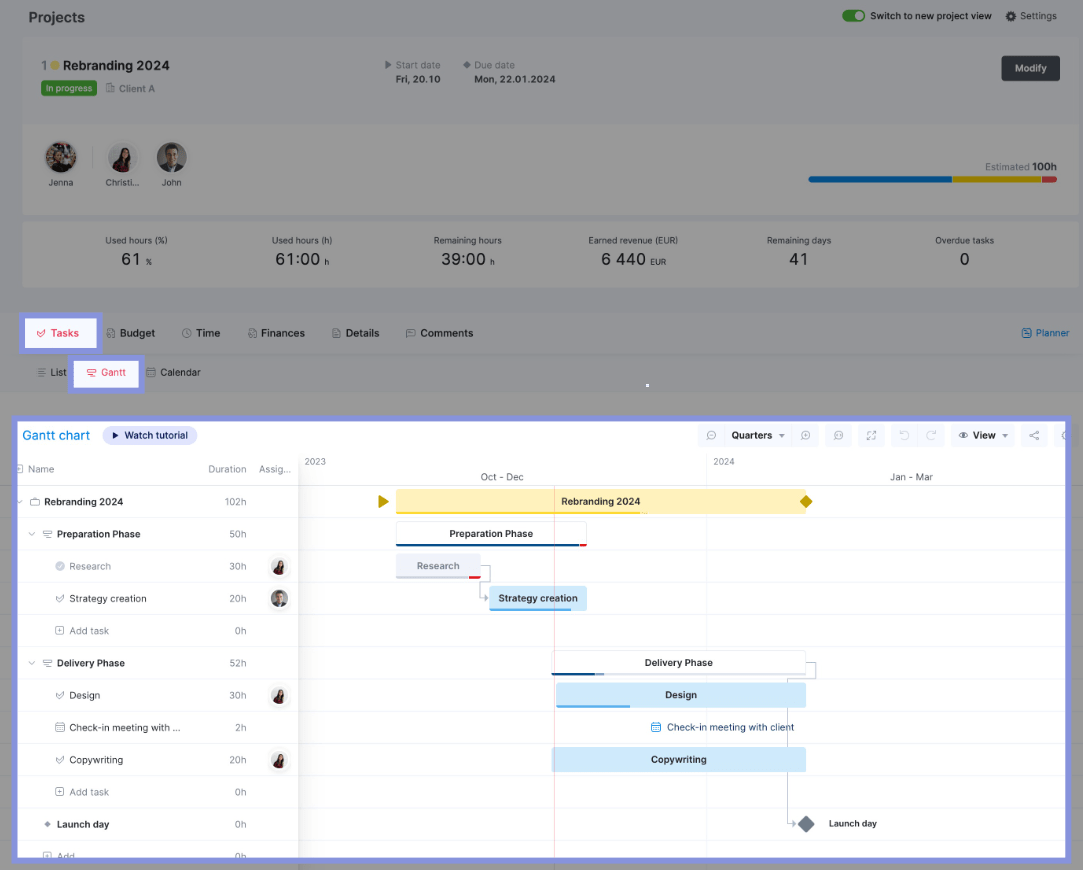
For example, here’s what a project timeline might look like for a rebranding project in Scoro:
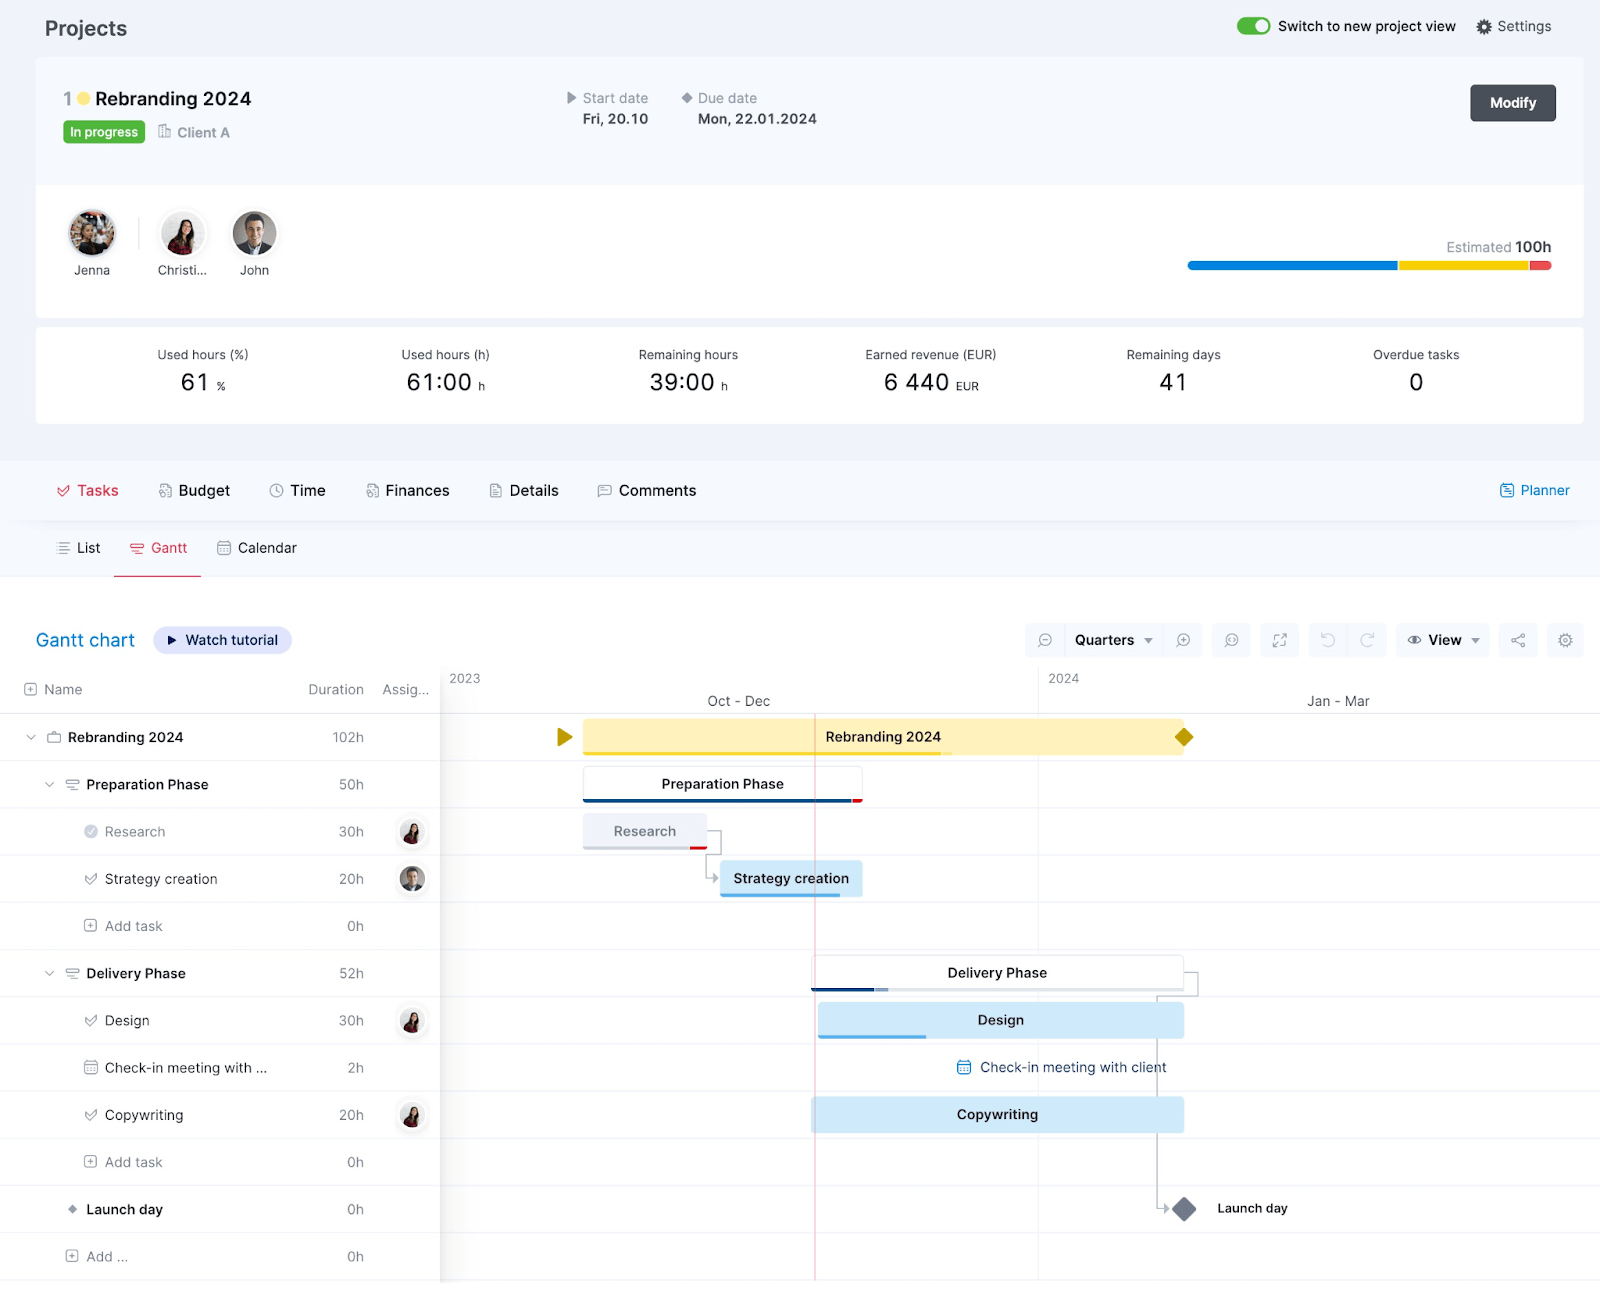
Next, identify which specific roles (e.g., designers, developers, writers) will handle different components.
Then, estimate how long it will take each person to complete their part of the project successfully. Remember to factor in billable and non-billable hours to create a realistic timeframe.
To demonstrate how this works in practice, let’s revisit our rebranding project example:
Preparation phase (50 hours):
- Research: (Marketing Analyst: 30 hours billable)
- Competitor analysis
- Target audience research
- Trend analysis
- Strategy Creation: (Marketing Manager: 20 hours billable)
- Branding guidelines development
- Messaging framework
- Marketing channel selection
Delivery phase (52 hours):
- Design: (Graphic Designer: 30 hours billable)
- Logo design
- Visual assets creation
- Marketing collateral design
- Check-in meeting with client: (Project Manager: 2 hours billable)
- Review designs and strategy
- Gather feedback and approvals
- Copywriting: (Content Writer: 20 hours billable)
- Website copy
- Social media content
- Ad copy
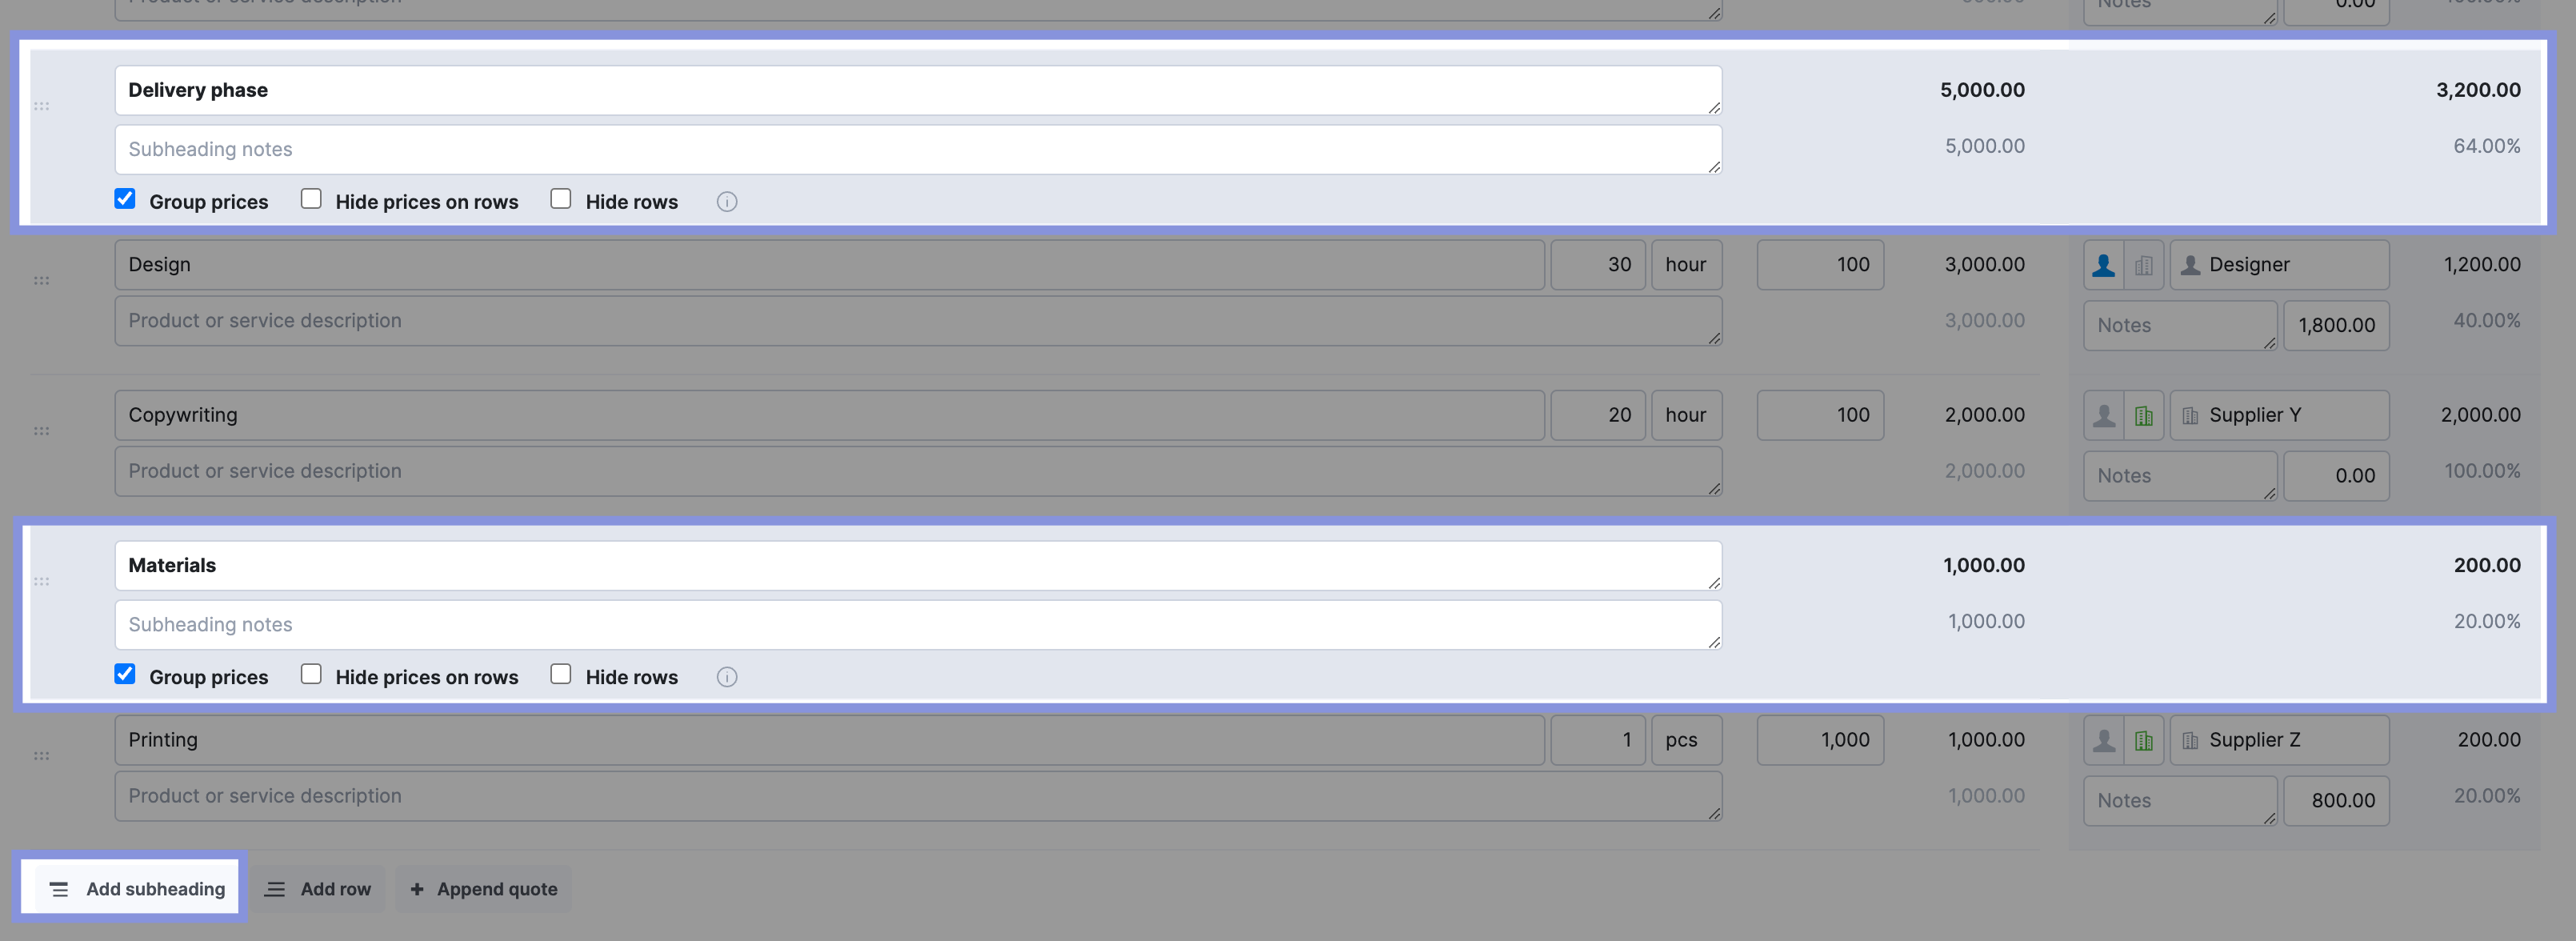
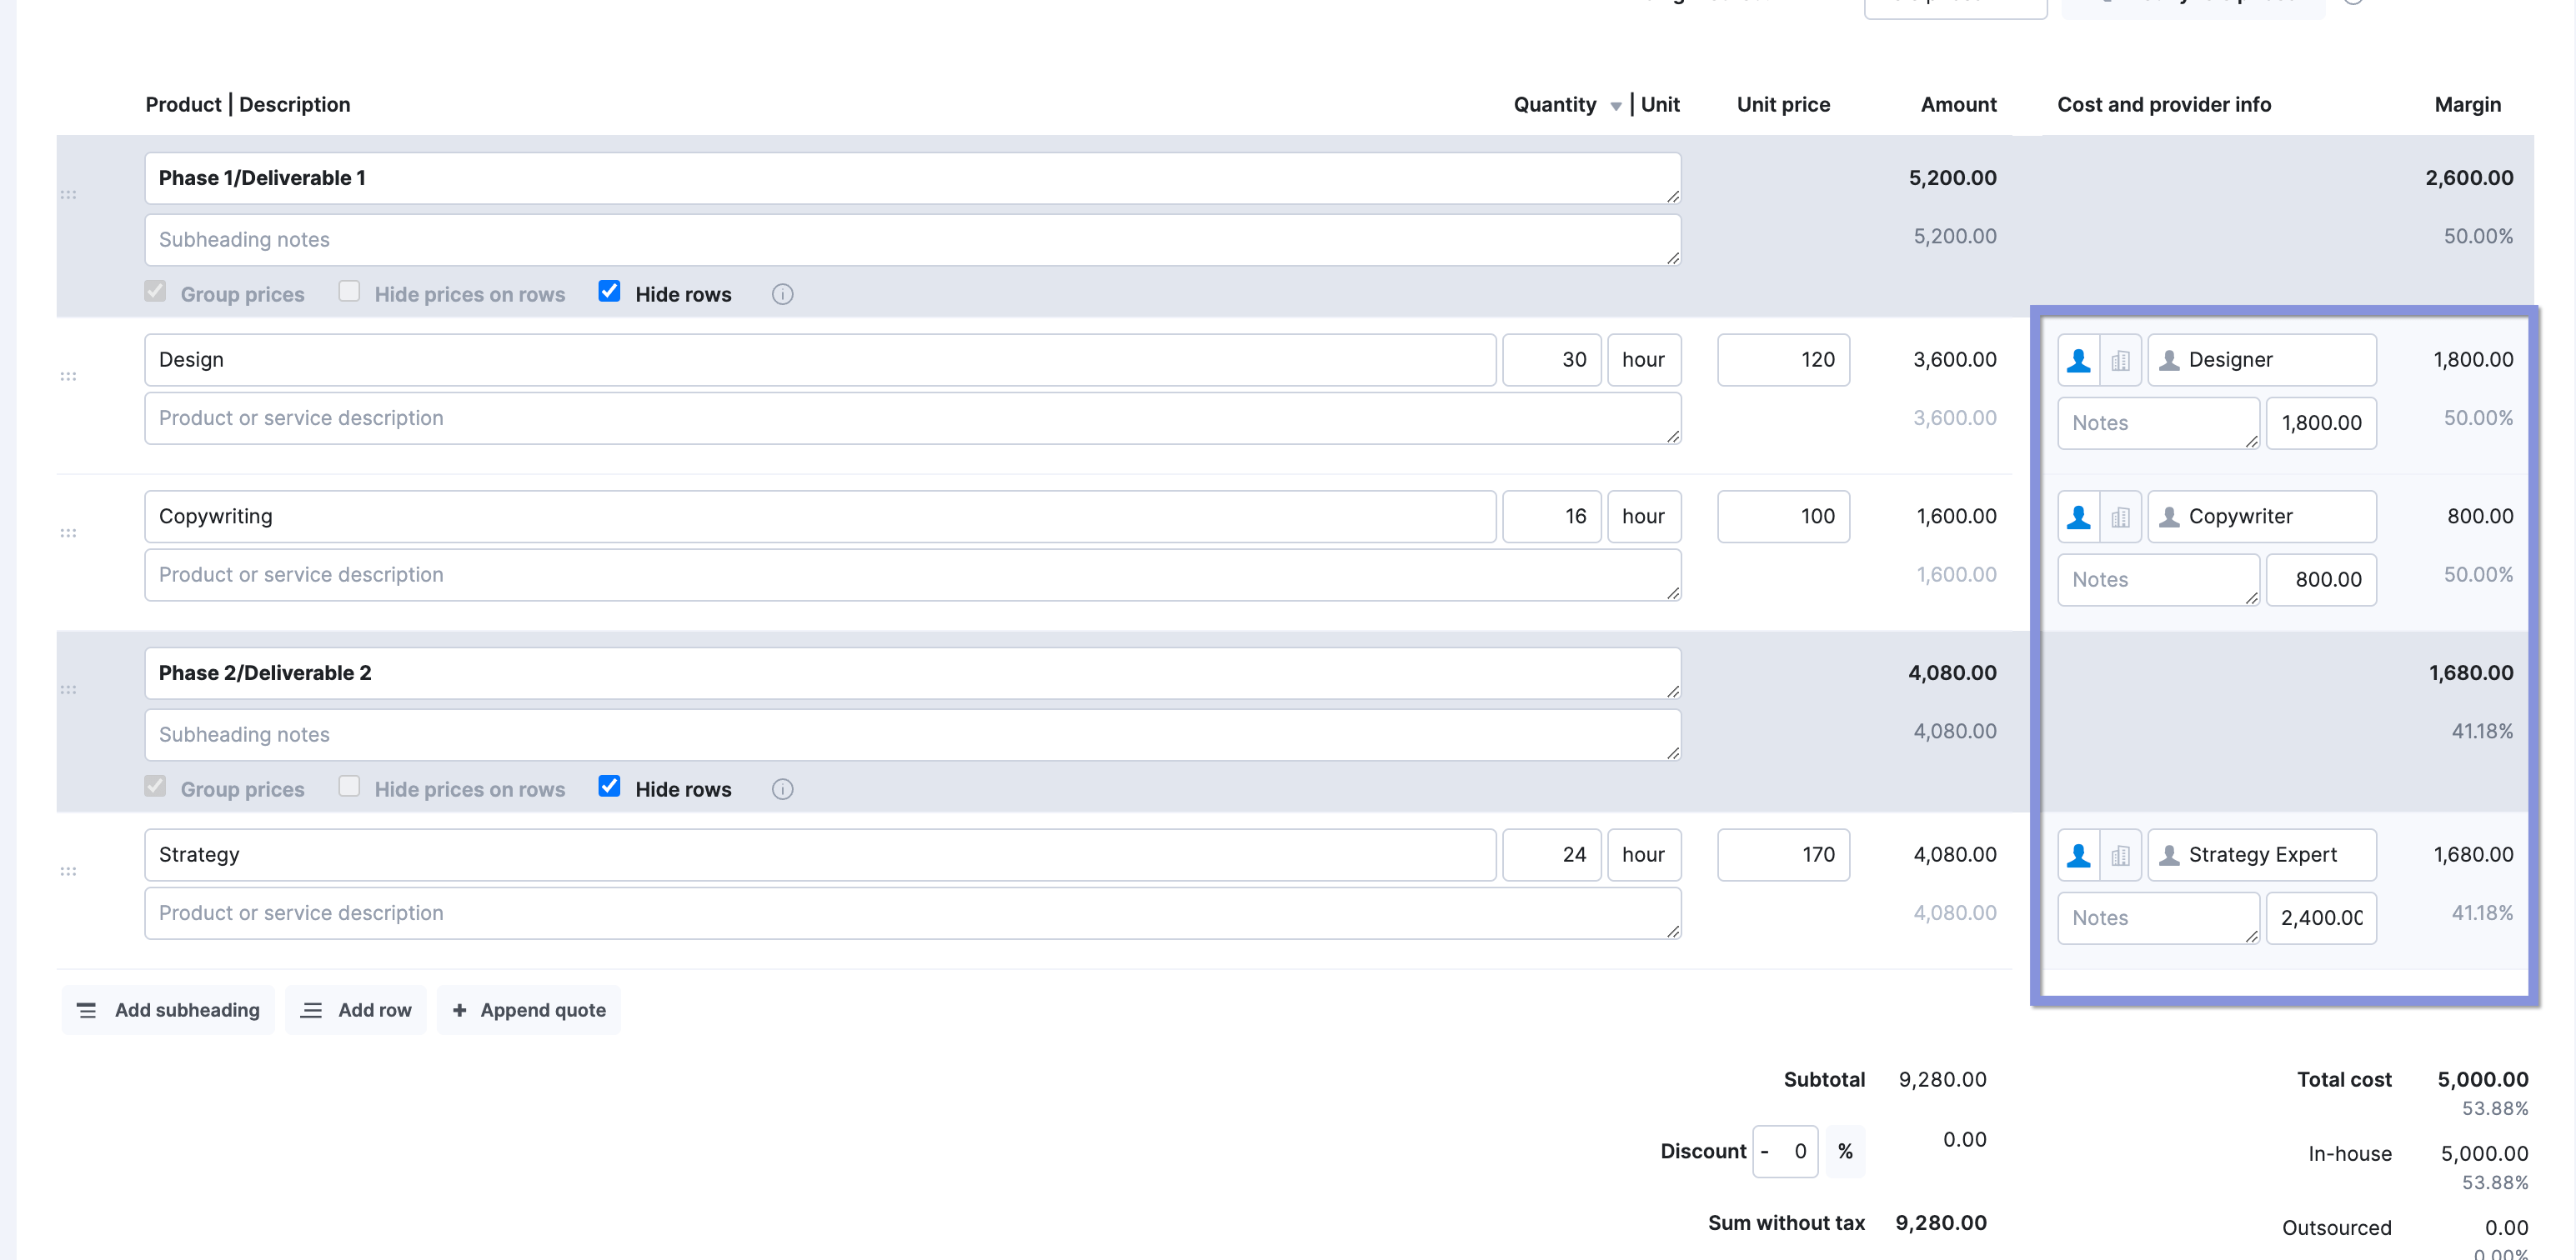
Resource management software like Scoro makes it easy to define your project’s key parts and roles with its quote builder.
As you itemize services and estimate hours in the quote, you outline your project structure and resource needs.
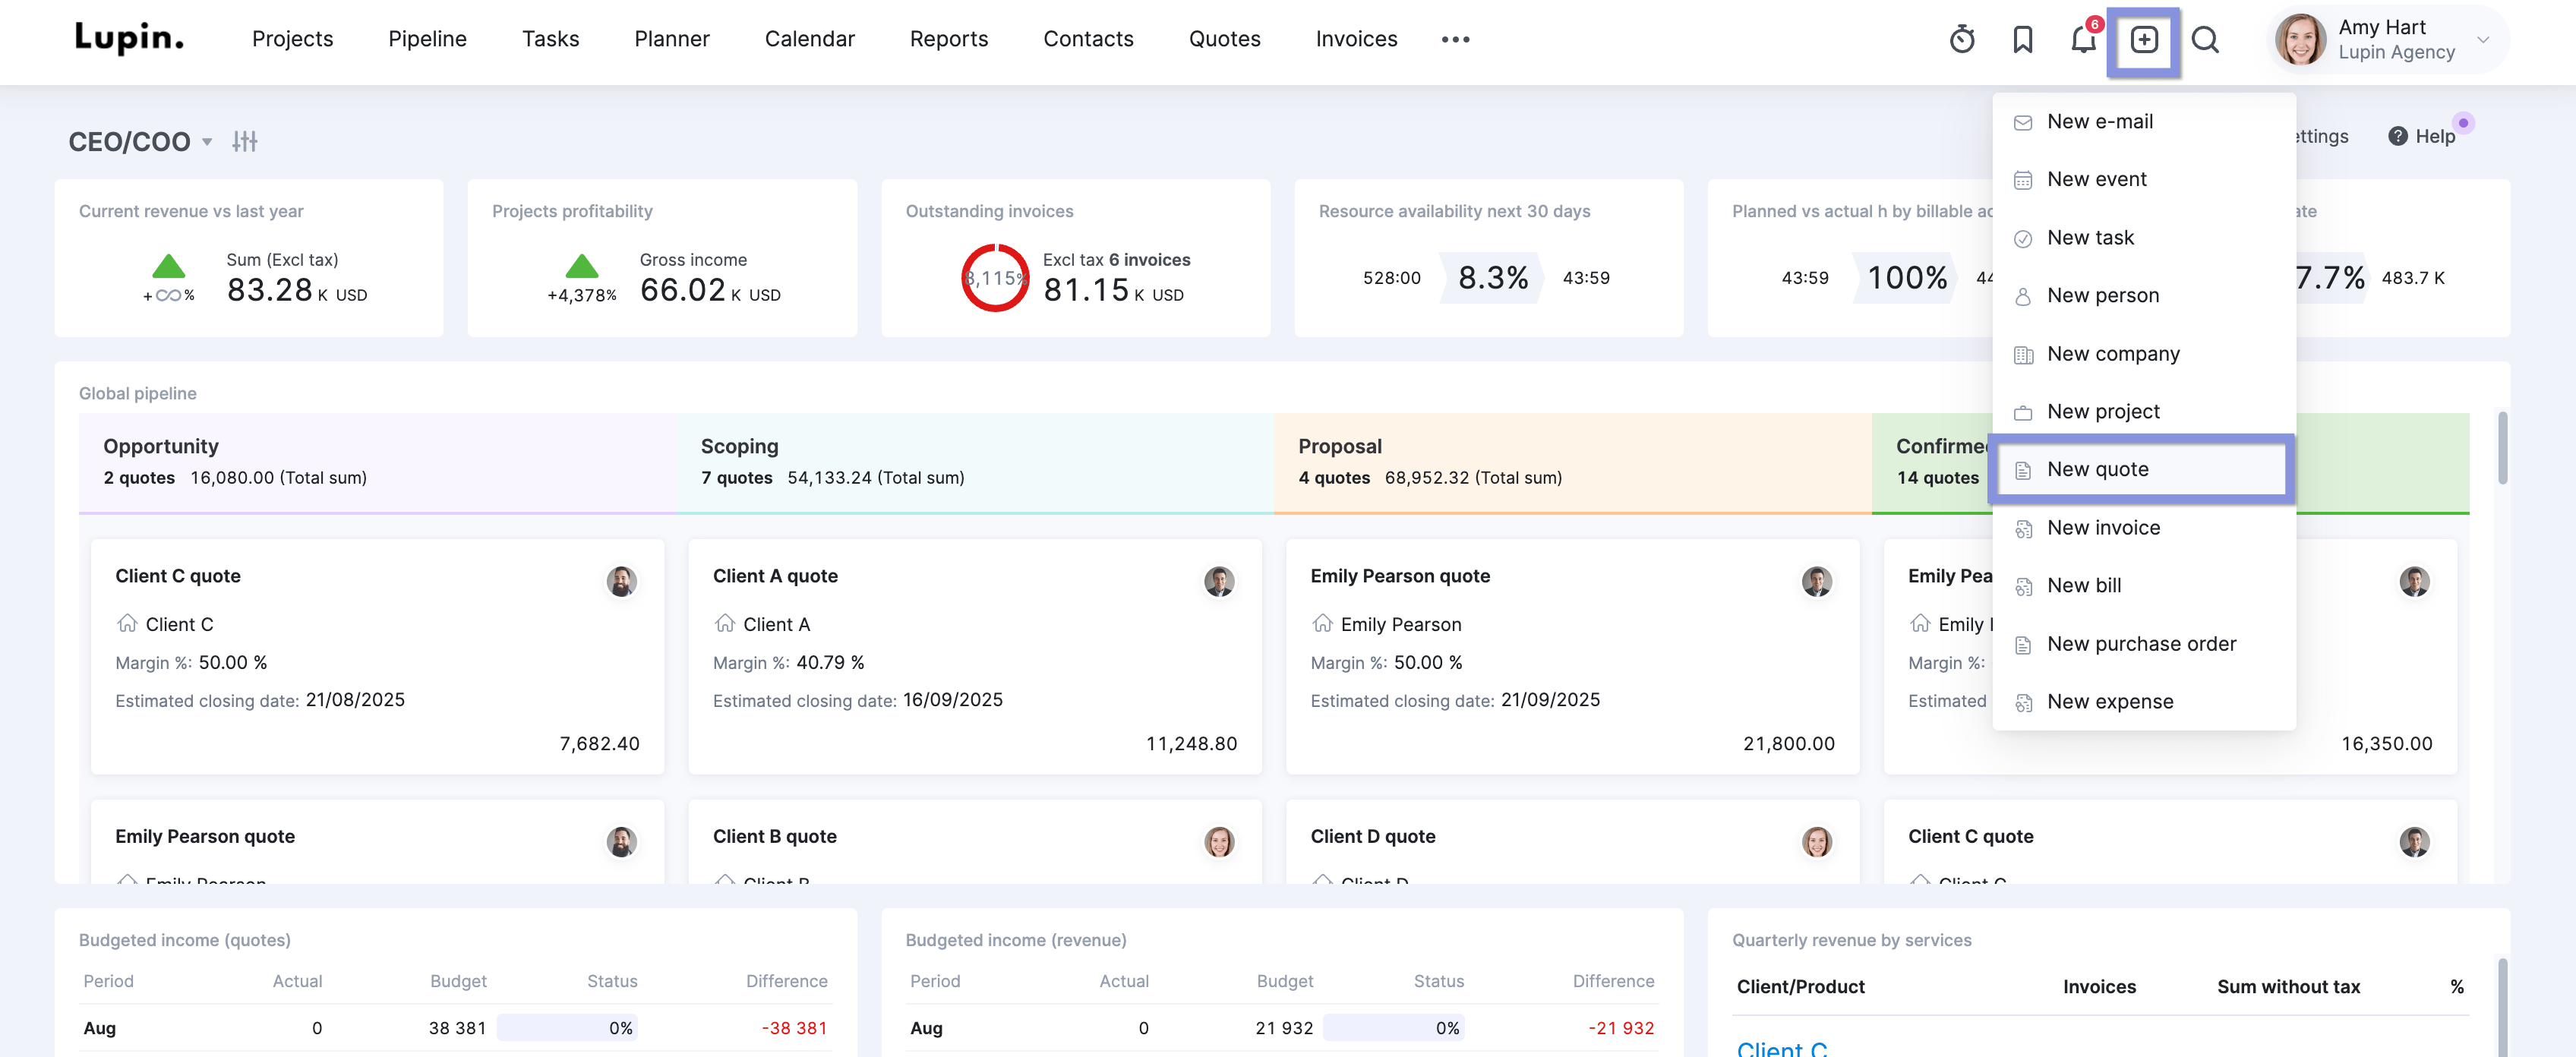
Create a new quote from any view using the quick actions menu.
Then, add deliverables to the left side of the screen—click preset services from your product database or enter new ones as needed.
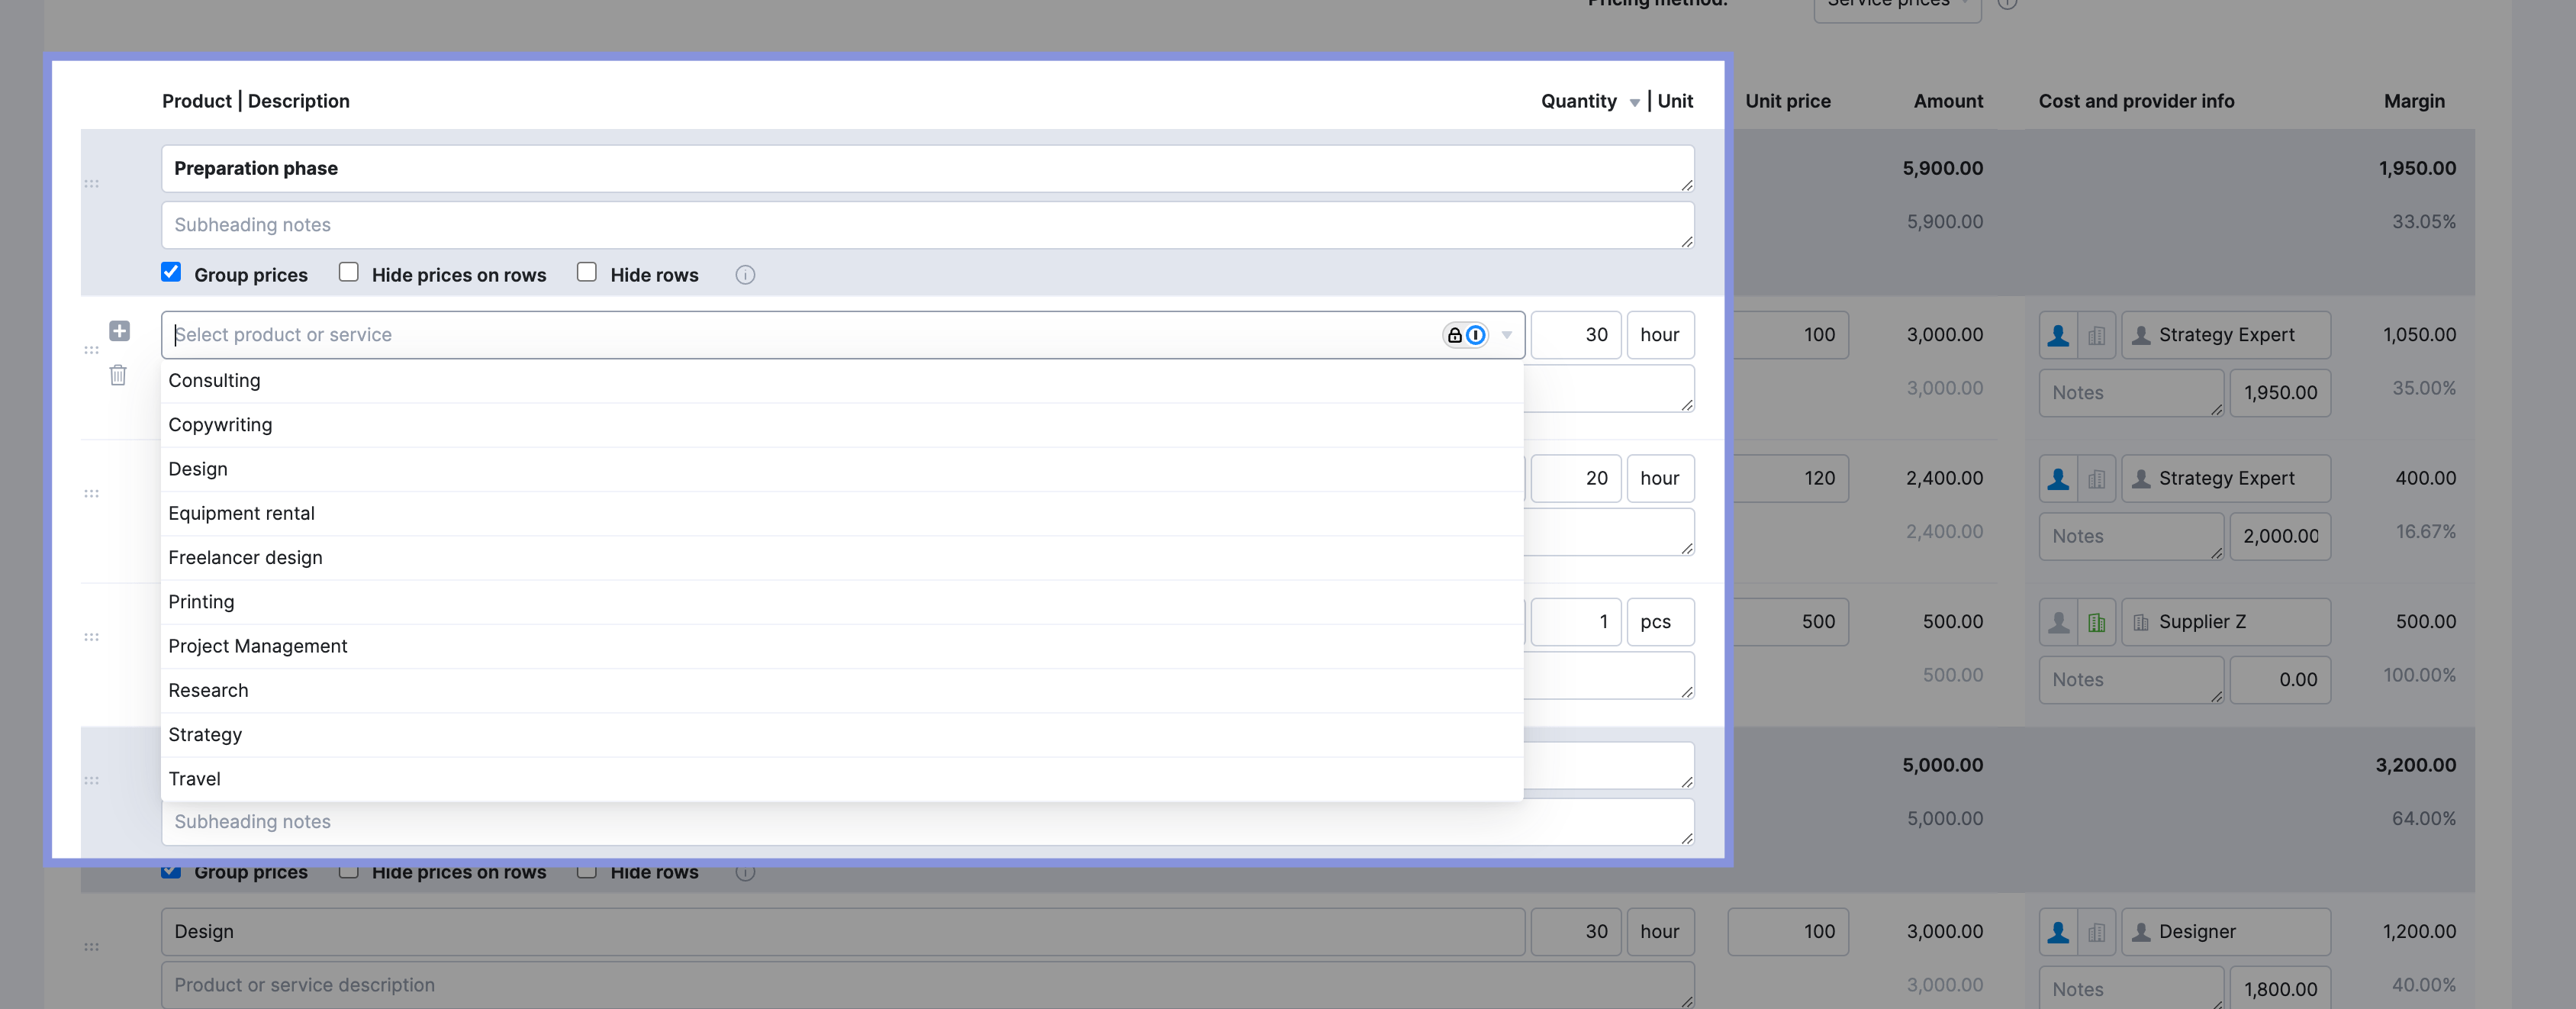
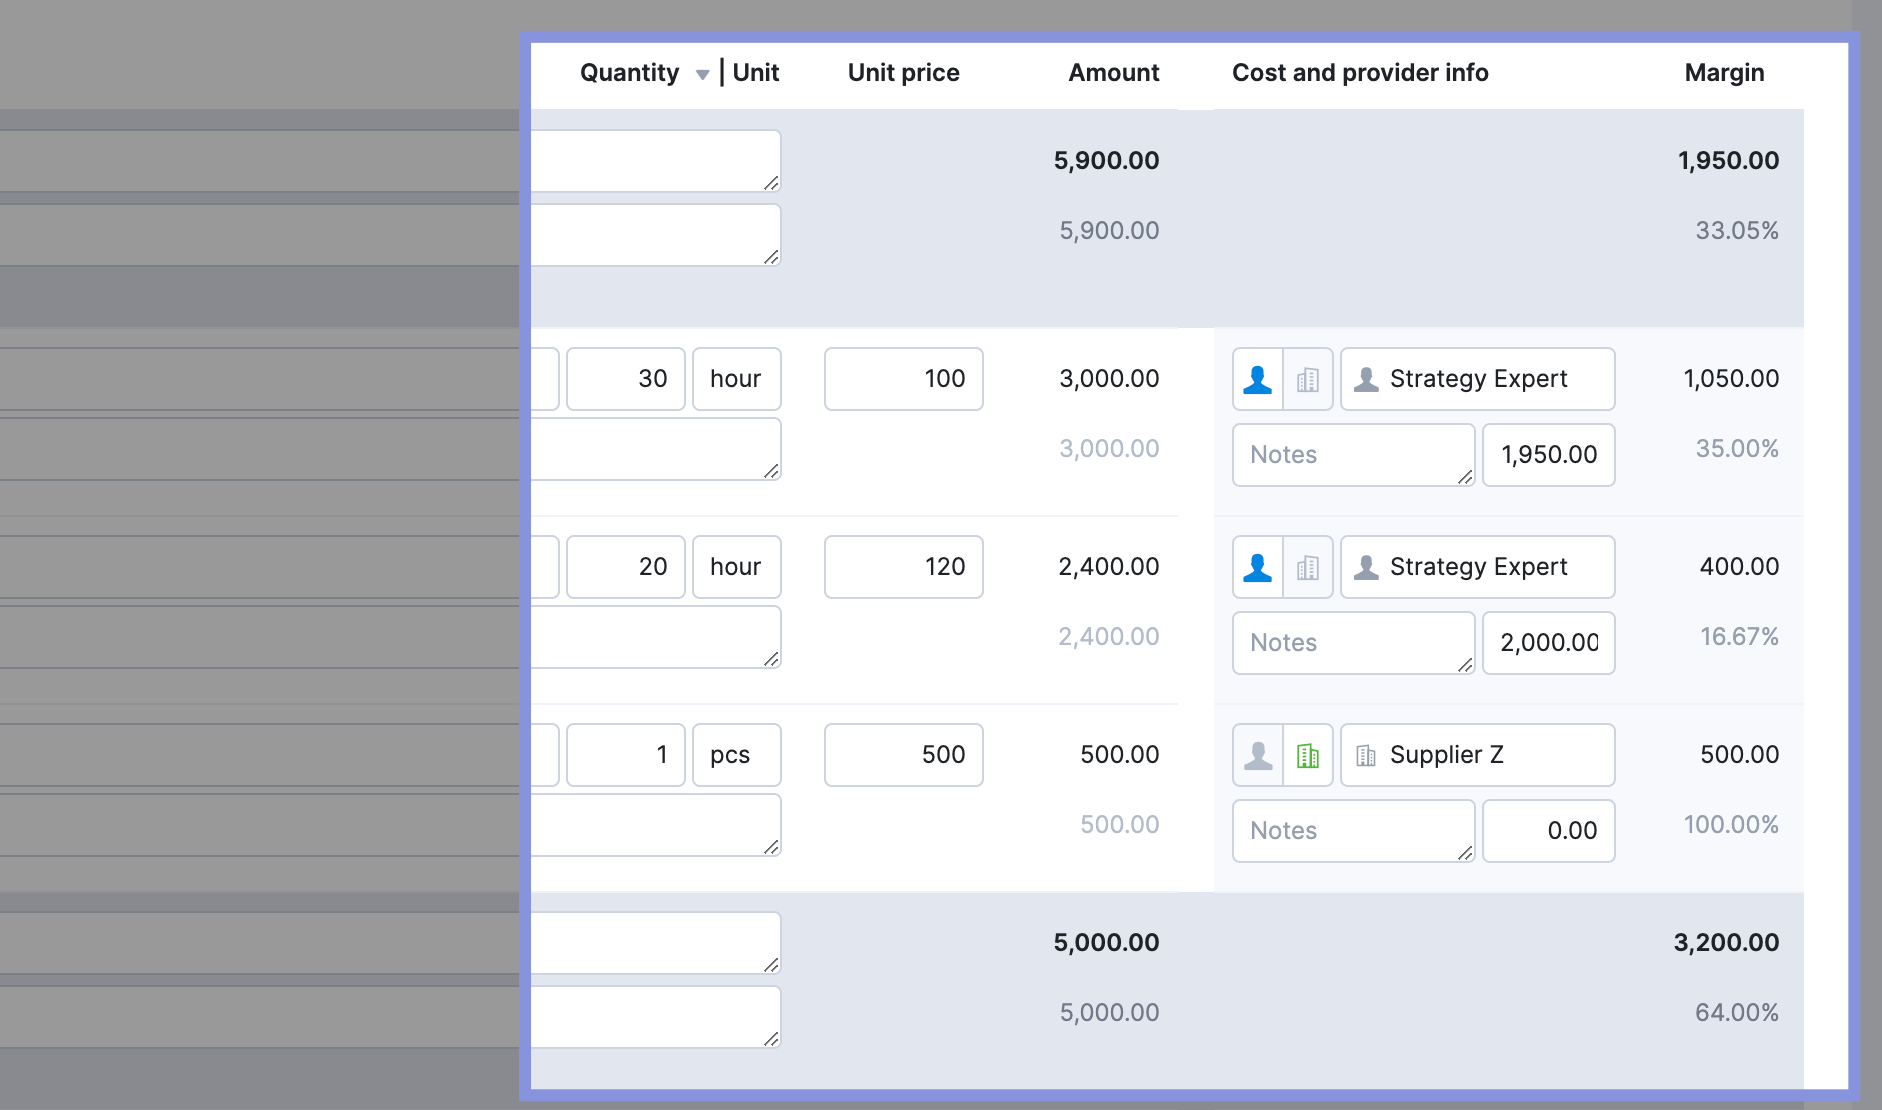
Next, on the right, enter your internal costs and set margin targets in the “Cost and provider info” and “Margin” columns.
Then, click “Add Subheading” to structure your quote into project phases.
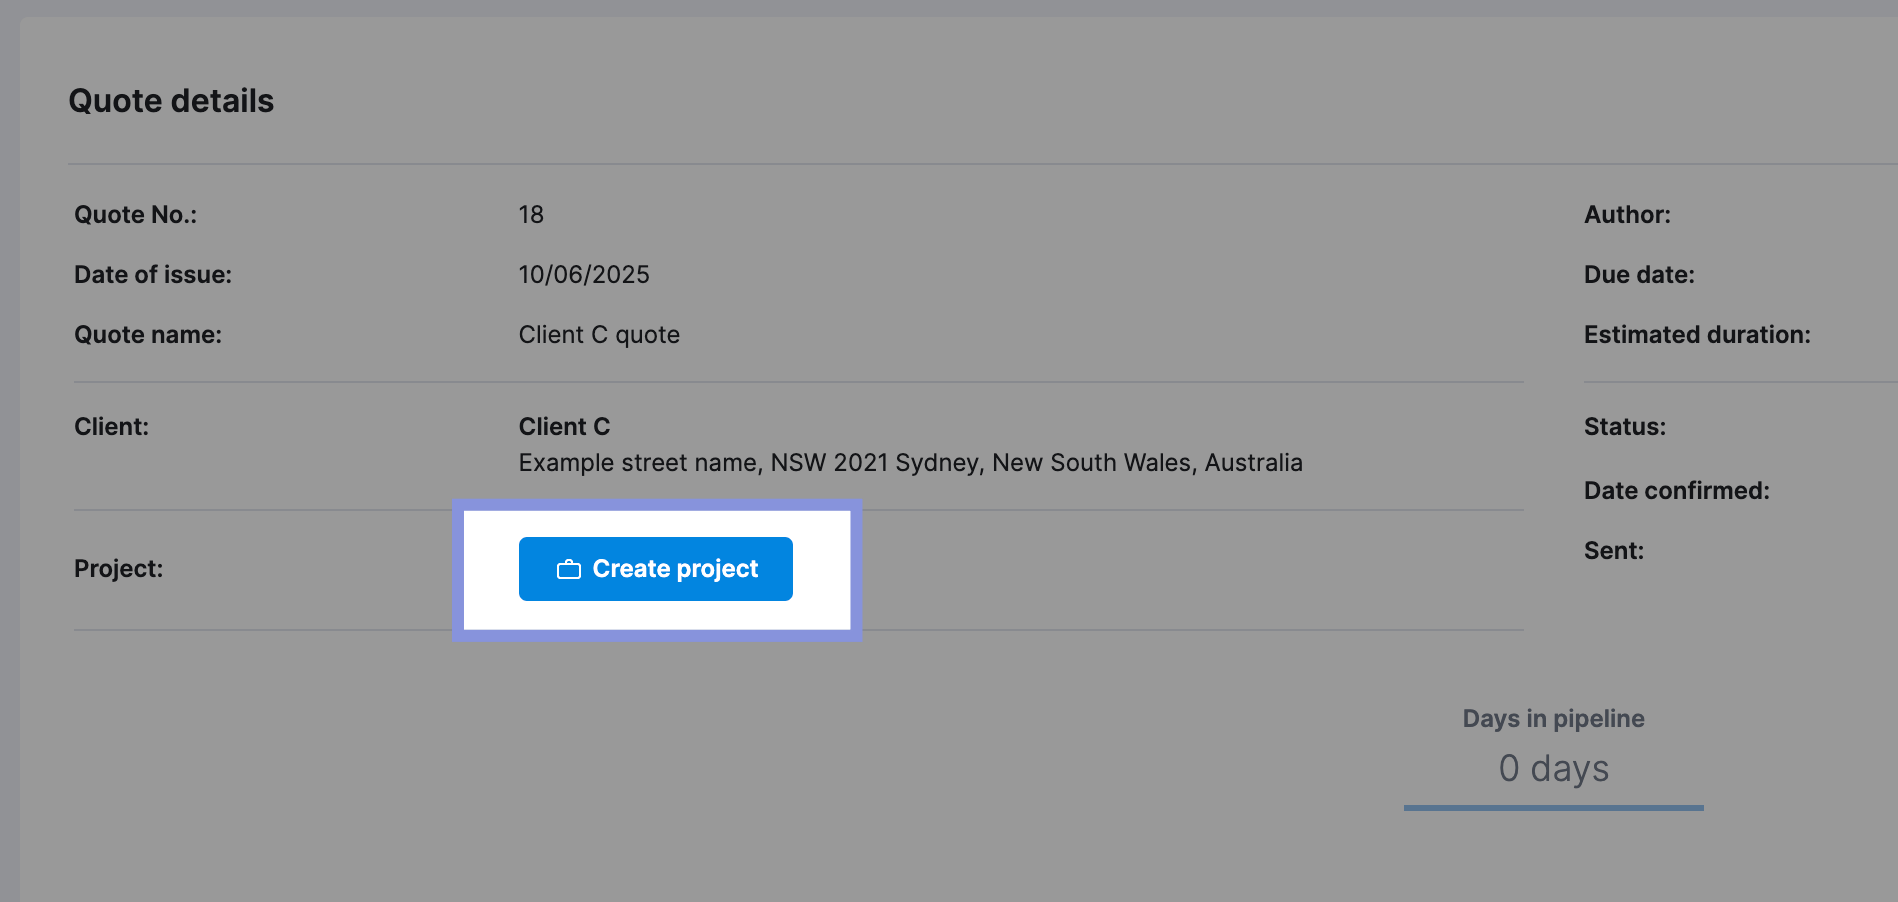
Once your quote is finalized, click “Save” and then click “Create project.”
After creating the project, if you need to adjust any project details or workload, go to the “Projects” tab. Click on any project to modify the new project’s parameters, timelines, or resource requirements.
Further Reading: Project Cost Estimation: A Guide to Quoting Profitable Projects
2. Assess your team’s availability and existing workloads
Once you’ve outlined your project, determine who should work on it.
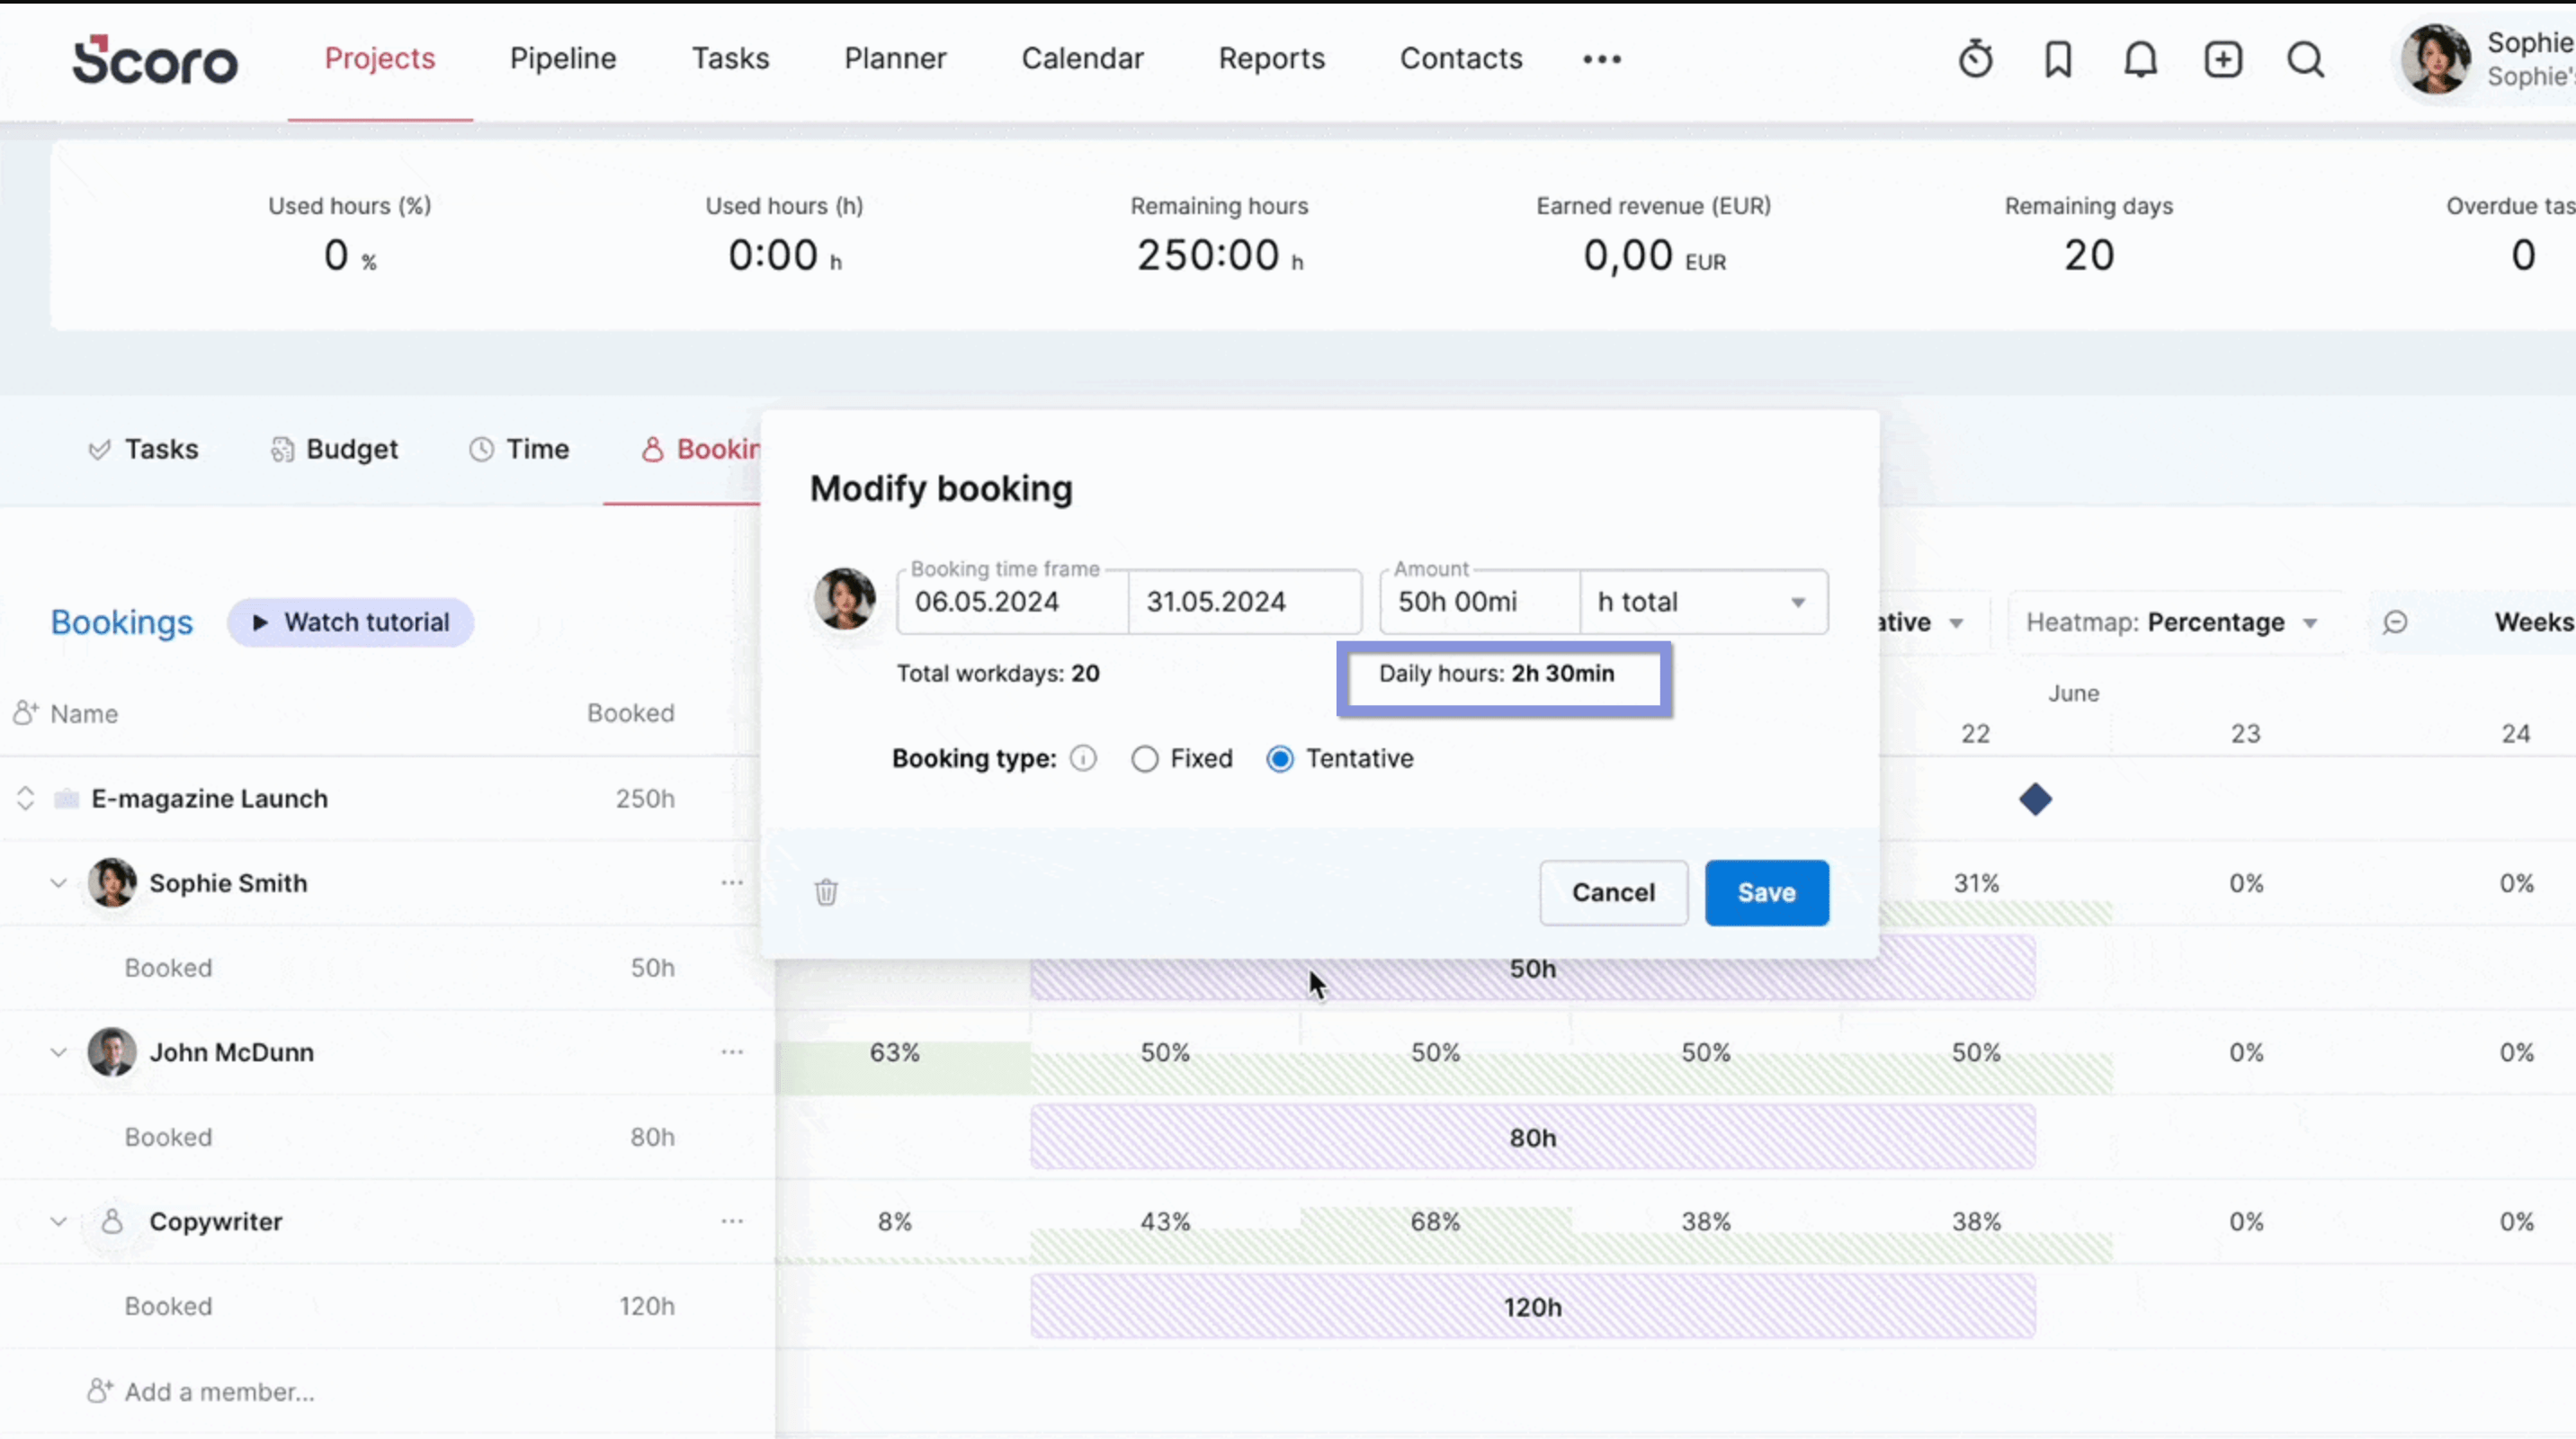
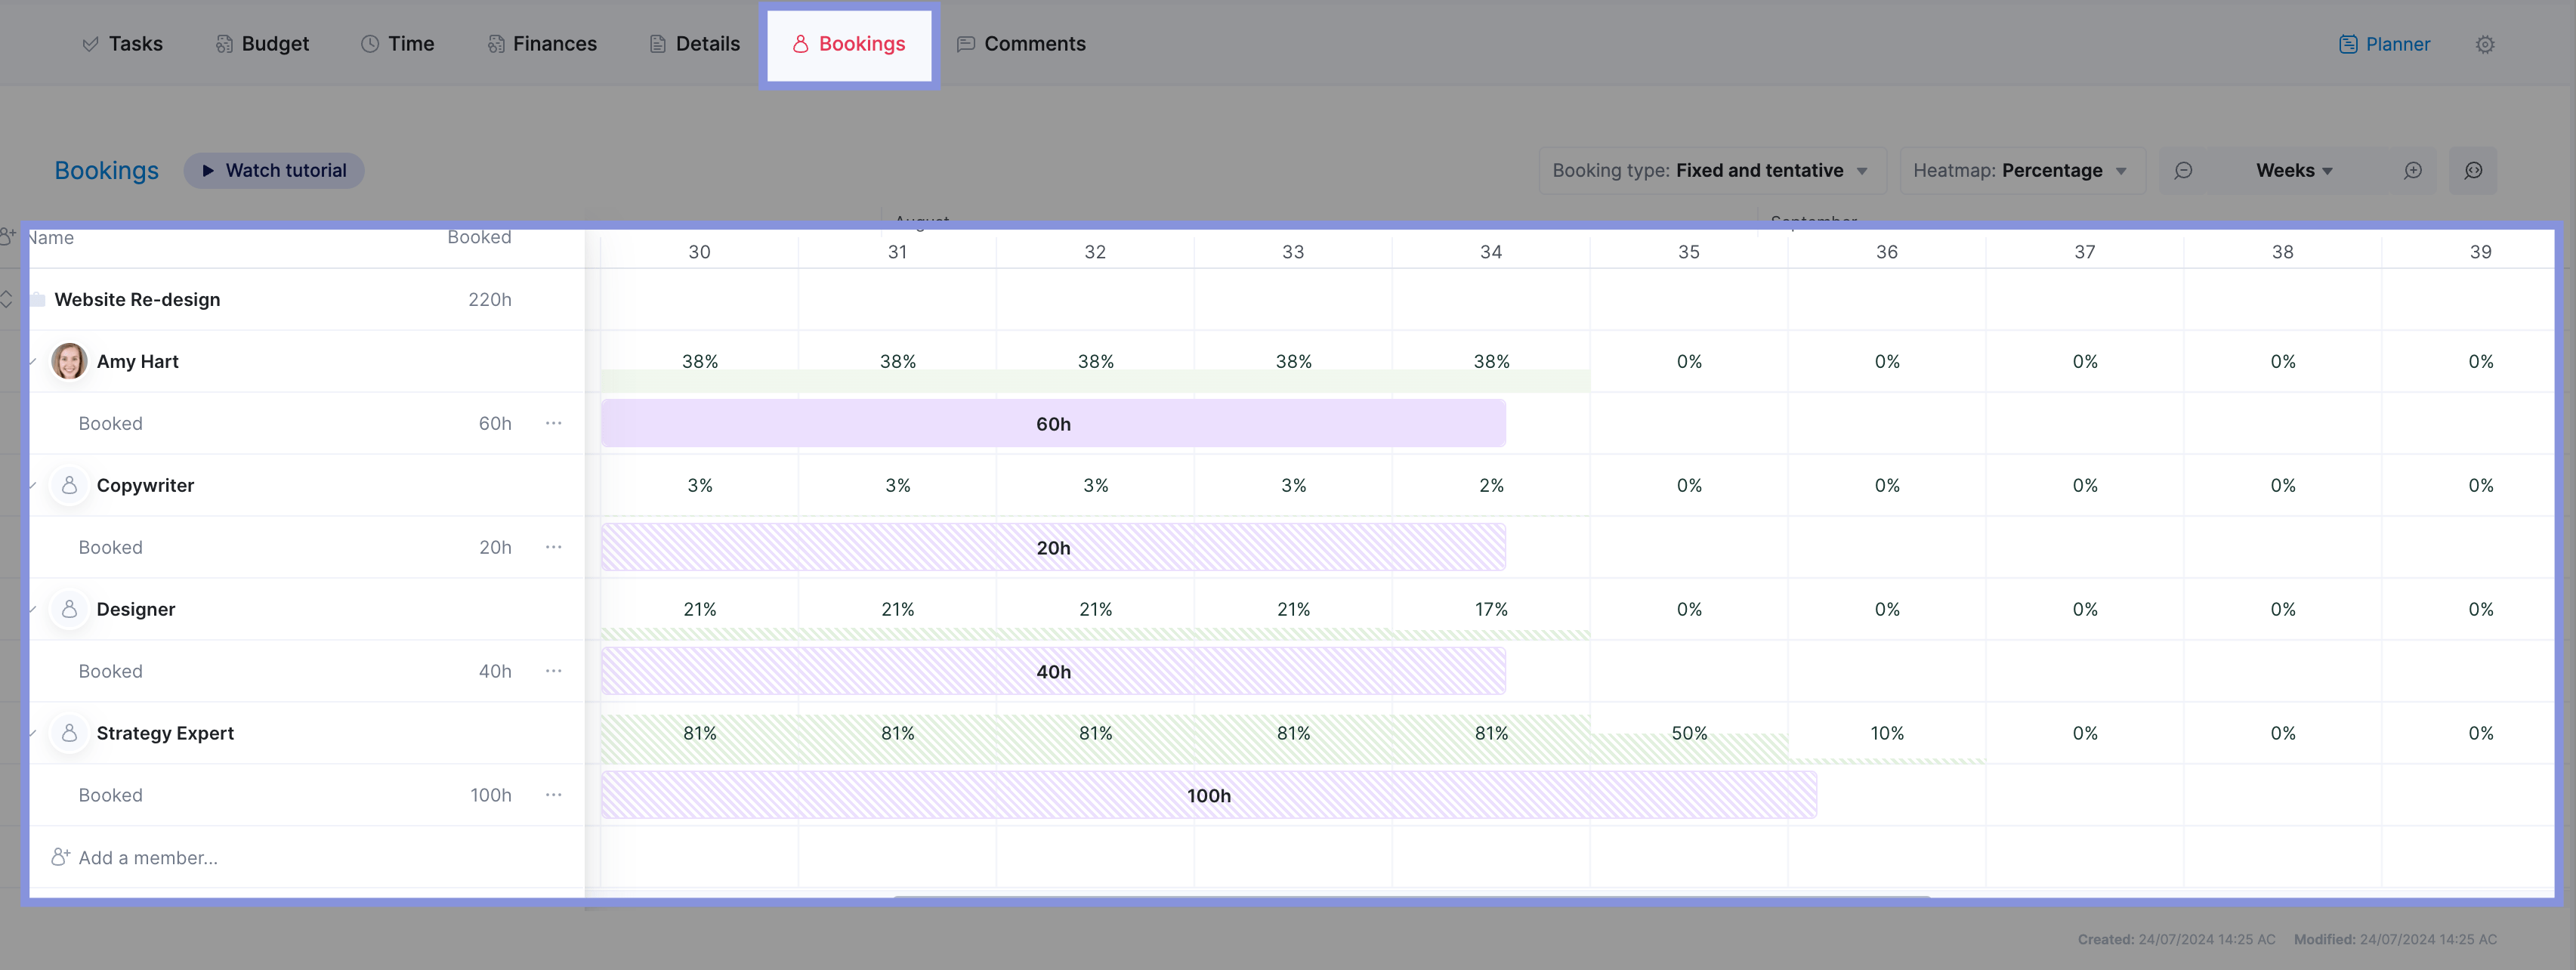
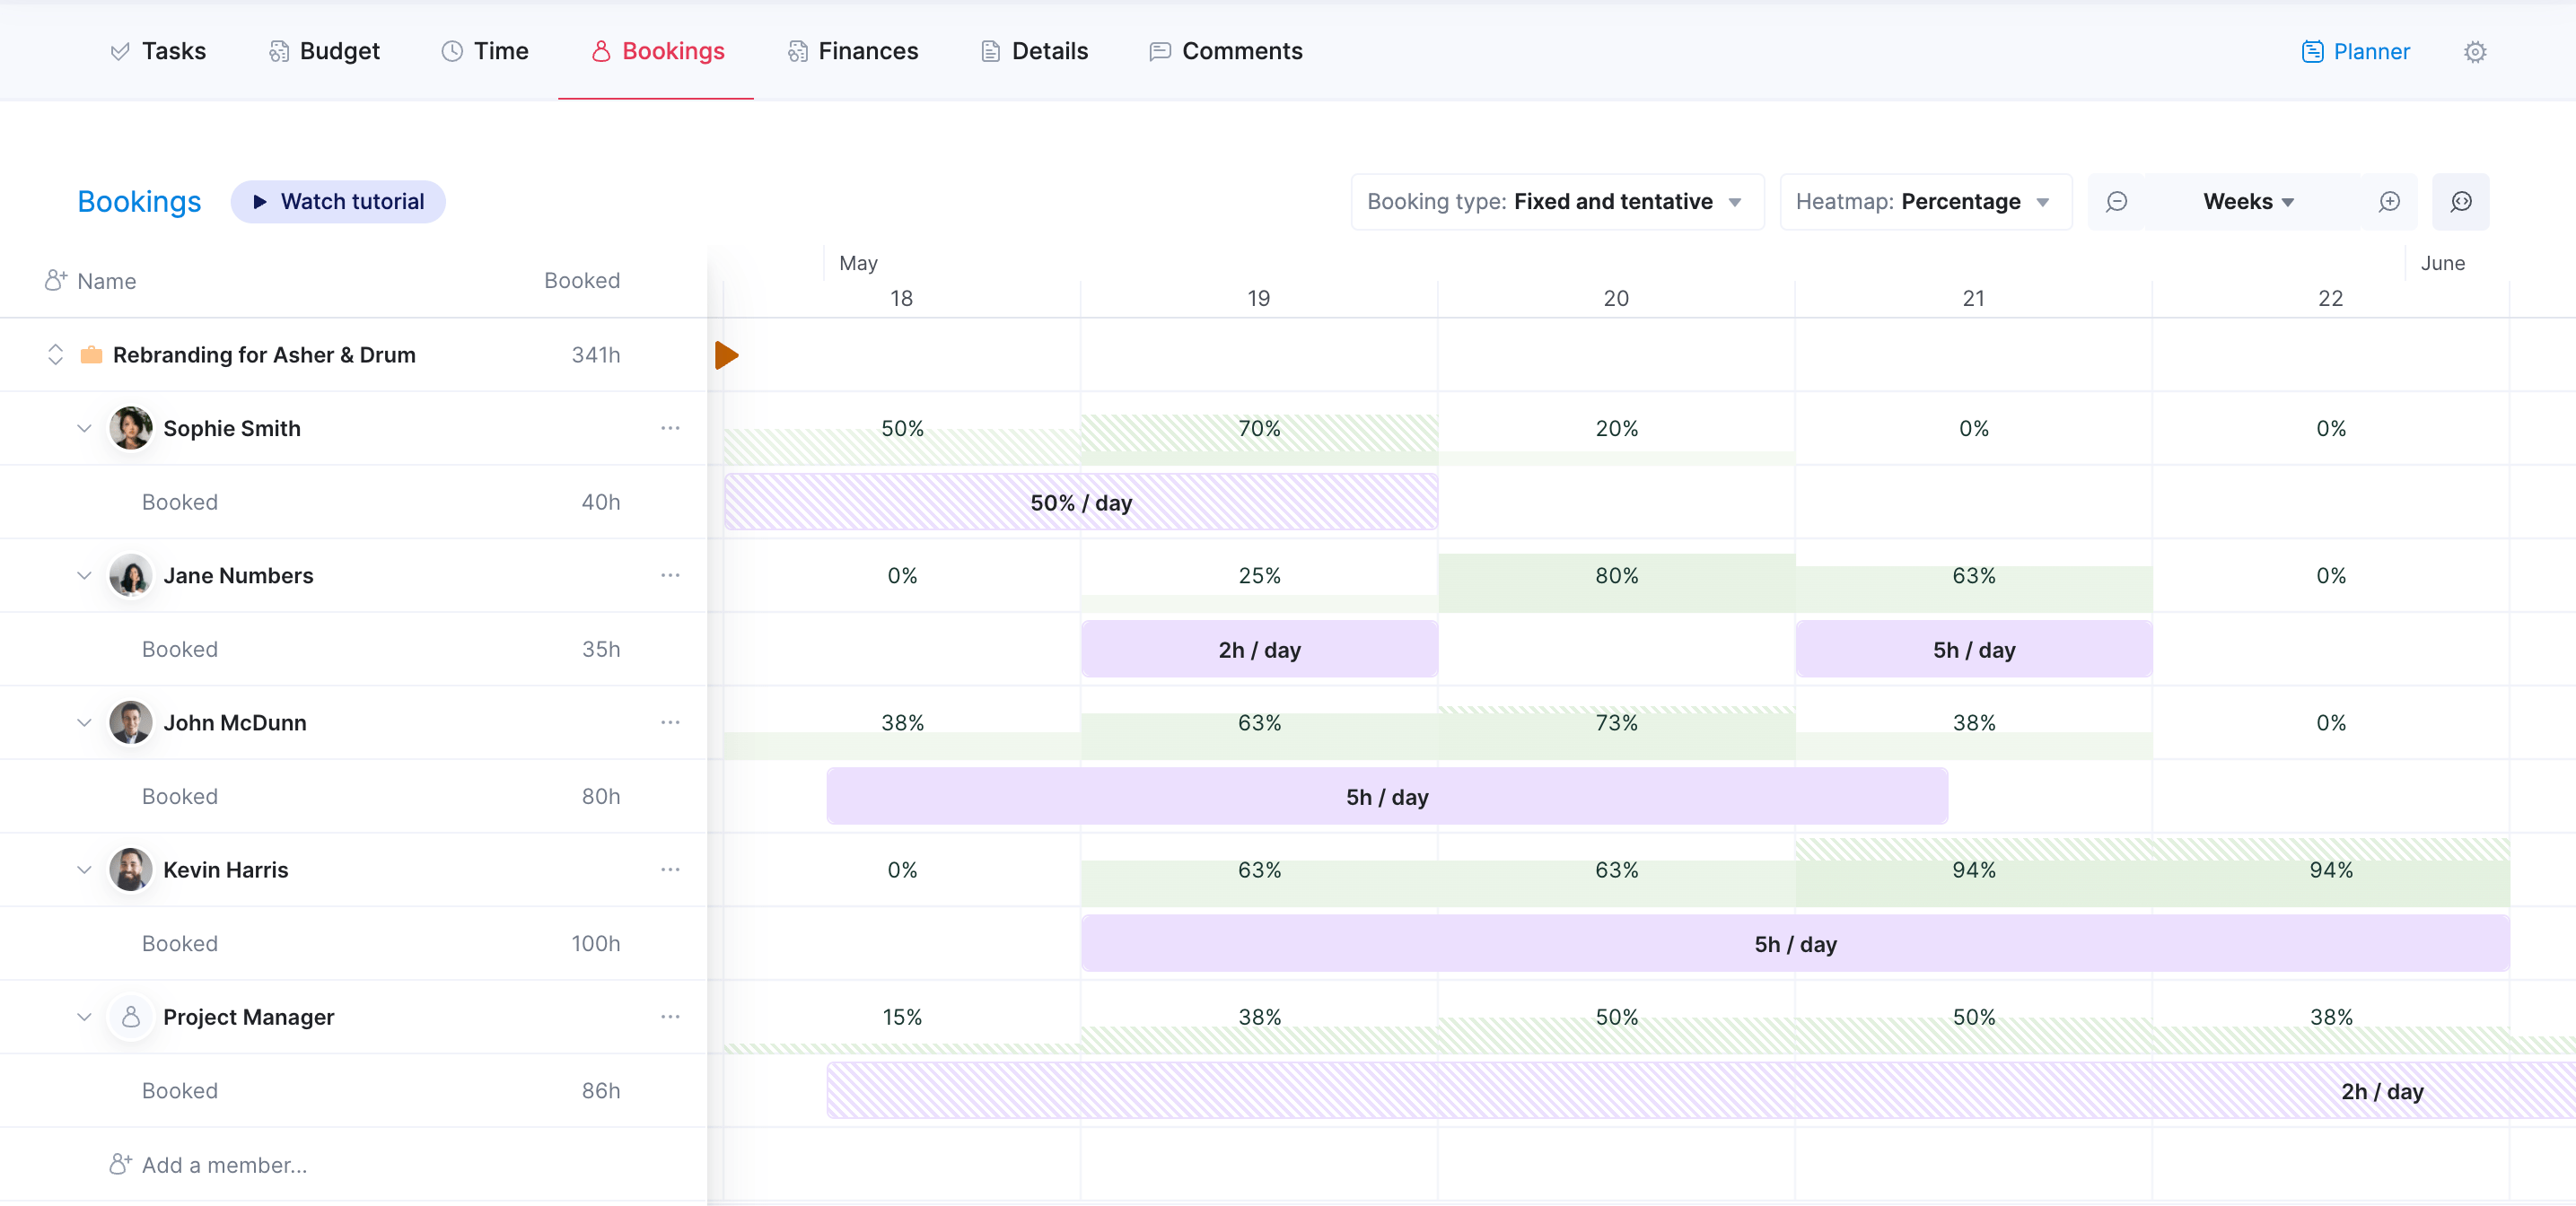
Go to Scoro’s “Bookings” tab for your project. Here, you can see tentative time slots reserved based on the hours and roles you entered in your quote in the previous step.
For example, you quoted 50 hours for project management over four weeks. Assuming a five-day workweek, Scoro would automatically split this time across 20 workdays. So, 2.5 hours would be tentatively booked daily (50 hours / 20 workdays = 2.5 hours per day).
The heat map uses different colors and patterns to convey important information:
- Green: Available time
- Red: Overbooked
- Purple: Unavailable time booked with tasks
- Striped: Tentative bookings that aren’t finalized (only available for roles, not individuals)
- Solid: Finalized bookings
Also, the percentages represent how much available time is left out of the total working hours. The daily hour notations tell you exactly how much time is currently booked on the schedule.
This initial view helps you understand the overall demand for each role. And address any immediate scheduling conflicts.
Here, you can clearly visualize your resource availability and potential conflicts, from time off to long-term project commitments. You can also get an idea of which staff members have the bandwidth to handle the new project successfully.
For example, you might see that the Senior Graphic Designer role is in the red zone for the next two weeks.
You would then use Scoro to identify potential solutions, such as shifting project timelines or redistributing workloads, to eliminate resource conflicts.
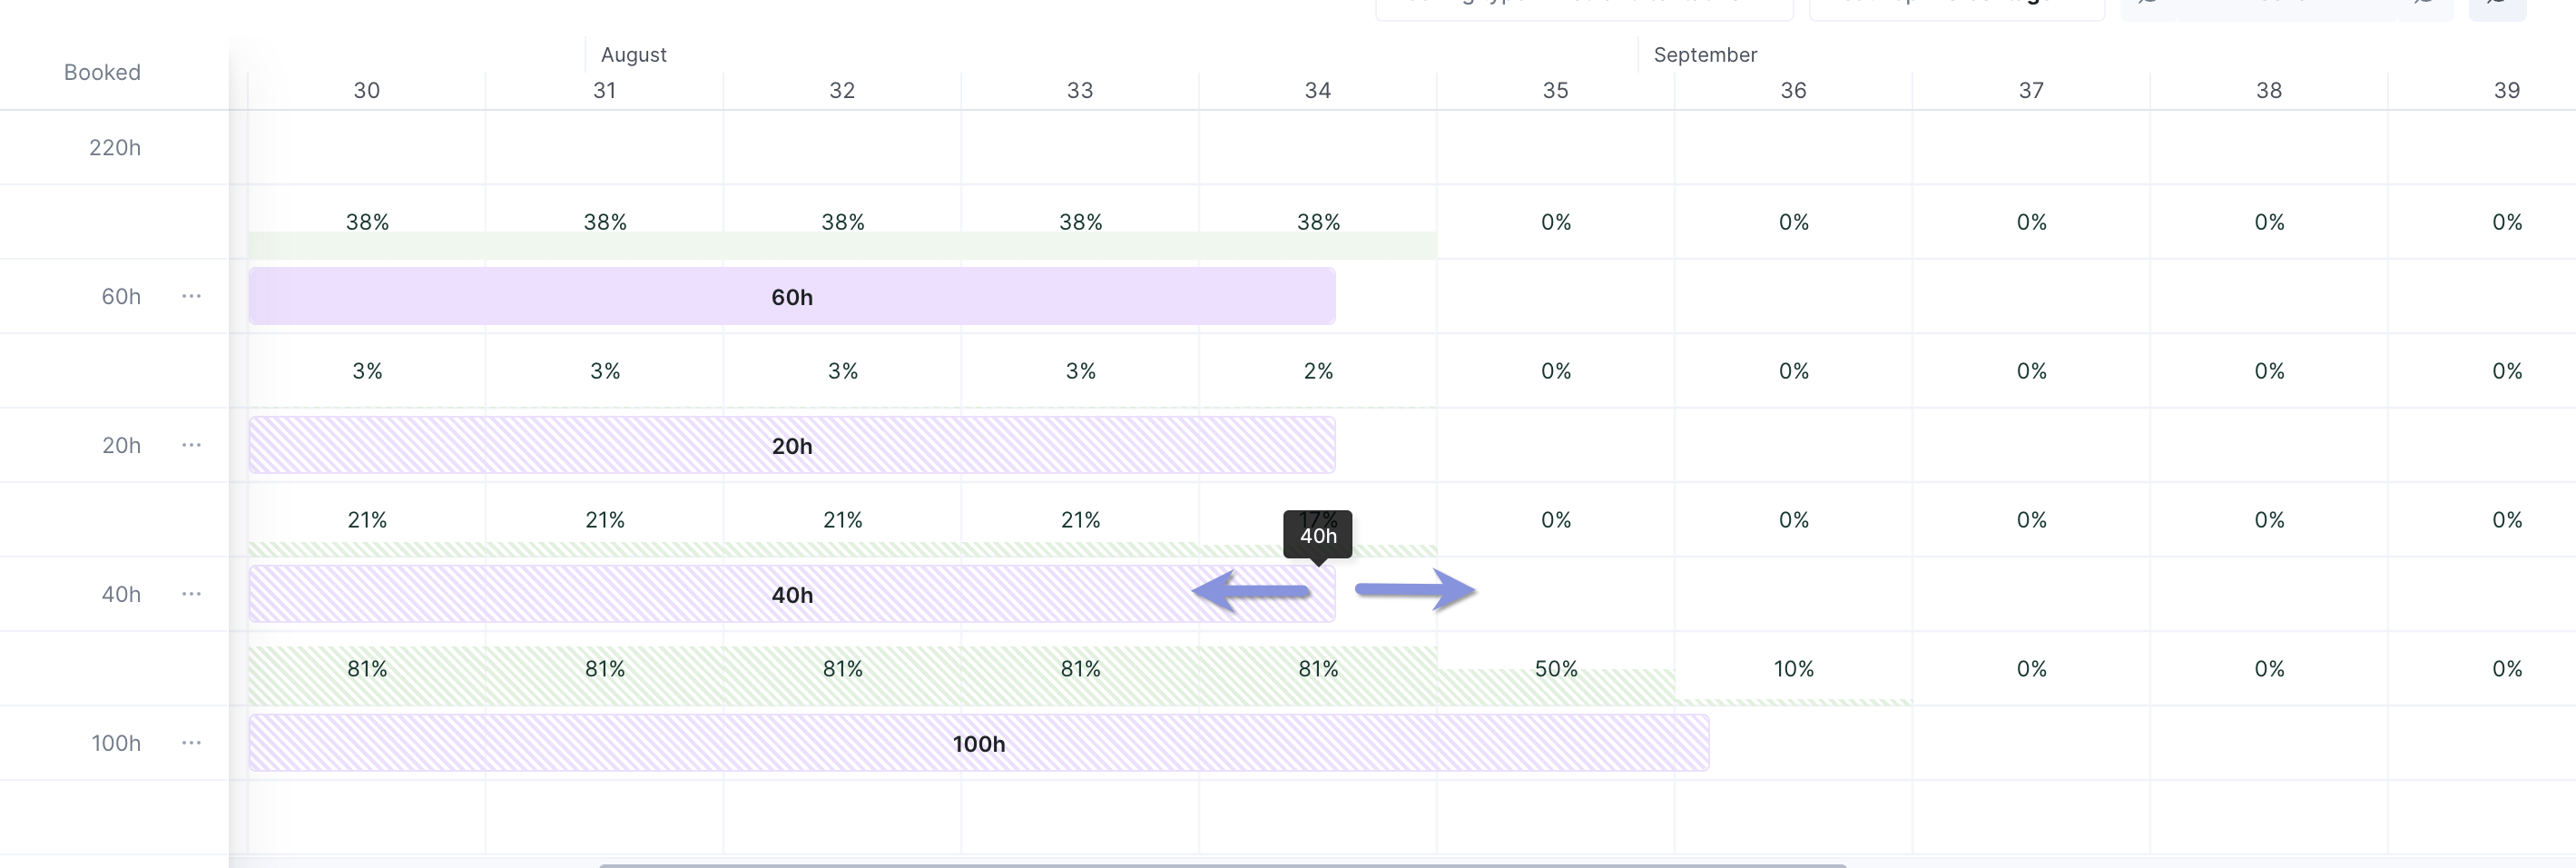
You can adjust booking timeframes by dragging and resizing the booking blocks to better align with your project schedule.
And to get a long-term view, switch the filter in the “Bookings” tab from days to months. This will help you avoid any resource conflicts further down the line.
Further Reading: Employee Resource Utilization 101: Your Ultimate Guide
3. Assign team members to project work
Once you’ve resolved calendar conflicts and are satisfied with the role-based schedule, assign specific team members to replace the role placeholders.
Consider their utilization rates and unique talents. You’re aiming for a workload that fosters productivity but not at the expense of your team’s well-being.
For instance, if senior developer Jane shows a utilization rate of 120% and junior developer Tom is at 60%, consider moving some tasks from Jane to Tom to help bring her down closer to a more balanced 75 to 80% sweet spot.
Additionally, this gives Tom more valuable experience to apply to future projects, expanding your team’s skill set without needing to hire more people or outsource work.
Alternatively, if you have a different, time-sensitive project, it might make more sense to use Jane, who can work faster and still deliver high-quality results.
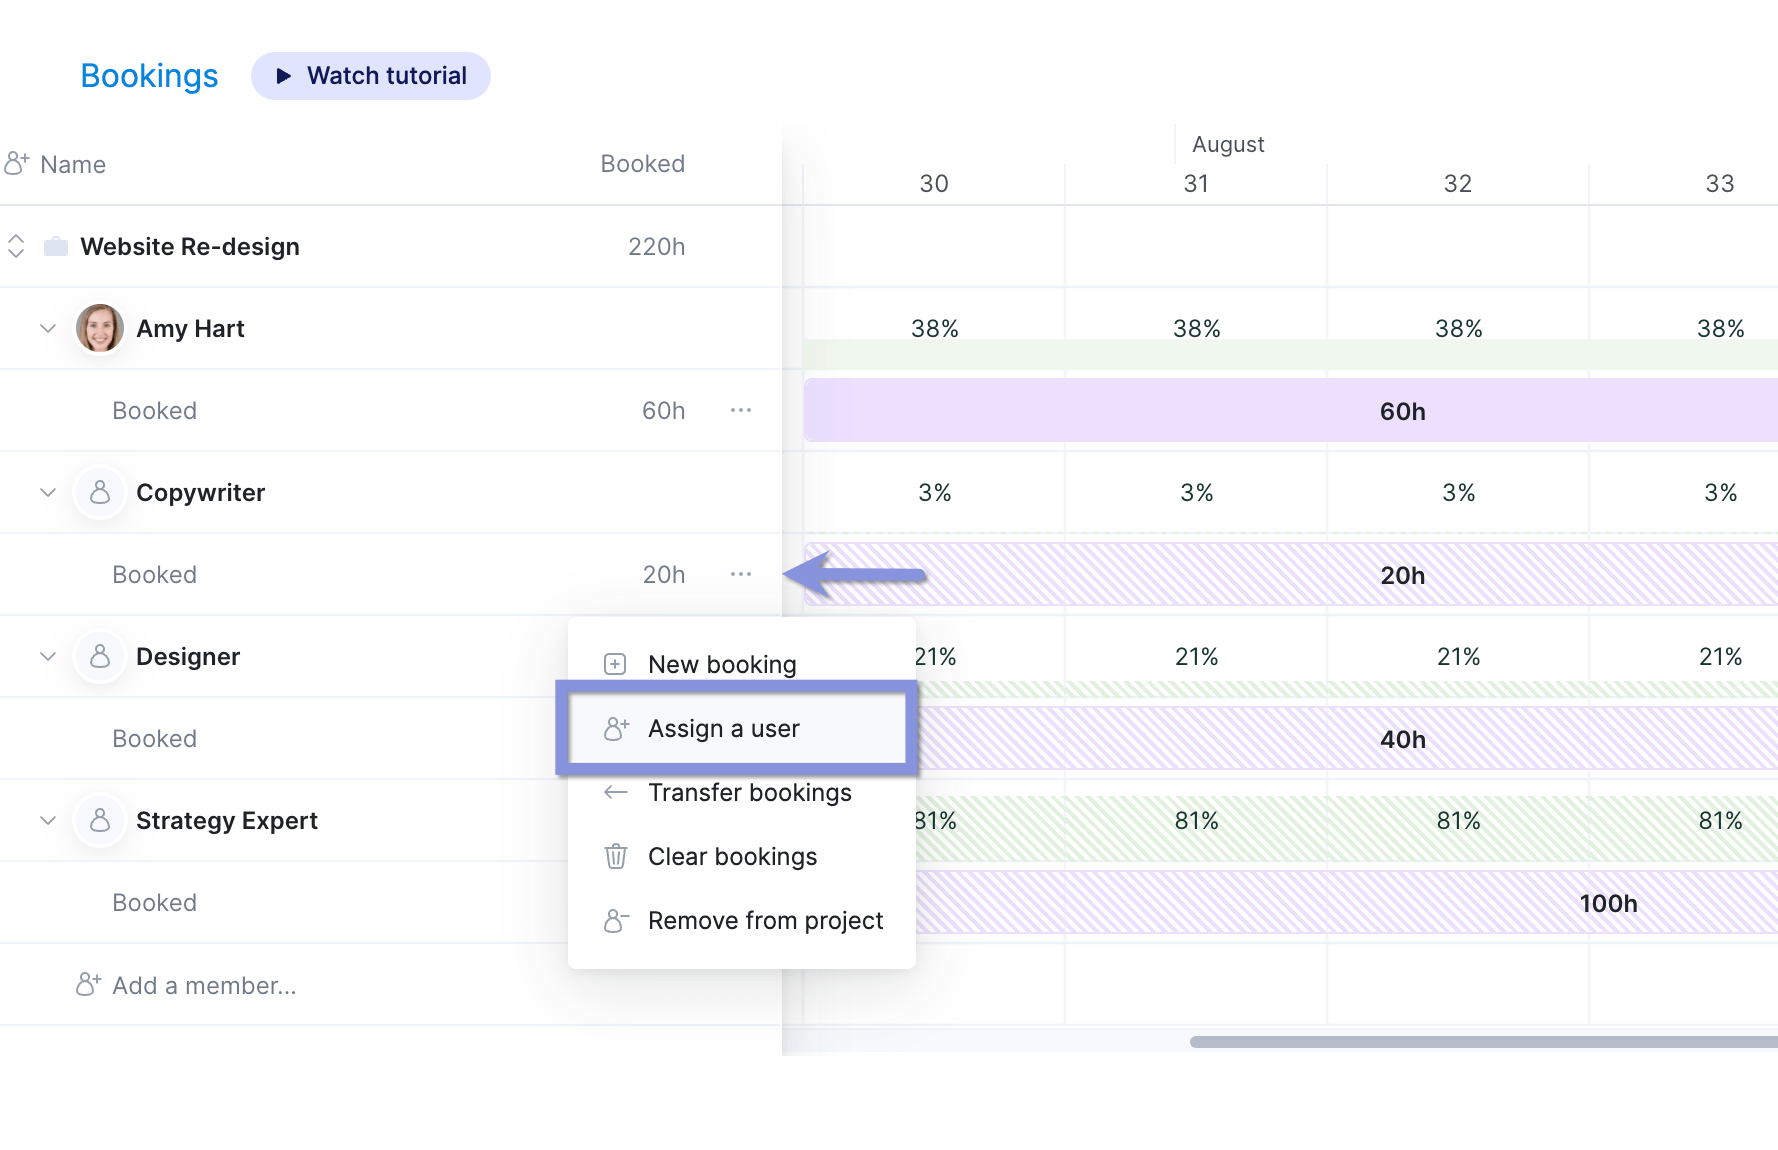
When assigning specific team members, click the three dots next to the placeholder role. Choose “Assign User” and select the appropriate team member.
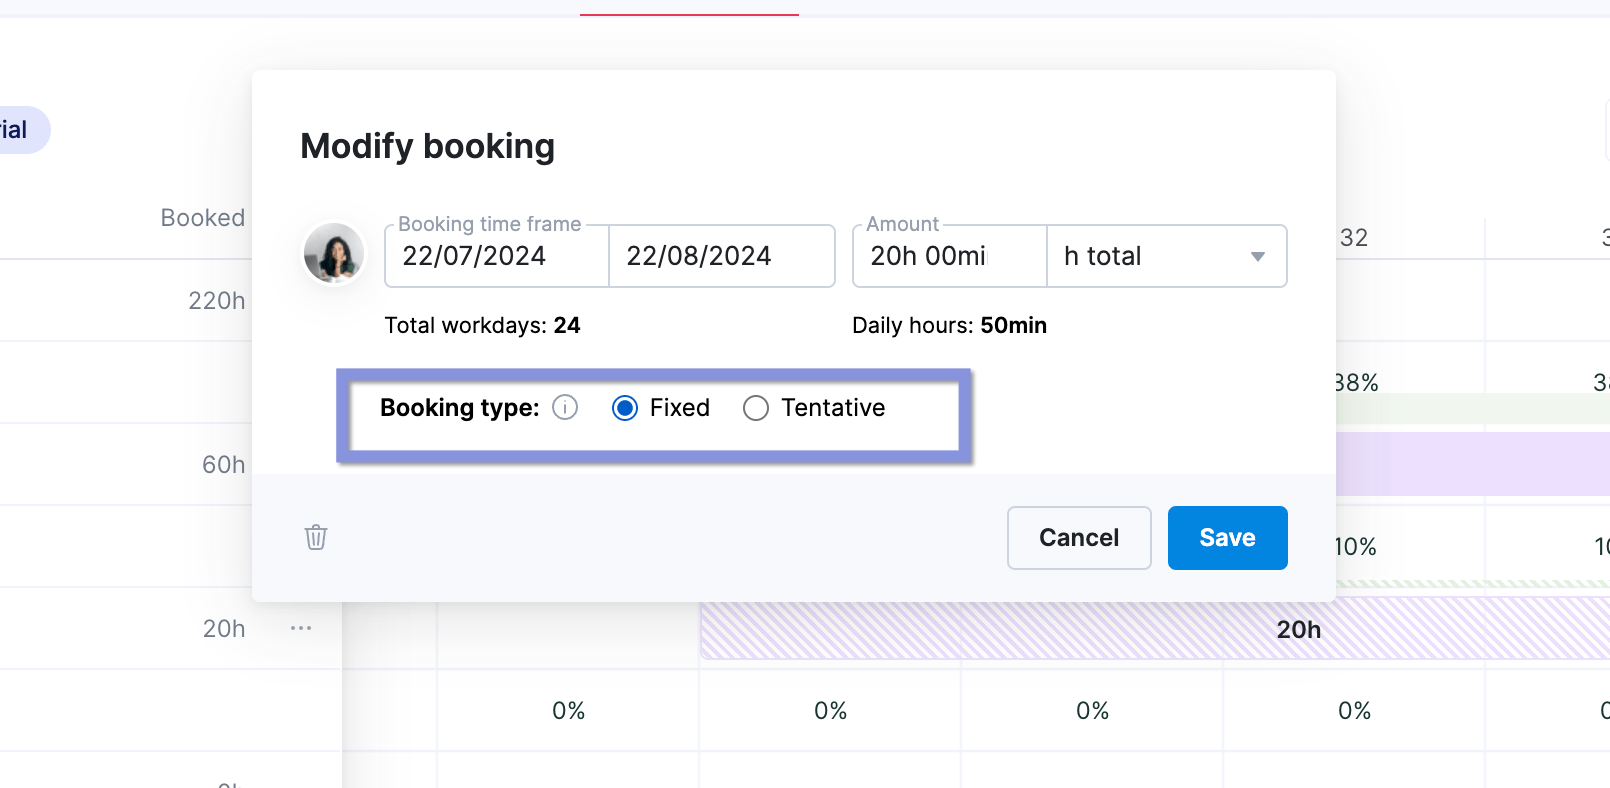
Once you’re satisfied, convert tentative bookings to fixed bookings.
Click the booking you want to confirm, and a window will appear. Then, simply change the booking from “Tentative” to “Fixed.”
And if someone becomes unavailable, Scoro makes it easy to transfer work between team members.
You can transfer bookings by clicking the three dots next to the user’s name, choosing who to transfer the bookings to, and confirming the transfer by selecting “Transfer bookings.”
4. Connect with your team members on resource scheduling
Congrats, you now have a resource plan in place! The next step is resource scheduling or assigning actionable, day-to-day tasks to your chosen team members.
Clear, well-defined tasks are key for successful project execution. When team members lack clearly assigned tasks, they may:
- Waste time trying to figure out what they should be working on
- Duplicate efforts by unknowingly working on the same things
- Miss important deliverables and deadlines
- Struggle to prioritize their work
- Feel disconnected from the project’s overall goals and progress
This is where you would head to the “Planner” view in Scoro.
The “Planner” lets you drag and drop tasks from a list onto team members’ calendars to assign work and set deadlines.
But be sure to include team members in conversations about task assignments. This shows them that you care about their input and strengthens collaboration. And they may have insights about timelines, potential challenges, or resource needs that you haven’t considered.
Imagine you’re managing a website redesign project. After speaking with UX designer Sarah about her workload, you can now:
- Drag and drop the “UX Research” task to her schedule for the first week
- Create a new “Wireframe” task and assign it to her for the second week
- Add a “Visual Design” task for your graphic designer, Mike, scheduling it to start after Sarah’s wireframe is complete
- Adjust the duration of surrounding tasks if needed by simply resizing them in the visual interface
Check out our guide on resource scheduling for more info on assigning work to your project teams.
Use Scoro as your resource planning tool
Tools like Scoro simplify resource planning. They are a central hub for all project information and team schedules, helping you make smarter, faster decisions about who’s working on what and when.
Just take it from online marketing agency Stramark—the company saved over 15 hours a week by using Scoro features like the Planner. If you’re also ready to take control of your resource planning, give Scoro a try.
Capacity planning means ensuring that there is enough time, people, and specific roles to execute projects successfully. It’s a high-level process that proactively evaluates these factors over weeks or months.
It influences the type and volume of work your team takes on. And it shapes hiring decisions, too.
For example, deciding whether you have enough developers with experience coding in C++ to execute a potential four-month project successfully.
Capacity planning vs resource planning vs resource scheduling
Capacity planning, resource planning, and resource scheduling are all related aspects of project and resource management. But here’s how they differ:
- Capacity planning is your first step. This is how you decide whether you have enough time, team members, and in-house experience to take on certain projects.
- Resource planning is your second step. This involves evaluating your team members’ skill sets and utilization rates to determine who will work on those projects. Like choosing someone to serve as the lead copywriter on a new account.
- Resource scheduling is your third step. Here, you determine which specific tasks team members will work on and when they need to work on them. For example, you might schedule a specific copywriter to draft the first blog post for a new client by the end of the week.
Benefits of capacity planning
Capacity planning helps you say goodbye to chaotic schedules, missed deadlines, and overworked employees. Optimizing your team’s capacity brings a number of benefits, including:
- Greater profitability: When you know your team’s skill sets and availability, you can create realistic timelines and budgets—ones that are less likely to need to be adjusted during the project. This helps improve client satisfaction and retention and improves your project profitability.
- Better cost control: Capacity planning helps you avoid unplanned overtime costs by identifying resource limitations early in the project lifecycle. You can also account for limited bandwidth by proactively adjusting timelines or outsourcing ahead of time.
- Precise revenue forecasting: With a clear understanding of your team’s billable capacity, you can set achievable utilization targets and confidently project revenue based on the planned workload. And your numbers help leadership plan investments, hire employees, and expand the business—without worrying about cash flows.
- Informed hiring decisions: Capacity planning provides clear data on your team’s bandwidth and skills. So, you can use these objective insights to decide if you need to hire, upskill existing staff, or redistribute work. It prevents both understaffing crises and expensive overstaffing.
- Balanced workloads: By tracking your team’s capacity, you can clearly identify who needs more work or less. And redistribute tasks as needed, helping to prevent costly burnout and disengagement.
- Stronger collaboration: Capacity planning clearly defines the roles and resources needed for each project stage. This prevents last-minute scrambling and ensures team members have the support they need from the start.
Capacity planning strategies
Let’s explore three common capacity planning strategies—lag, lead, and match—to help you determine which aligns best with your project needs and risk tolerance.
1. Lag strategy (wait and see)
With the lag strategy, you only hire or add people when demand increases—like refueling a car when the gas tank is empty. This approach aims to keep labor costs as low as possible without causing burnout.
The lag strategy works best for gradual, predictable increases in demand because it allows businesses to add resources incrementally as needed.
With slow, foreseeable growth, companies have time to identify when more than current capacity is required. They can then hire or allocate new resources just in time, minimizing periods of overcapacity and unnecessary costs.
For example, an accounting firm might see a steady 5% increase in clients yearly. They can plan, knowing exactly when to hire an additional accountant. This approach keeps labor costs tightly aligned with actual demand.
However, this strategy struggles with rapid or unpredictable changes.
When unexpected demand spikes occur, there’s a delay between recognizing the need for more resources and actually acquiring them. Hiring and onboarding new staff or reallocating existing resources takes time.
In fast-moving markets, the delay in scaling up could also mean missing out on new business opportunities.
Scoro’s “Utilization report” helps mitigate this risk by letting you monitor your team’s resource utilization in real-time.
It compares your team’s total work capacity (available hours) against the tasks and events they’re scheduled for within a specific timeframe (days, weeks, or months).
This gives you a quick overview of each team member’s utilization percentage, making it easy to see who’s available for new work.
2. Lead strategy (be prepared)
With the lead strategy, you book team members before you officially need them—like stocking up before a storm.
It’s great for handling unexpected demand spikes. And it’s crucial in competitive markets where losing business to rivals is a constant threat. In these environments, there’s intense pressure to exceed client expectations.
The lead strategy suits businesses with seasonal demand, growth ambitions, and a low tolerance for turning away new business opportunities.
For example, imagine a marketing agency before its peak season. Knowing demand will increase, it hires three new team members and expands its freelance roster.
The risk?
Inaccurate resource forecasts can lead to underutilized employees and unnecessary labor costs. You can end up paying people for admin work instead of revenue-generating work.
This directly impacts your profitability—you incur higher costs without a corresponding increase in billable work, which can significantly reduce your profit margins and ROI.
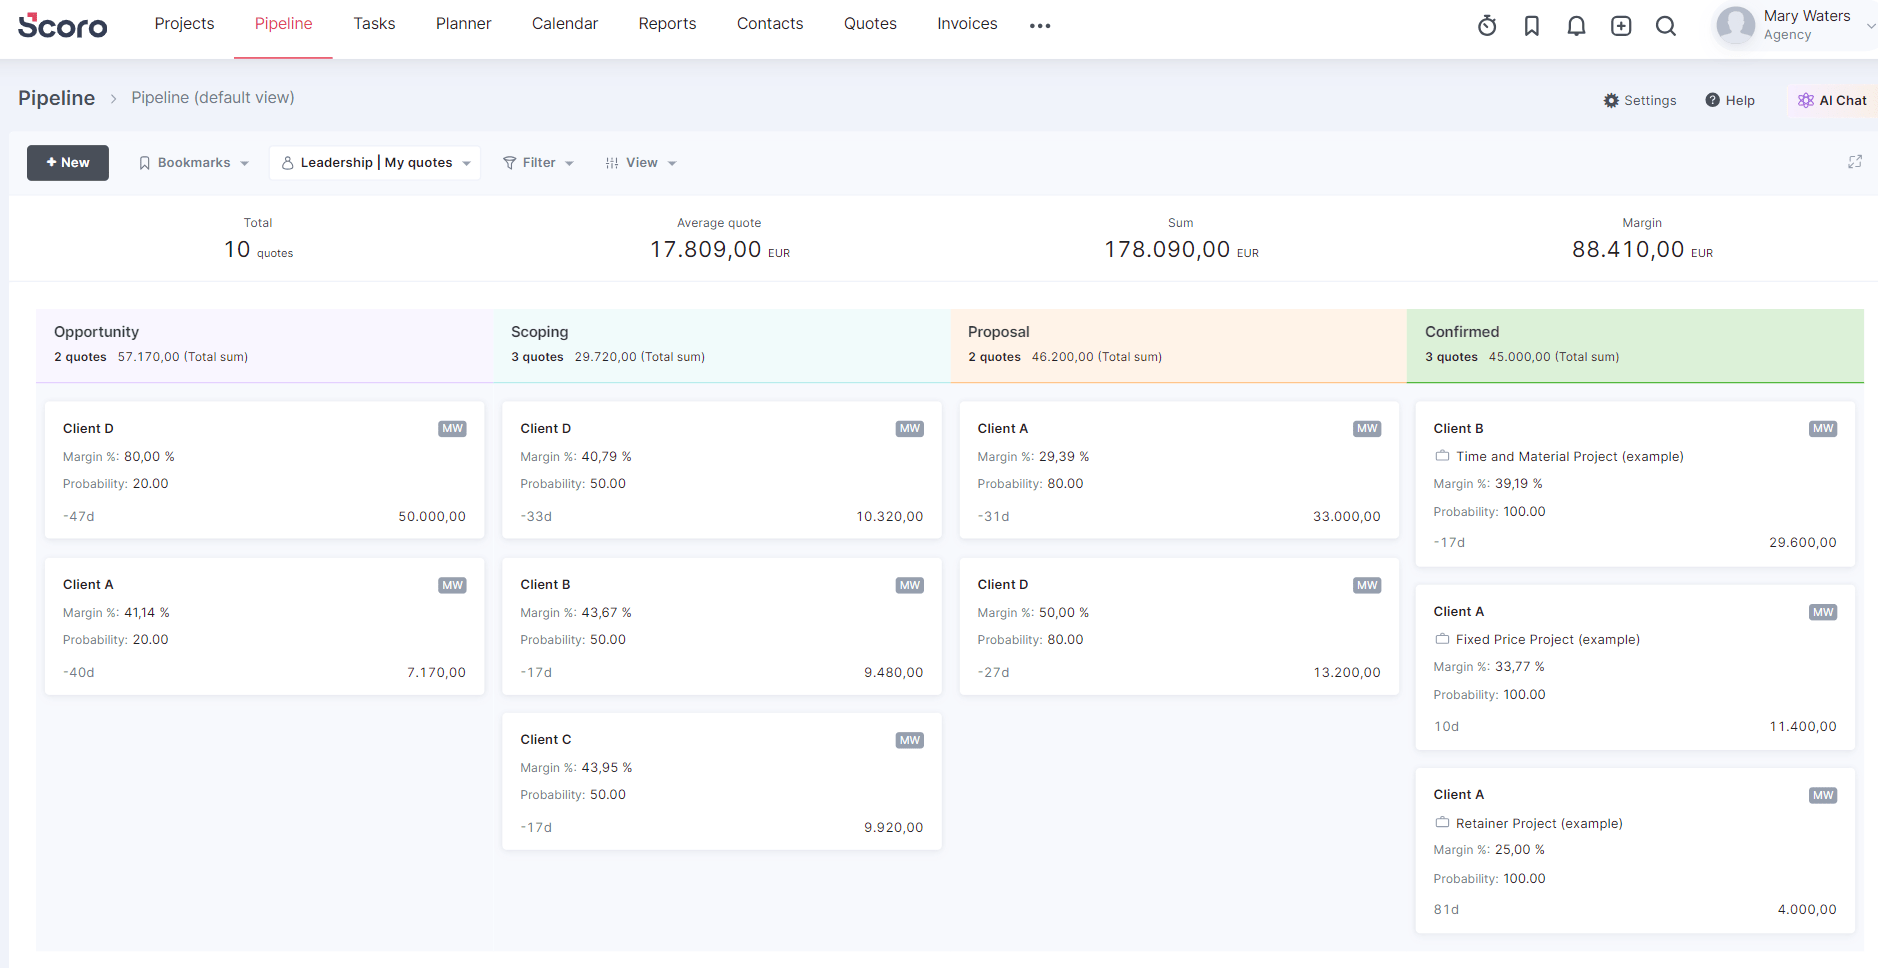
Scoro’s sales pipeline helps you ensure accurate capacity planning by showing all potential deals and their progress through various stages.
This lets you see the number and types of projects likely to move forward, providing a clear picture of upcoming demand.
By having a consolidated view of upcoming projects and their resource needs, you can prioritize projects based on their strategic importance, deadlines, and resource availability.
3. Match strategy (find the middle ground)
The match strategy is a balanced, flexible approach to capacity planning. You combine the cost-saving nature of lag with the proactive planning of lead.
How?
By closely monitoring current demand while forecasting future needs. And continuously tweaking resource levels to avoid underutilization or overbooking.
For example, consider a software development company with changing client needs.
They maintain a stable core team for a consistent workload and use freelancers for flexibility. During busy periods, they bring in more freelancers. In slower times, they reduce freelancer hours without affecting the core team.
While the match strategy is adaptable, it requires more effort than other approaches. You need to manage all project workloads, accurately forecast demand, and clearly understand your team’s utilization rates.
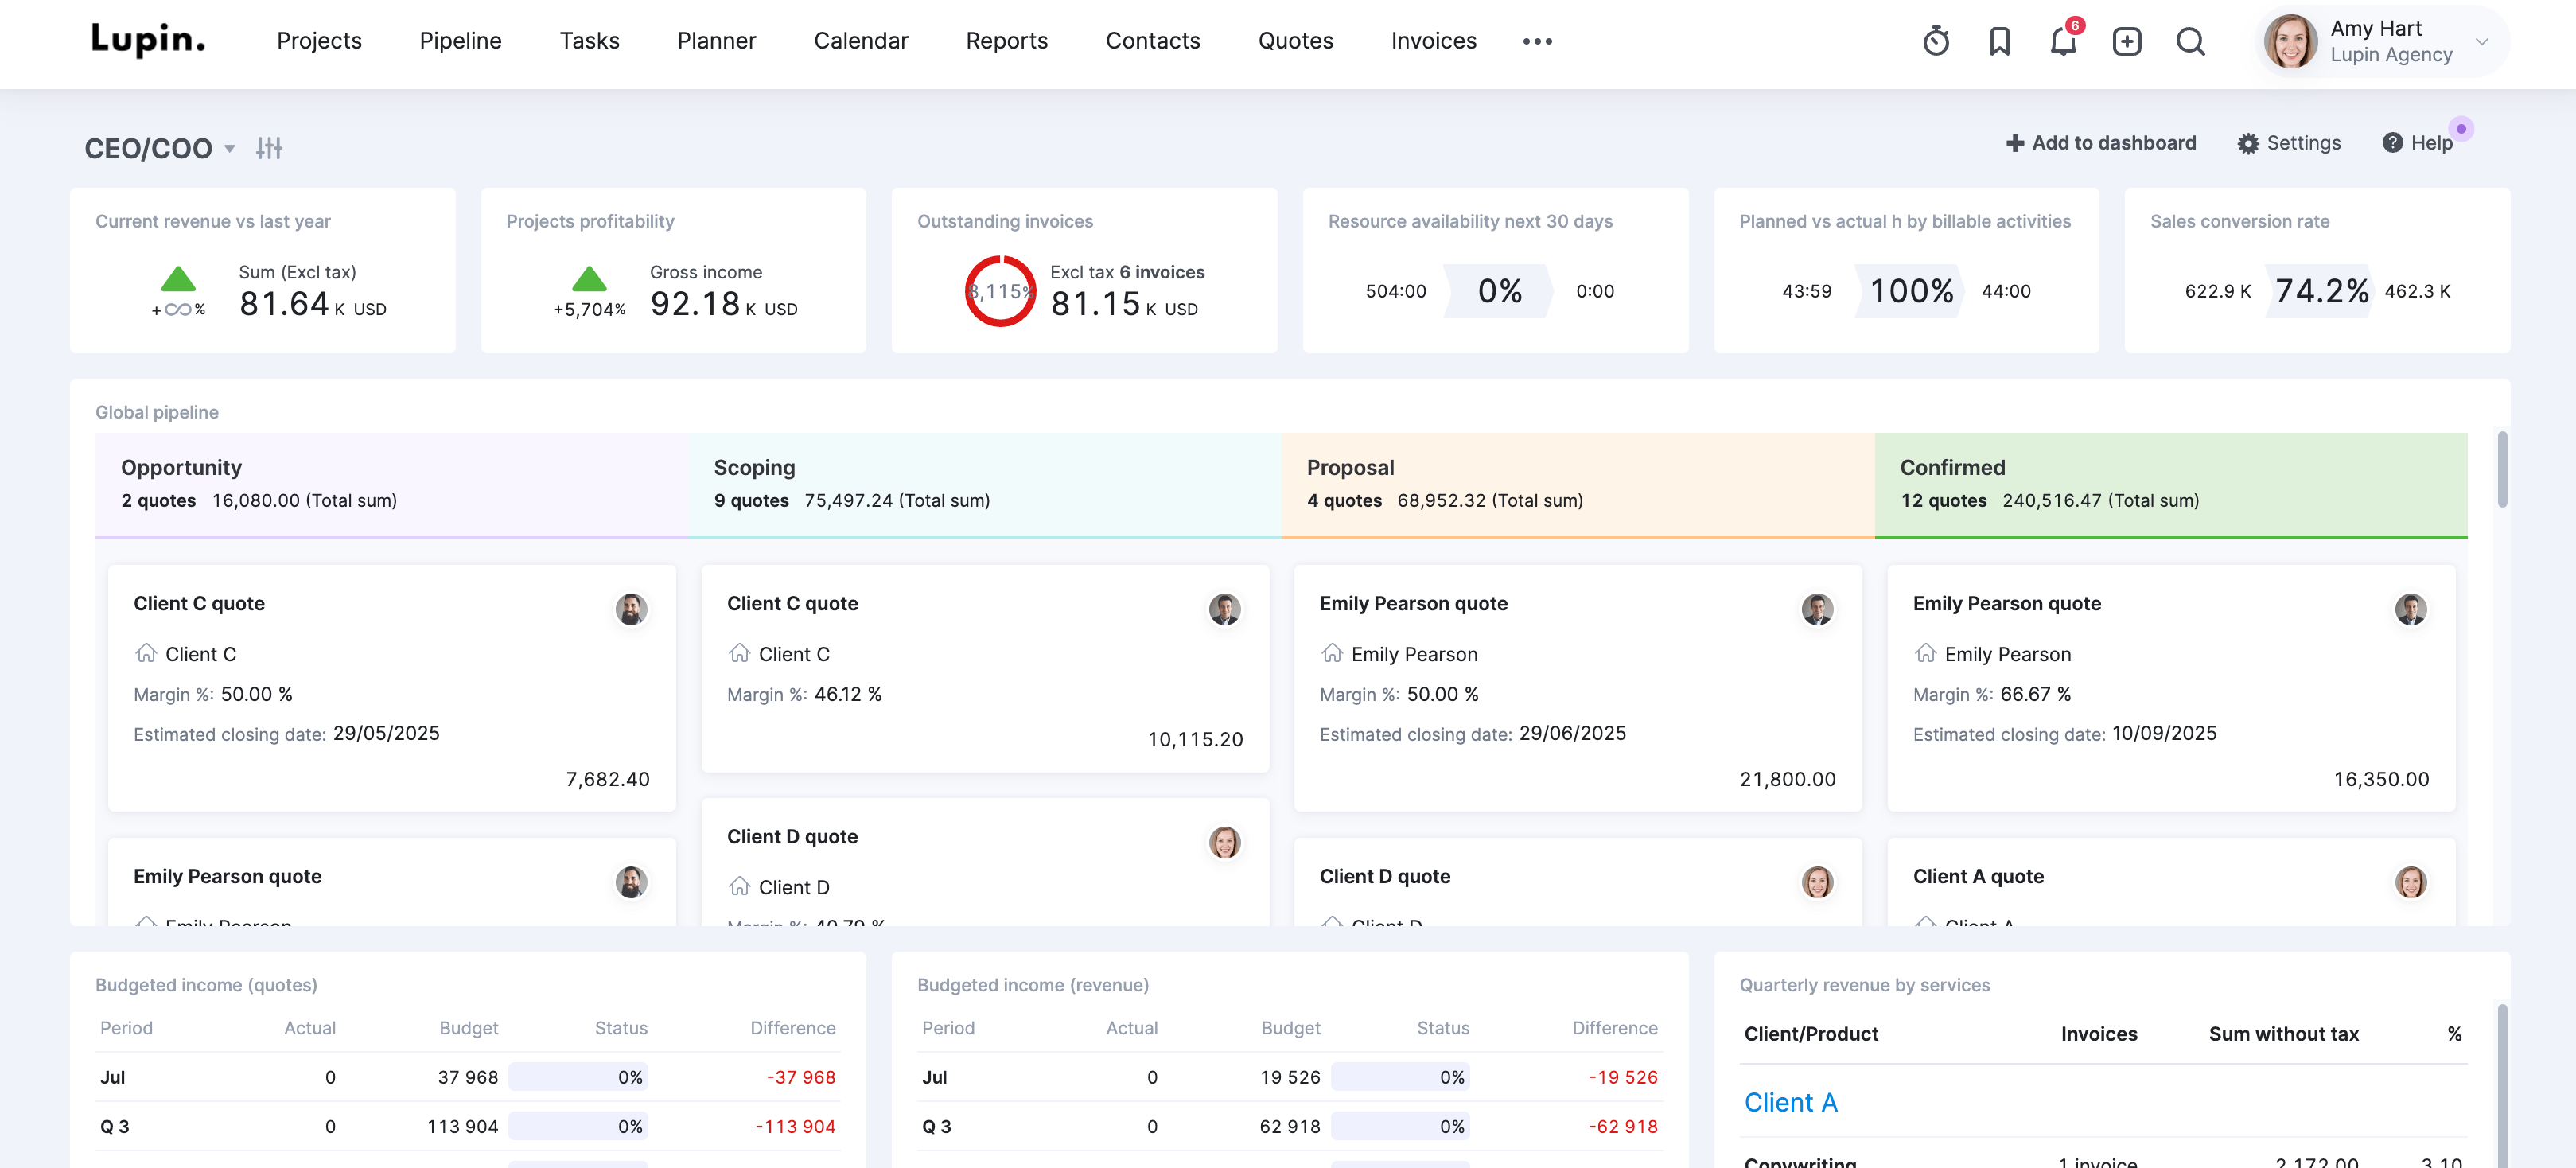
Scoro’s custom dashboards and reporting features help you do just that.
For example, the default “CEO/COO” dashboard provides a comprehensive overview of your company’s performance, showcasing metrics like resource availability over the next 30 days, planned versus actual billable activities, sales conversion rate, and a visual representation of your sales pipeline.
5 steps to implement effective capacity planning
Good capacity planning helps you use your team’s time and skills better. Leading to increased productivity, more accurate project timelines, and higher-quality deliverables.
Here’s how to do it:
Step 1: Create a project priority matrix
Create a project priority matrix for continuous capacity planning. This way, when your team gets busy, you’re not rushing through key decisions on how best to handle potential new work.
Start by using a priority matrix to define your most important projects.
Consider:
- Client value: Which clients bring in the most revenue? Which ones have been clients the longest? Do they have one-off projects or long-term engagements?
- Deadlines: Which projects have the shortest and longest deadlines?
- Profitability: Which types of projects make your company the most money?
- Labor needs: What mix of in-house and outsourced resources do different projects or clients require?
Categorize projects as high or low urgency and high or low importance. Then, communicate this to your team so everyone understands which projects to prioritize if resource conflicts arise.
Supplement your matrix with data to make the most informed decisions on which projects and clients to prioritize.
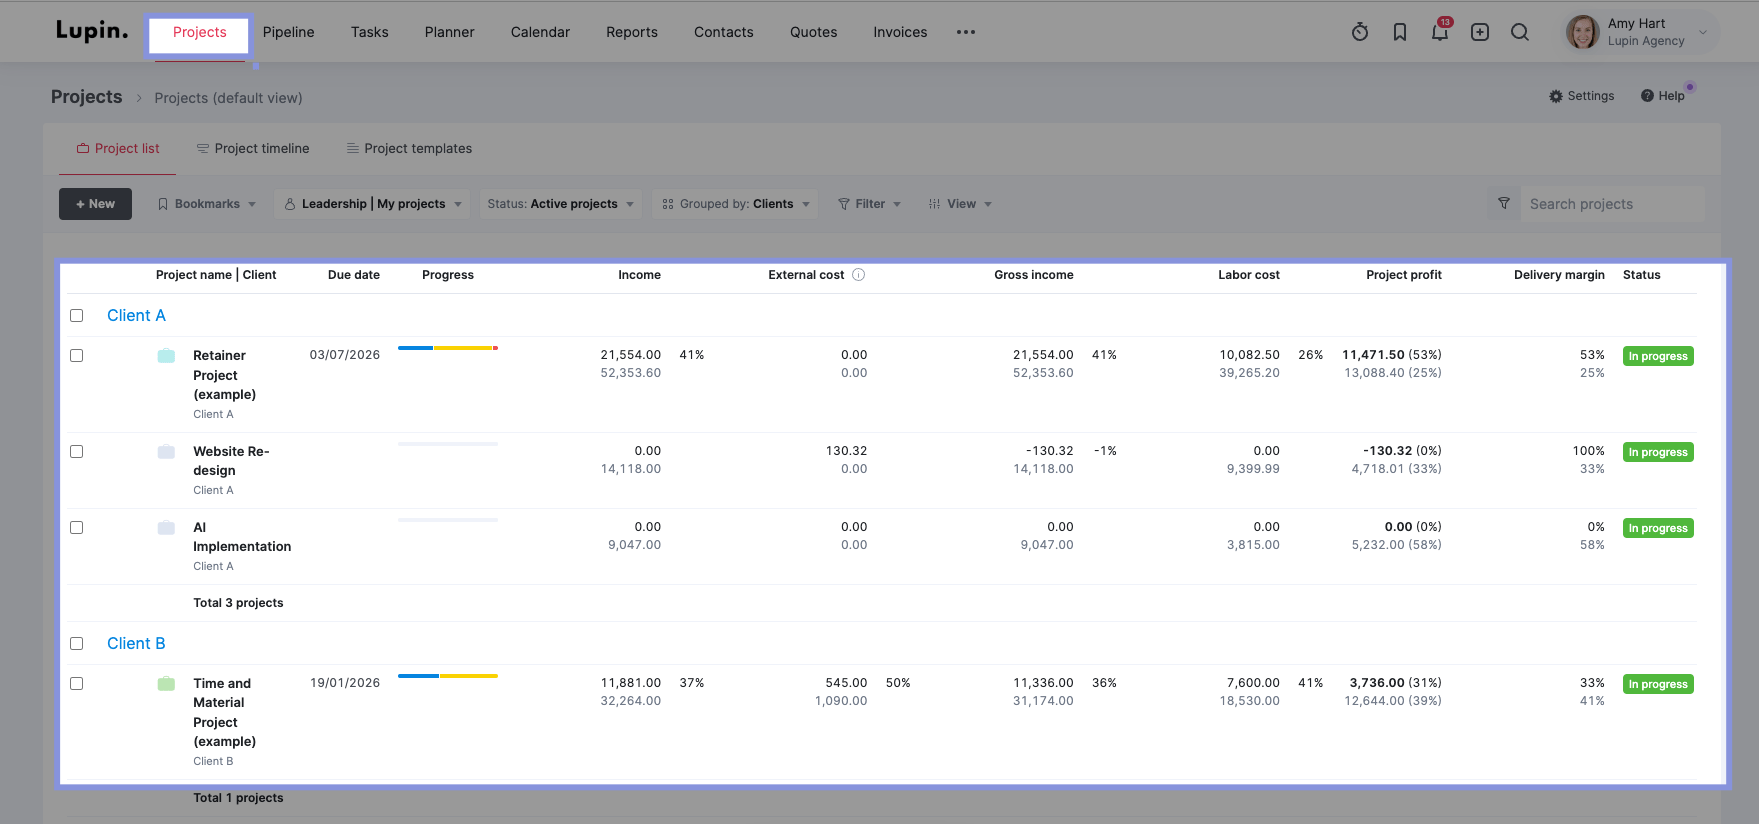
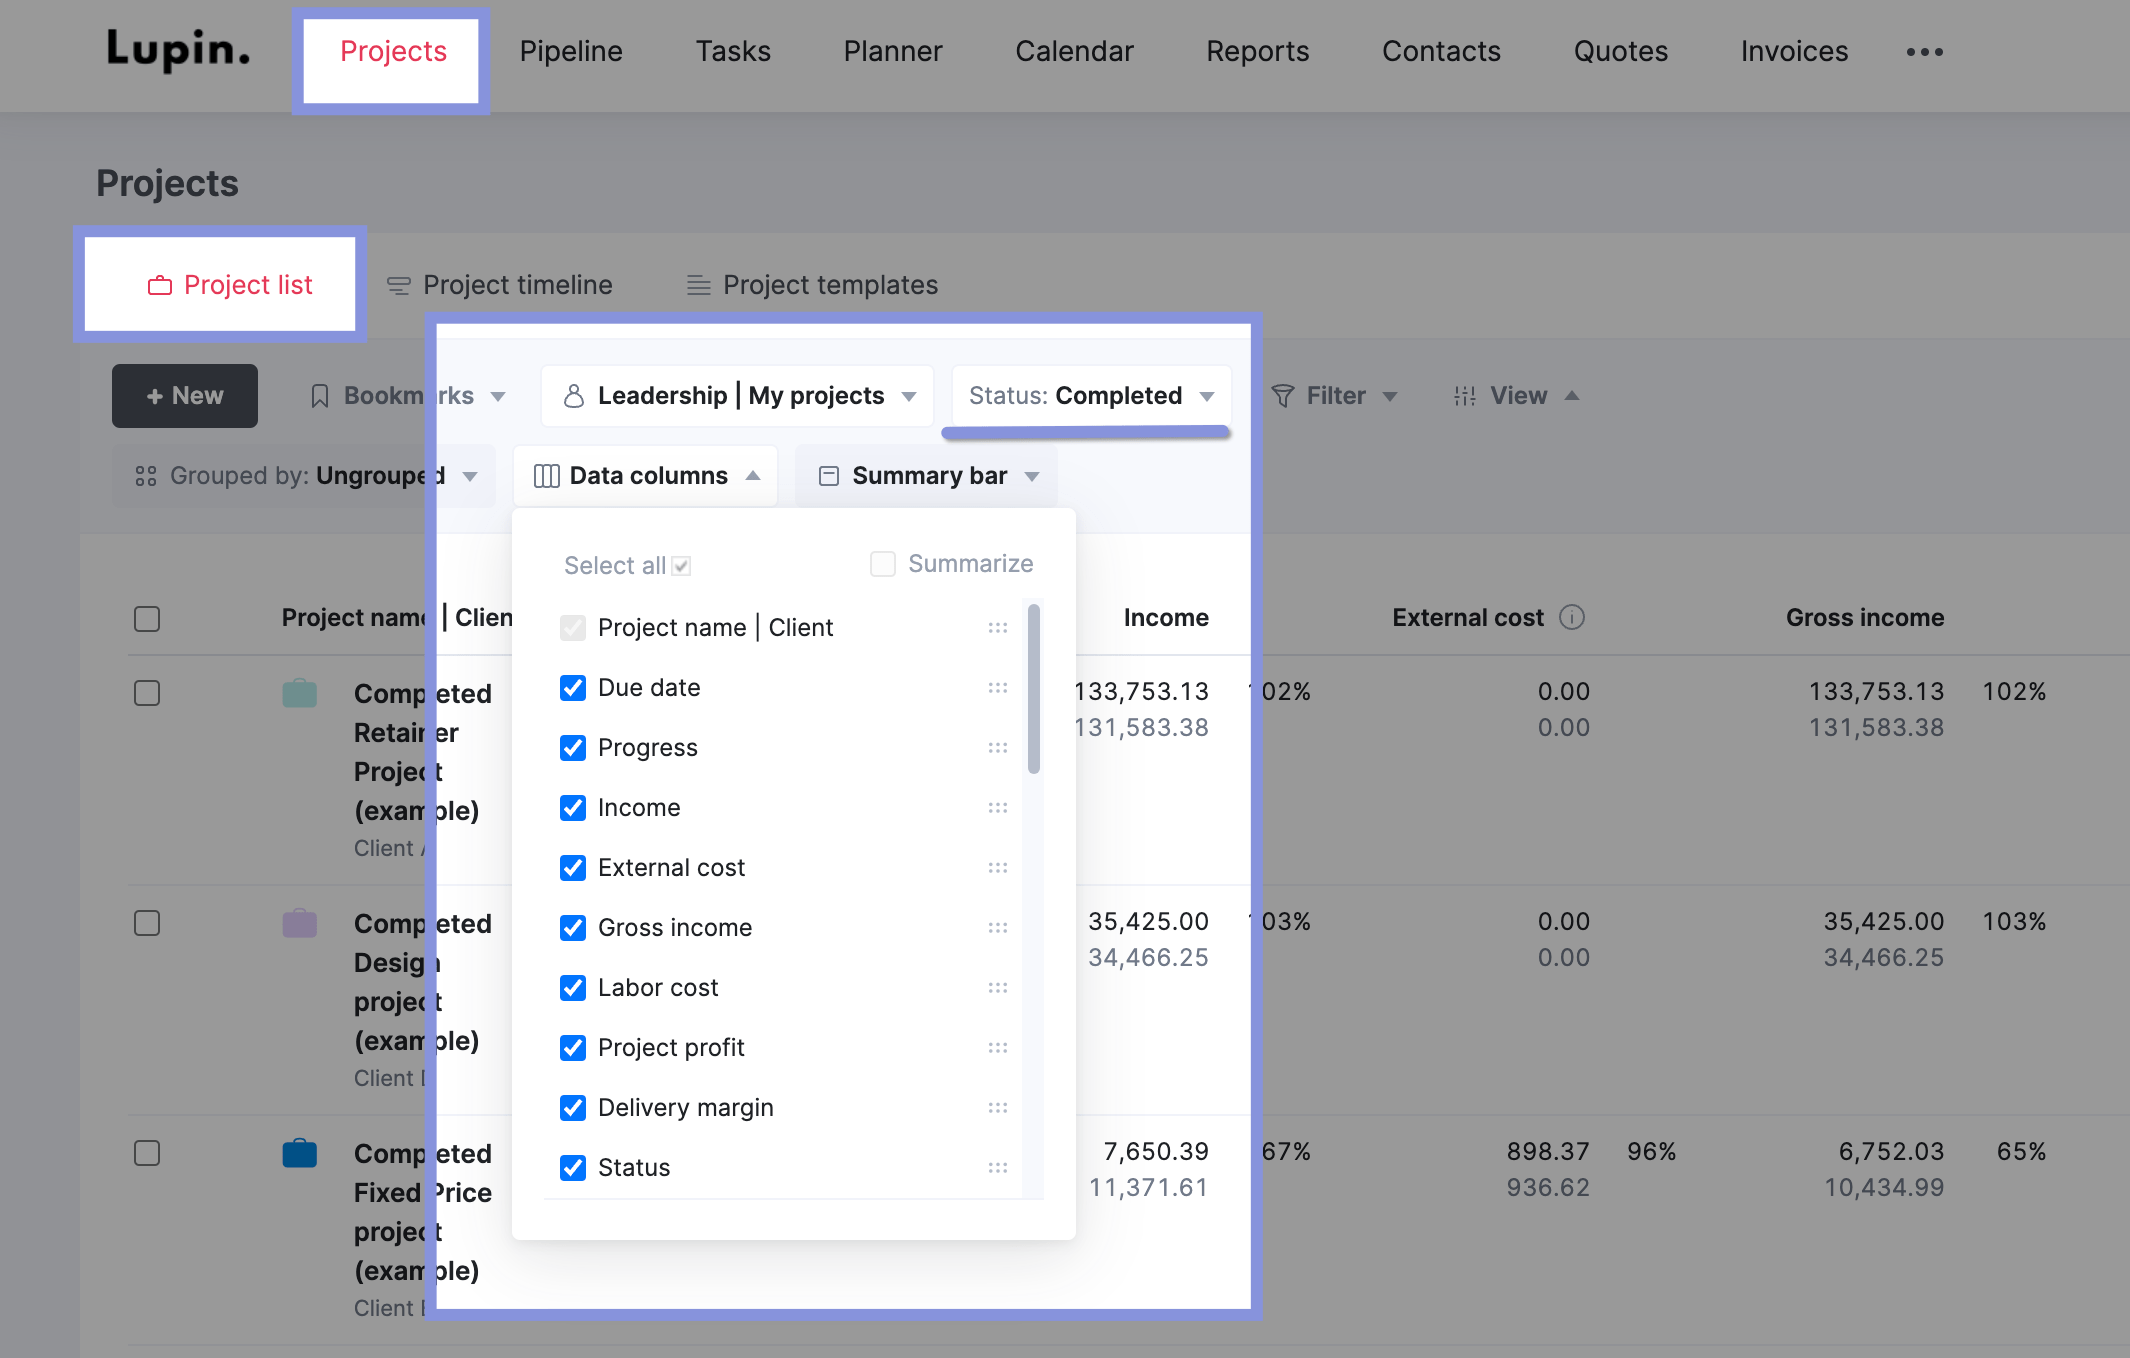
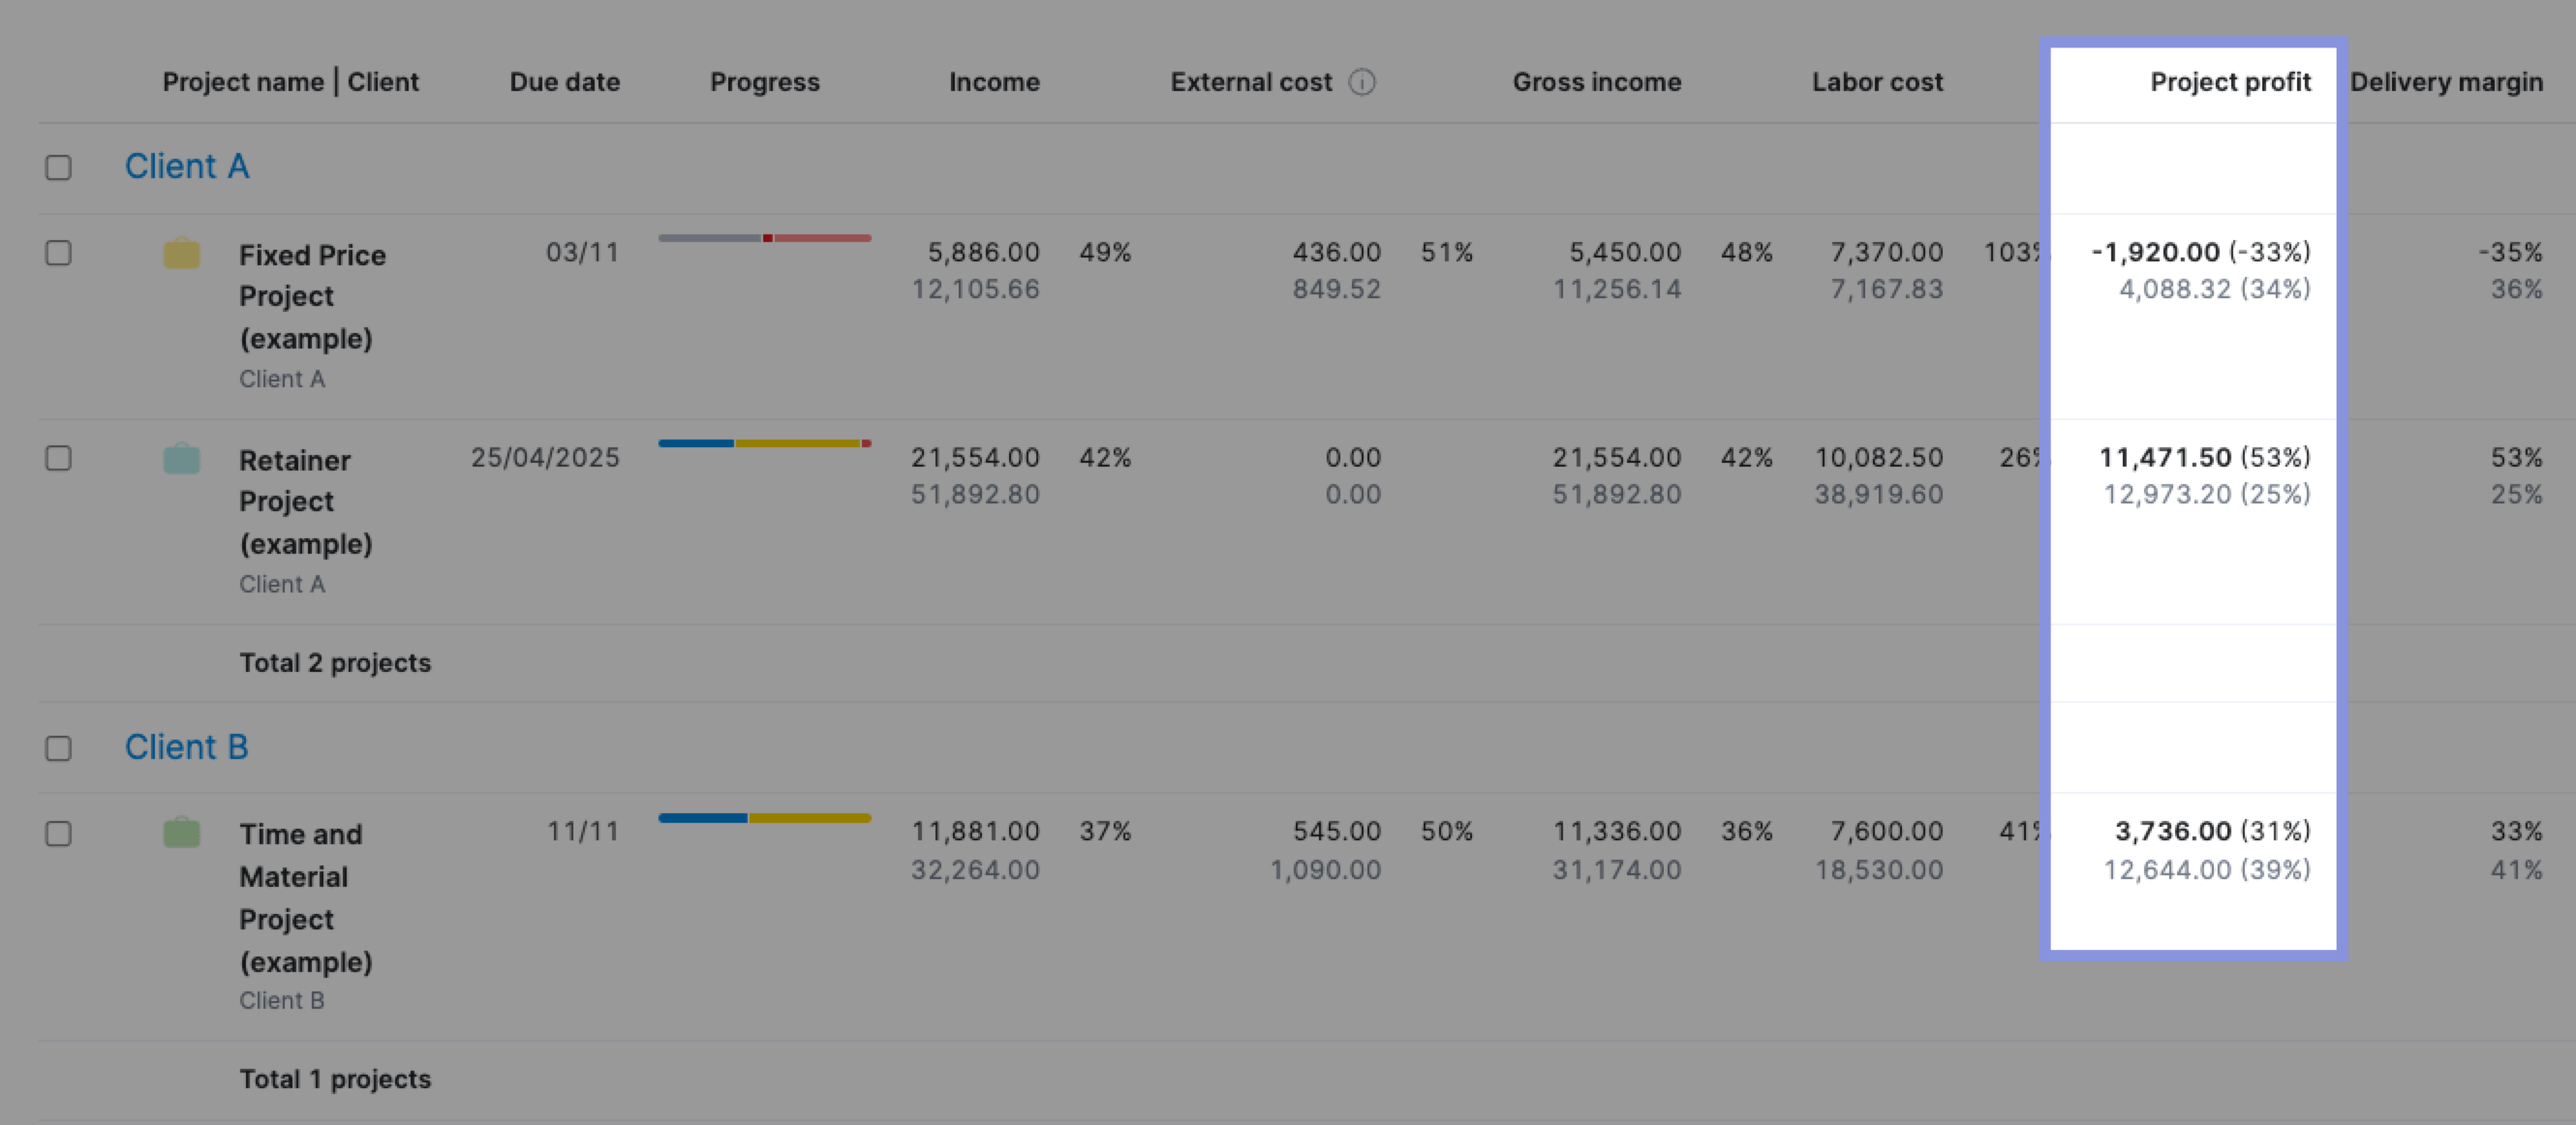
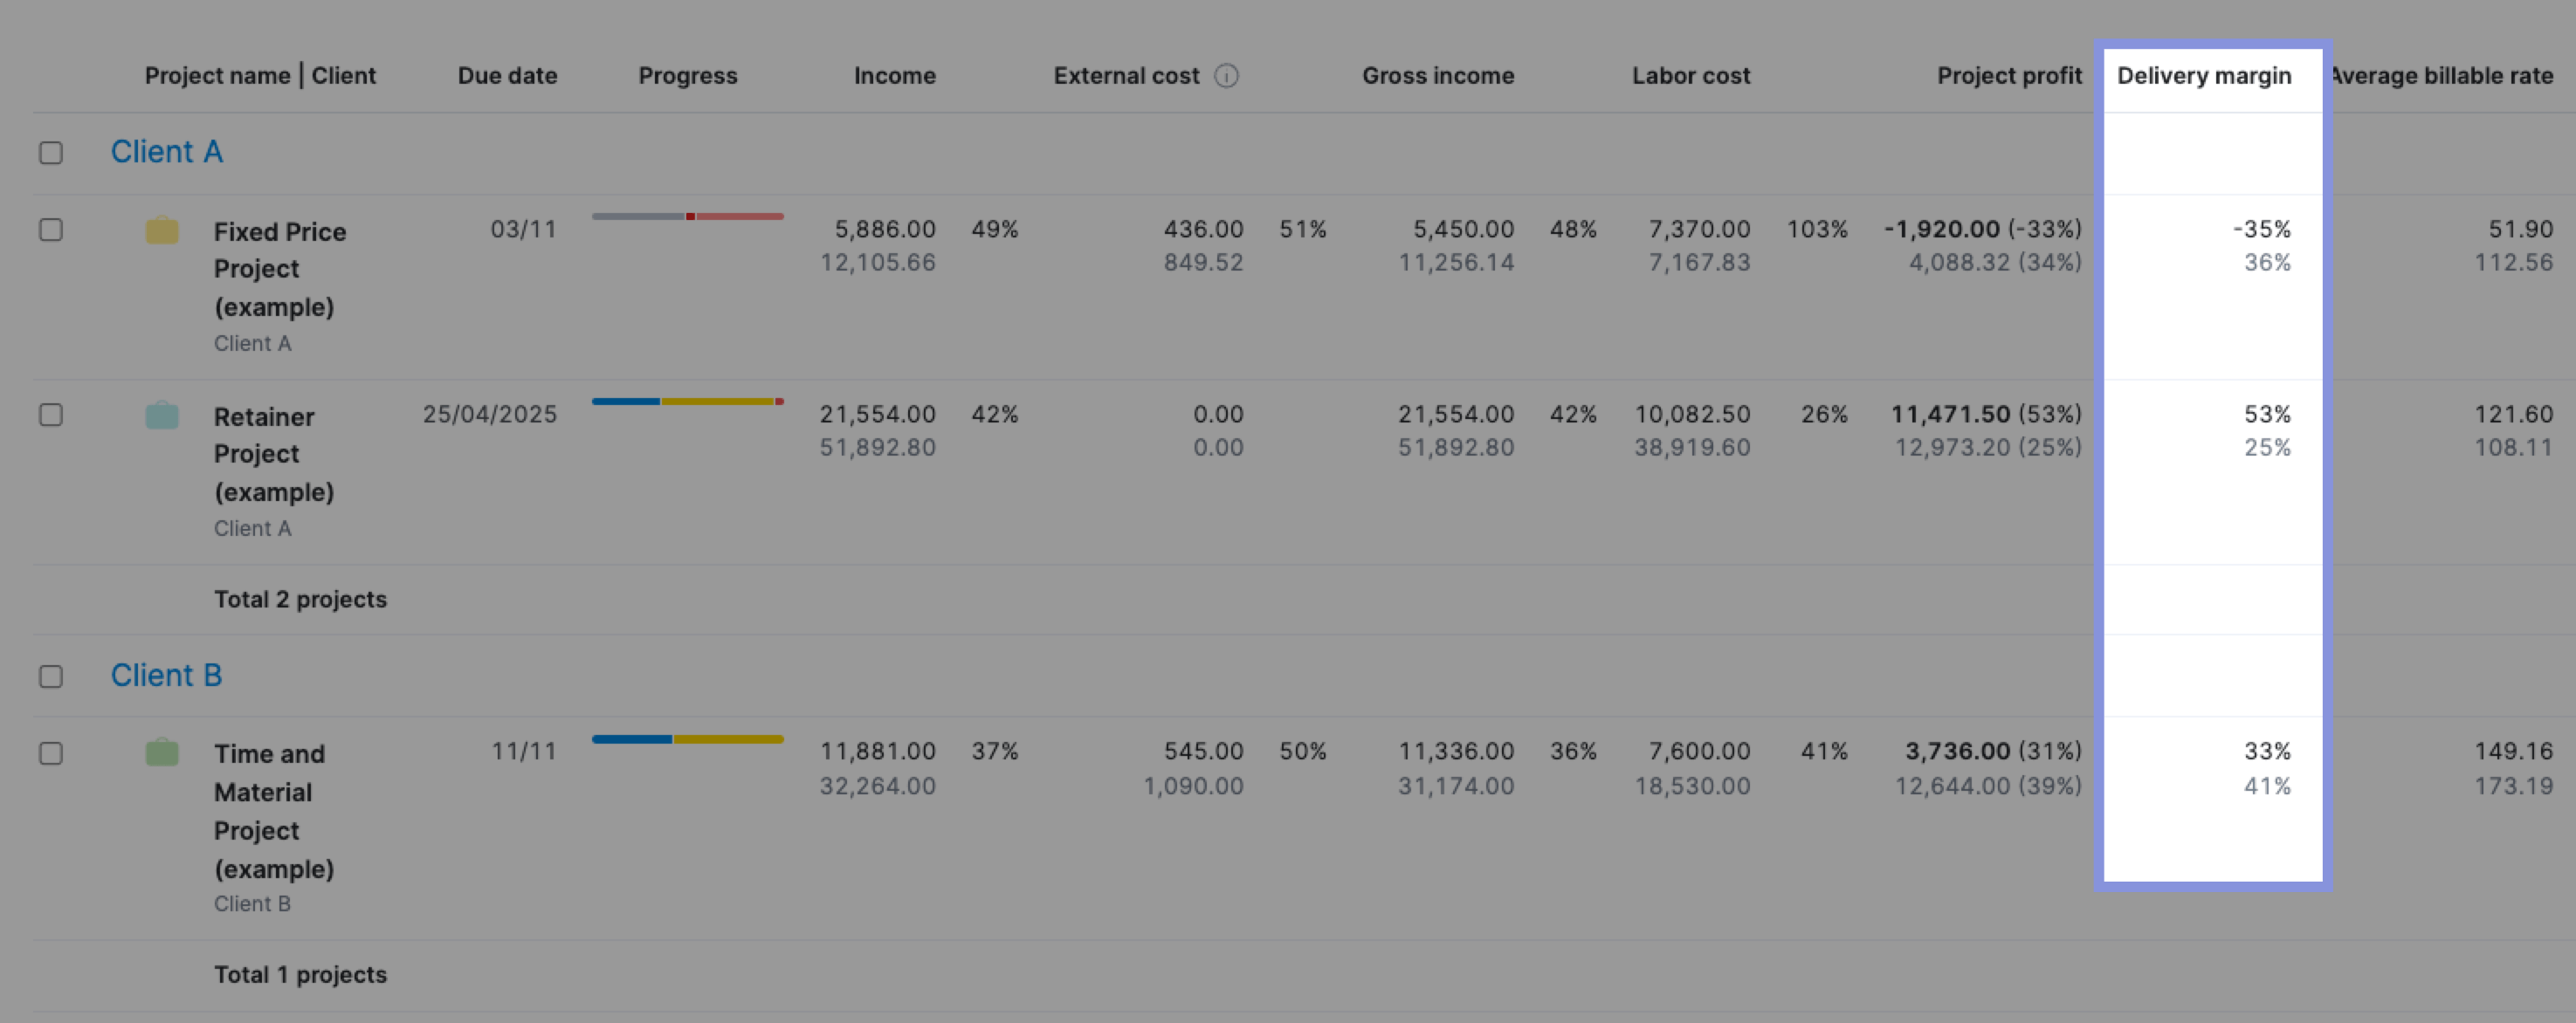
For example, you can use Scoro’s “Project list” view to analyze what types of projects, clients, and services generated the highest margin for your business
To do this, filter out “Completed” projects from the project list view. Ensure the following columns are enabled by clicking “View” followed by “Data columns”:
- “Gross income”
- “Labor cost”
- “External cost”
- “Project profit”
- “Delivery margin”
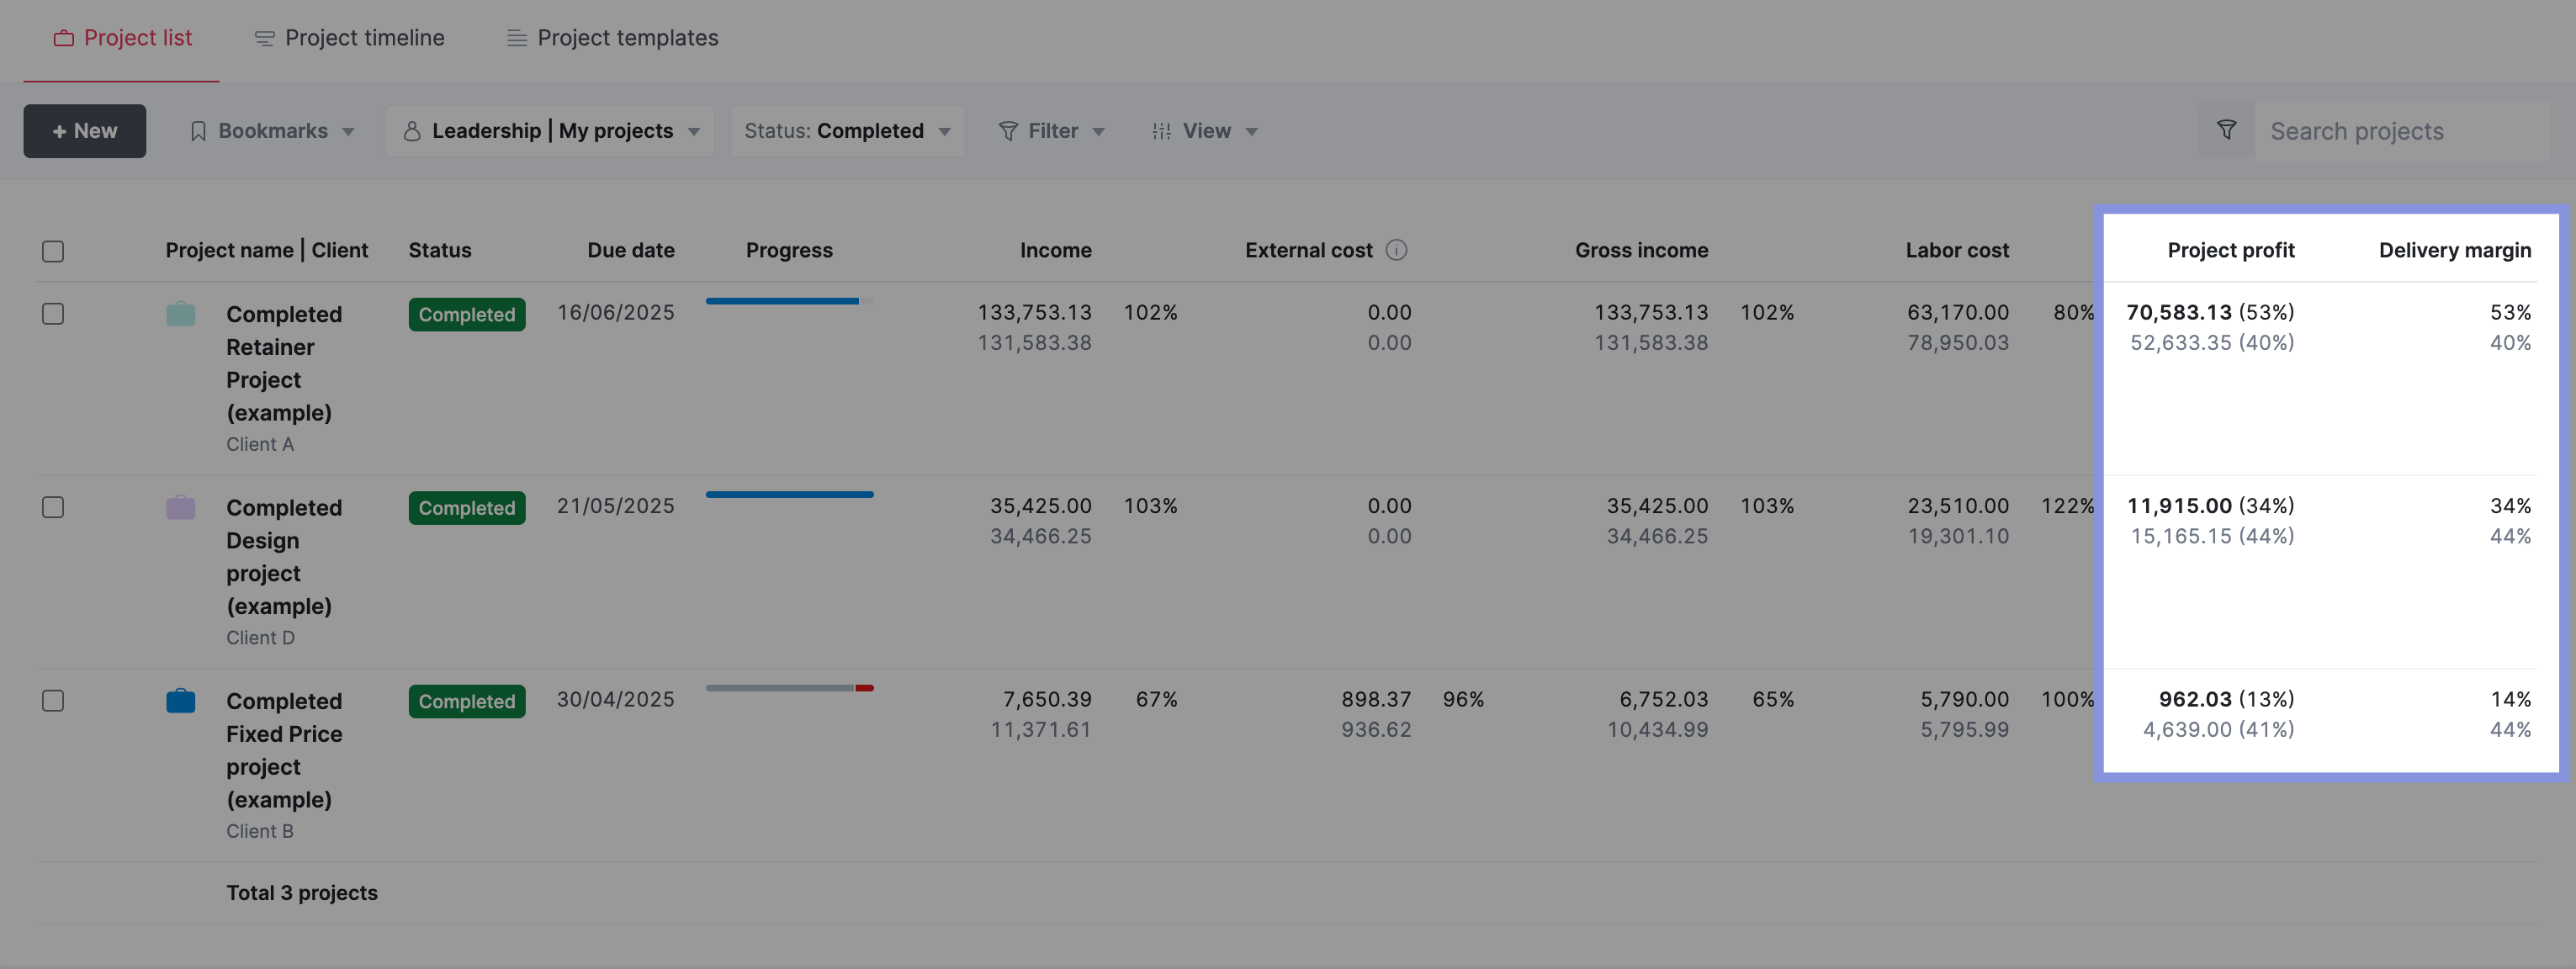
Then, you can sort the data or apply the relevant filters to help you analyze profitability in three ways:
Applying relevant filters helps you analyze profitability in three ways.
By projects:
Sort the list by the “Delivery margin” or “Profit” columns to identify high and low-performing projects.
Look for project types that consistently deliver high margins.
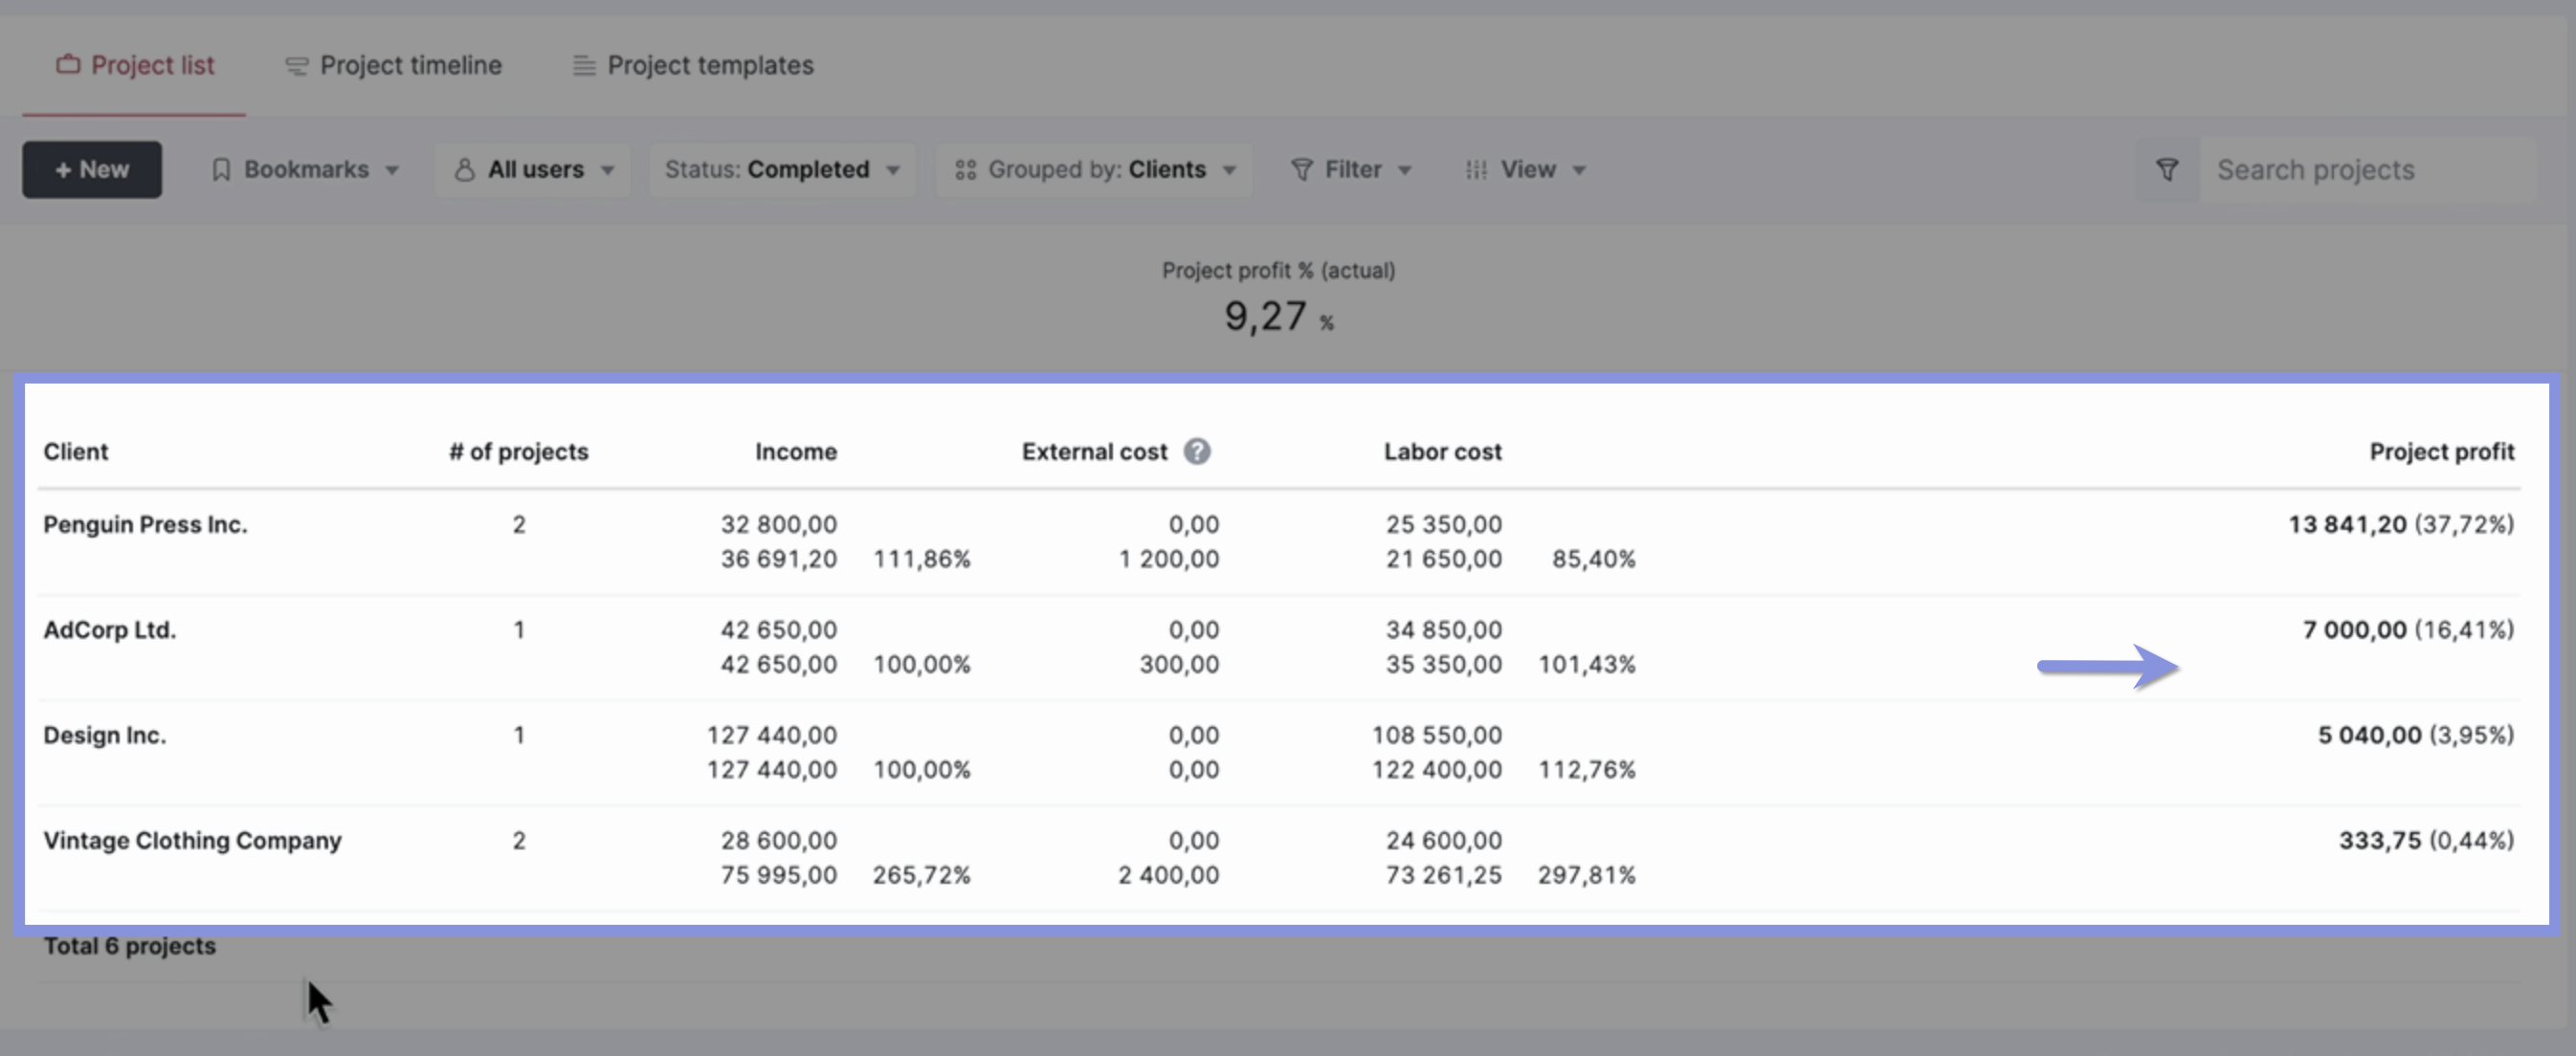
By clients:
Click “Group by” at the top of the list and select “Client.” In the “Data columns” drop-down menu, check “Summarize.” This shows which clients provided the best return on investment.
By services:
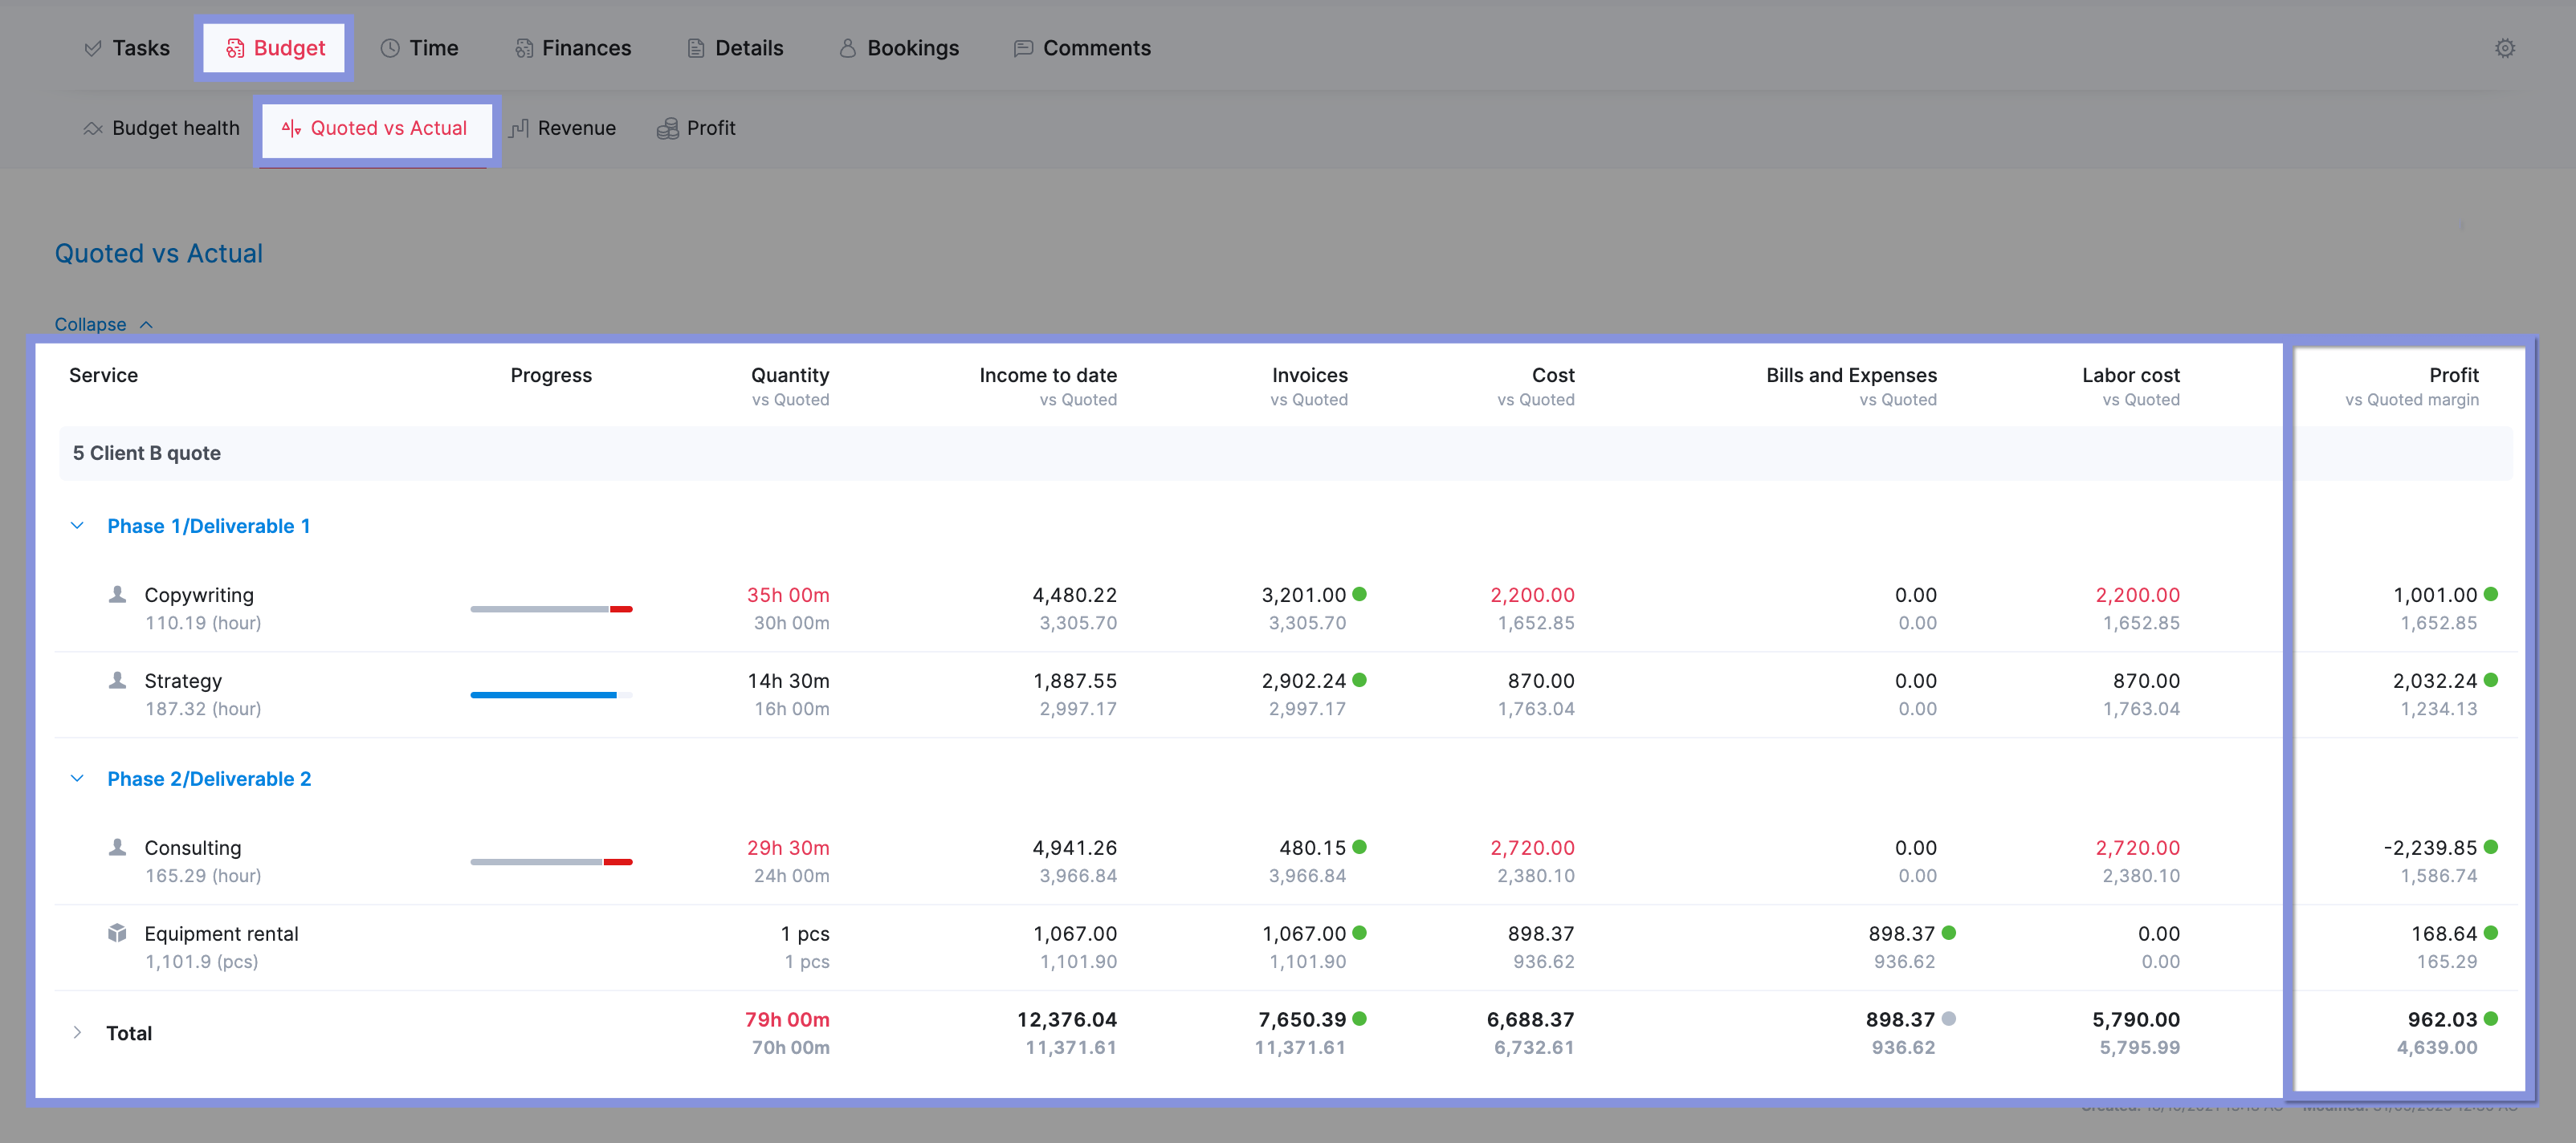
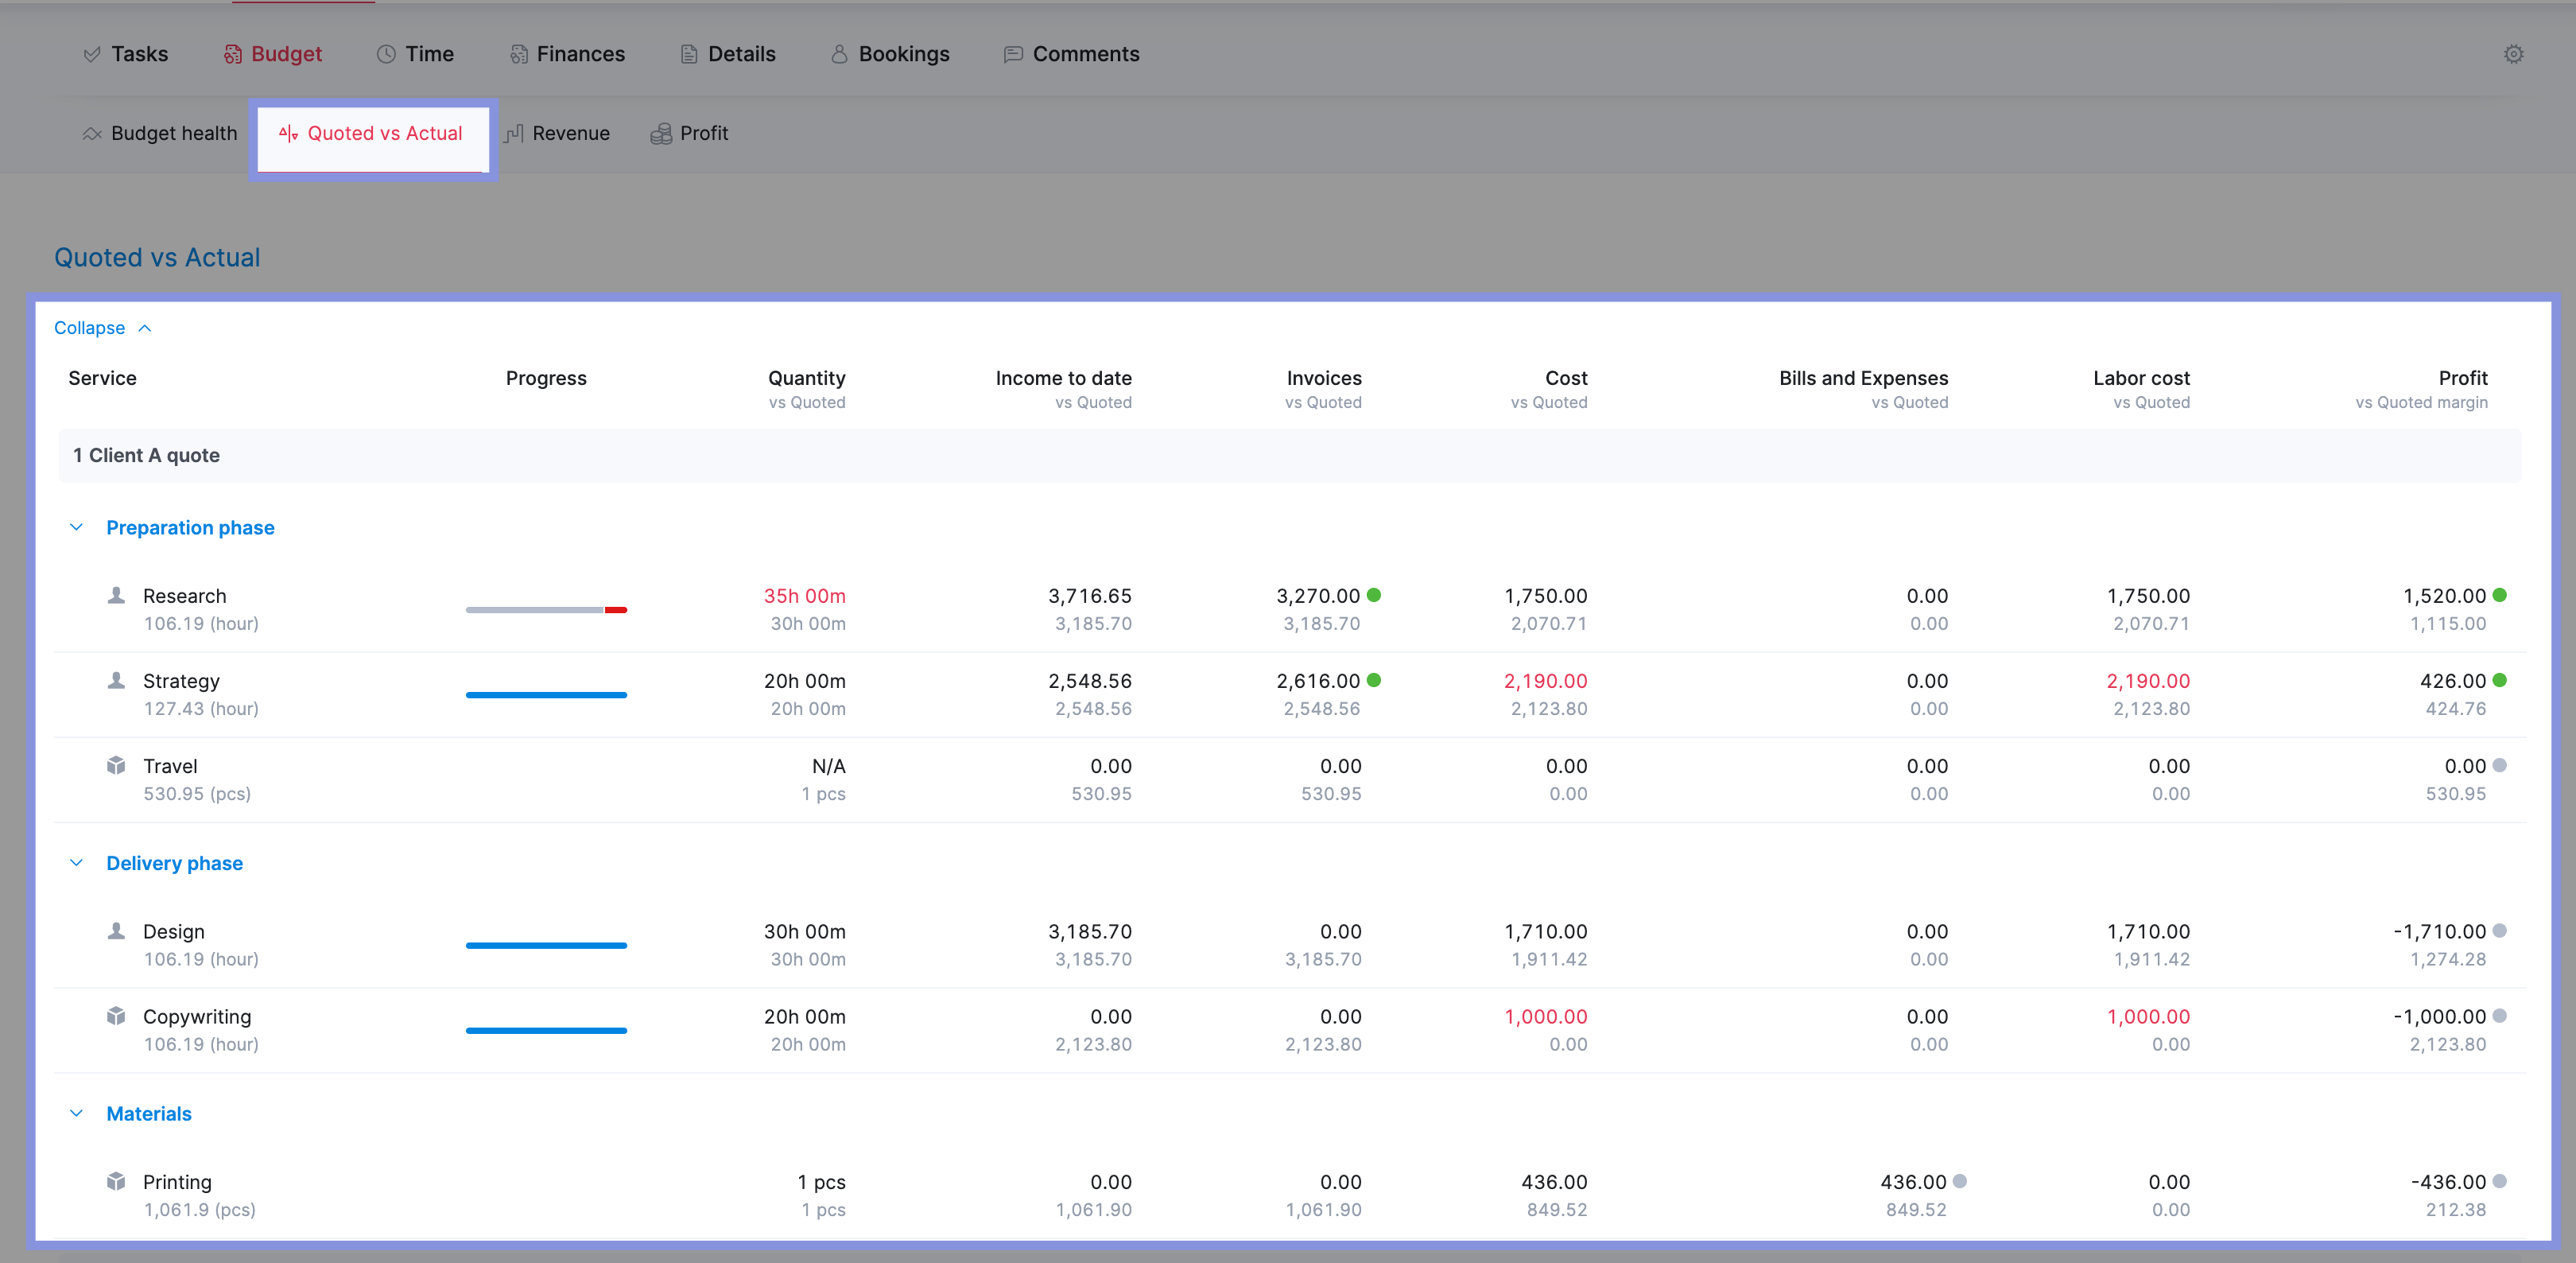
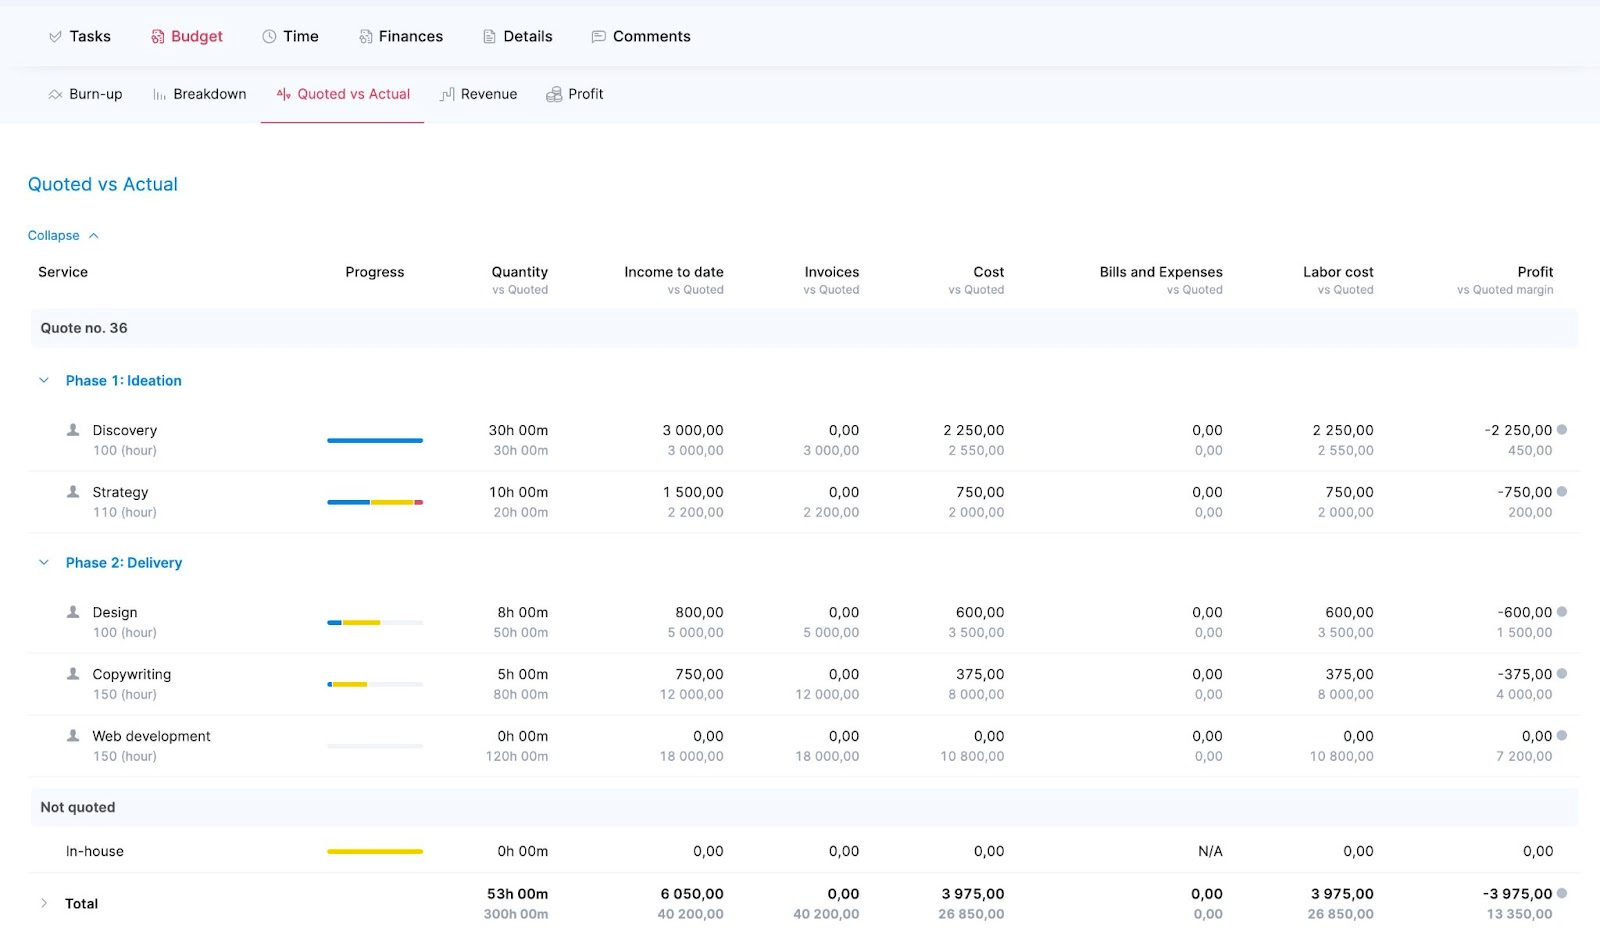
Open a specific project and go to the “Budget” tab. Locate the “Quoted vs. Actual” table to compare estimated and actual figures for each service.
Identify services with high-profit margins and those underperforming for potential repricing.
Step 2. Forecast resource demand for every incoming project
While you can’t totally predict the future when it comes to project needs, you can get pretty close by integrating capacity planning into your daily workflows.
Why?
Because regularly forecasting resource demand for incoming projects gives you a clear idea of how many people you’ll need and when.
So, you can plan ahead and avoid overbooking or underutilizing team members.
Start by listing all confirmed and potential projects in the pipeline. Include their start and end dates, as well the estimate of the total number of hours needed to complete the project.
This gives you a timeline of when you’ll need people. And helps you identify potential bottlenecks.
Top Tip
Look at data from past projects to create an accurate estimation process. Use it as your foundation. And modify as needed.
Next, break down each project into the specific roles and skills needed.
For example, a website redesign project might need a UX designer with wireframing skills, a full-stack developer proficient in JavaScript, and a project manager.
Scoro’s quoting process sets you up for easy, accurate capacity forecasting, using your entered data to create “tentative bookings” for employees.
These are preliminary time allocations for potential projects. They allow you to visualize potential workloads without committing resources and identify potential scheduling conflicts or capacity issues early.
Head to the “Quotes” module and click “New.”
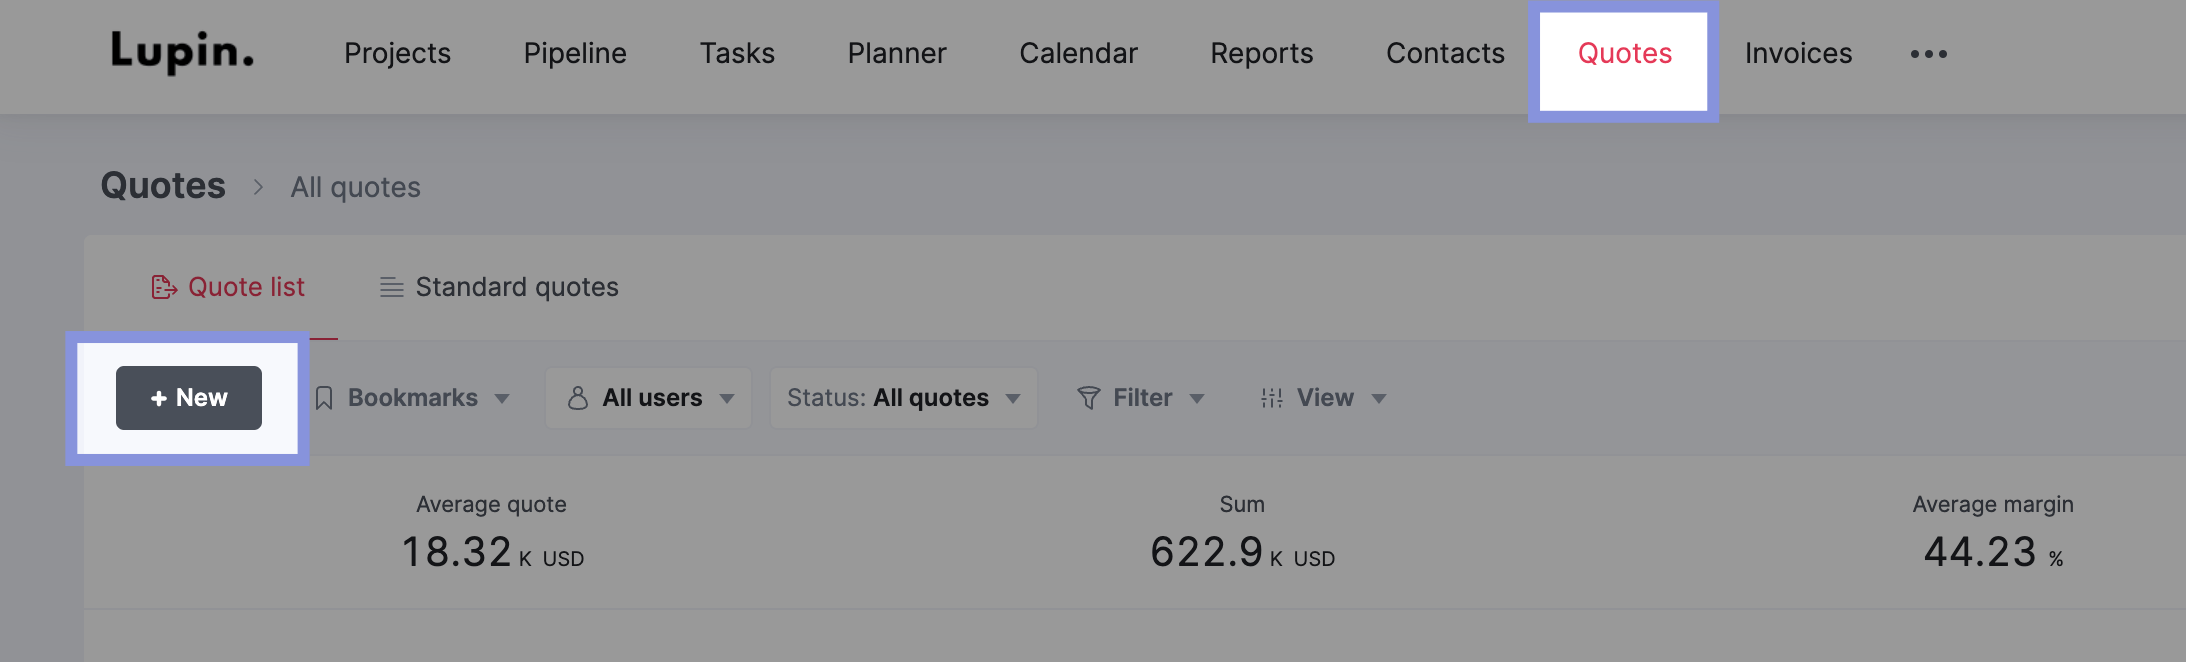
Here, start building your cost estimate and add which roles or specific team members will be needed and the estimated hours for service.
After you save the quote, click “Create project.”
From here, Scoro automatically creates a project team based on the roles or team members listed in the quote. The quoted hours are automatically converted into tentative bookings.
- Green bars represent the overall utilization percentage for each team member or role across all projects.
- Purple bars represent specific bookings for this project. They either show a percentage of time per day or hours per day.
- Solid-colored bars indicate fixed bookings, while striped bars represent tentative bookings
Top Tip
You can learn more about resource bookings in Scoro by checking out our help center article.
Step 3: Assess the team’s current resource capacity
To plan your resources properly, you need a realistic view of your team’s current capacity.
This serves as your baseline for determining what projects you can realistically take on. And when you might need to bring in additional support.
Create a roster of your team members and their roles (e.g., Senior Designer, Junior Developer). Include their contracted hours and note any part-time arrangements.
Then, determine their available hours on a monthly basis by:
- Calculating their contracted hours per month
- Subtracting estimated non-billable time (meetings, admin tasks) based on past data or company averages
- Accounting for planned absences (vacation, sick leave) from your HR system or team calendar
Suppose a developer has a 40-hour workweek. They spend five hours in meetings and have a week of vacation planned for a month.
- Total hours: 40 hours/week * 4 weeks = 160 hours
- Subtract non-billable time: 5 hours/week * 4 weeks = 20 hours
- Subtract vacation: 1 week = 40 hours
Or, if you’ve created tentative bookings in Scoro, you can look at the utilization heatmap to get an initial overview of the potential demand on your team’s time.
The heatmap compares the resource’s total availability in the given period with their bookings across all projects to calculate their utilization.
For example:
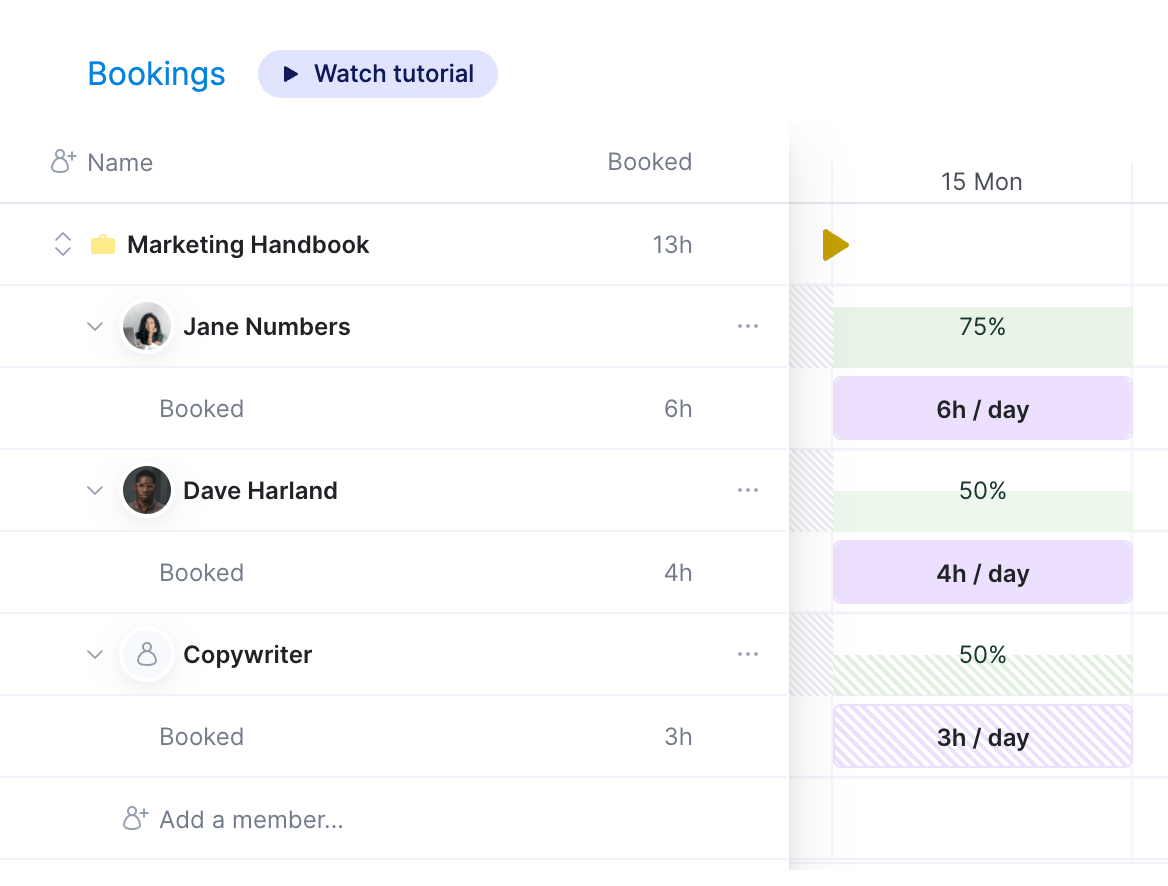
Jane and Dave are Copywriters. Total daily availability for both is 8 hours, which means the maximum total availability for the Copywriter role is 2 x 8 = 16 hours per day.
If Jane already has 6 hours booked and Dave has 4 hours booked, it instantly means the availability of the Copywriter role is now 16 – (6 + 4) = 6 hours.
Now, let’s suppose we also book the Copywriter as a placeholder for 3 hours on Monday. This means the utilization of the Copywriter placeholder on Monday is instantly 50% because the total availability was 6 hours to start with.
The calculation: bookings for the placeholder (3 h) / availability of the role (6 h) = 50%.
You can also check the current availability of the placeholder by clicking on the heatmap.
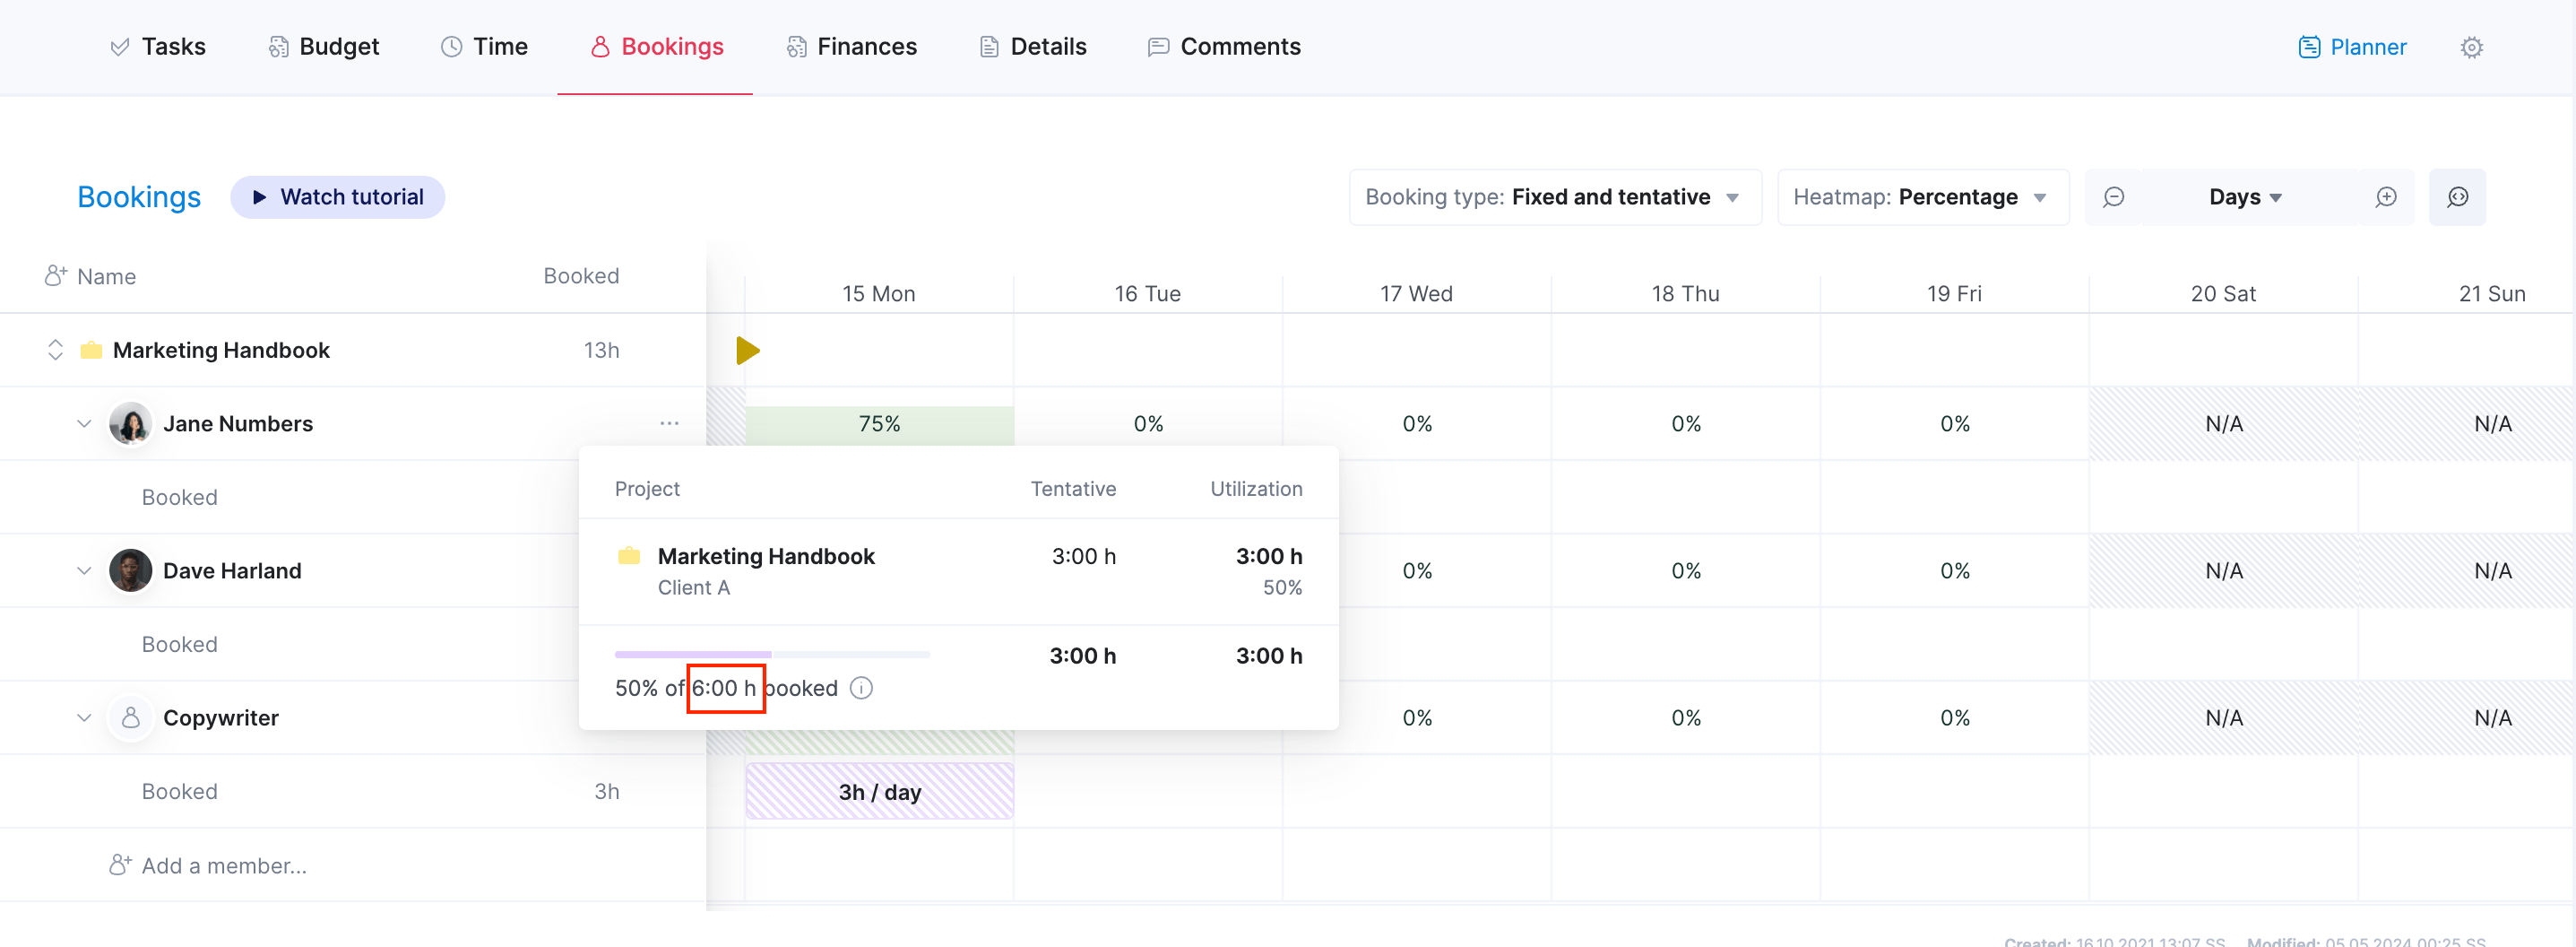
By visualizing resource availability and tentative bookings, you can get an initial overview of your team’s potential workload. At this stage, review the tentative bookings and identify any obvious imbalances or potential issues.
Top Tip
Your team’s available capacity is based on their working availability in Scoro.
To set up new rules or update schedules, search for Availability in the settings search bar or head to Settings > Work and projects > Availability.
Step 4: Evaluate the overall impact on capacity
Once you understand your team’s available hours and the estimated effort required for each project, it’s time to find the sweet spot between these two.
Say your team consists of four members: Sophie, Kevin, John, and Jane. Sophie and Kevin are full-time, while John and Jane are part-time.
After accounting for meetings and vacations, they collectively have 480 available hours next month.
Your project pipeline includes three website development projects:
- Project A: Estimated 200 hours
- Project B: Estimated 150 hours
- Project C: Estimated 250 hours
The total estimated time needed for those projects is 600 hours, which exceeds your team’s capacity by 120 hours. This indicates potential overbooking and the need to adjust.
Consider the following strategies:
- Re-evaluate estimates: Double-check the estimated hours for each project. Are they realistic based on past experience? Could any tasks be streamlined or automated to reduce the required time?
- Manage client expectations: Communicate proactively with clients about potential delays or resource constraints and explore options for adjusting deadlines or project scope.
- Defer non-essential tasks: Identify any non-essential tasks within the projects that can be postponed to a later date without significantly impacting the overall goals.
- Reallocate: Explore the possibility of outsourcing certain tasks or partnering with other teams/departments to share the workload.
Let’s say kevin is already heavily booked on other projects. But Jane and Sophie have some availability.
You decide to:
- Reassign tasks: You identify tasks in Project C that can be delegated to Jane and Sophie, reducing Kevin’s workload.
- Shift deadlines: You discuss the possibility of extending Project C’s deadline by a week with the client, freeing up time to concentrate on other high-priority tasks
For example, in Scoro’s bookings heatmap, you can adjust the daily workload, or change the booking type, by clicking on the booked slot.
This opens up the booking modal, where you can change the details.
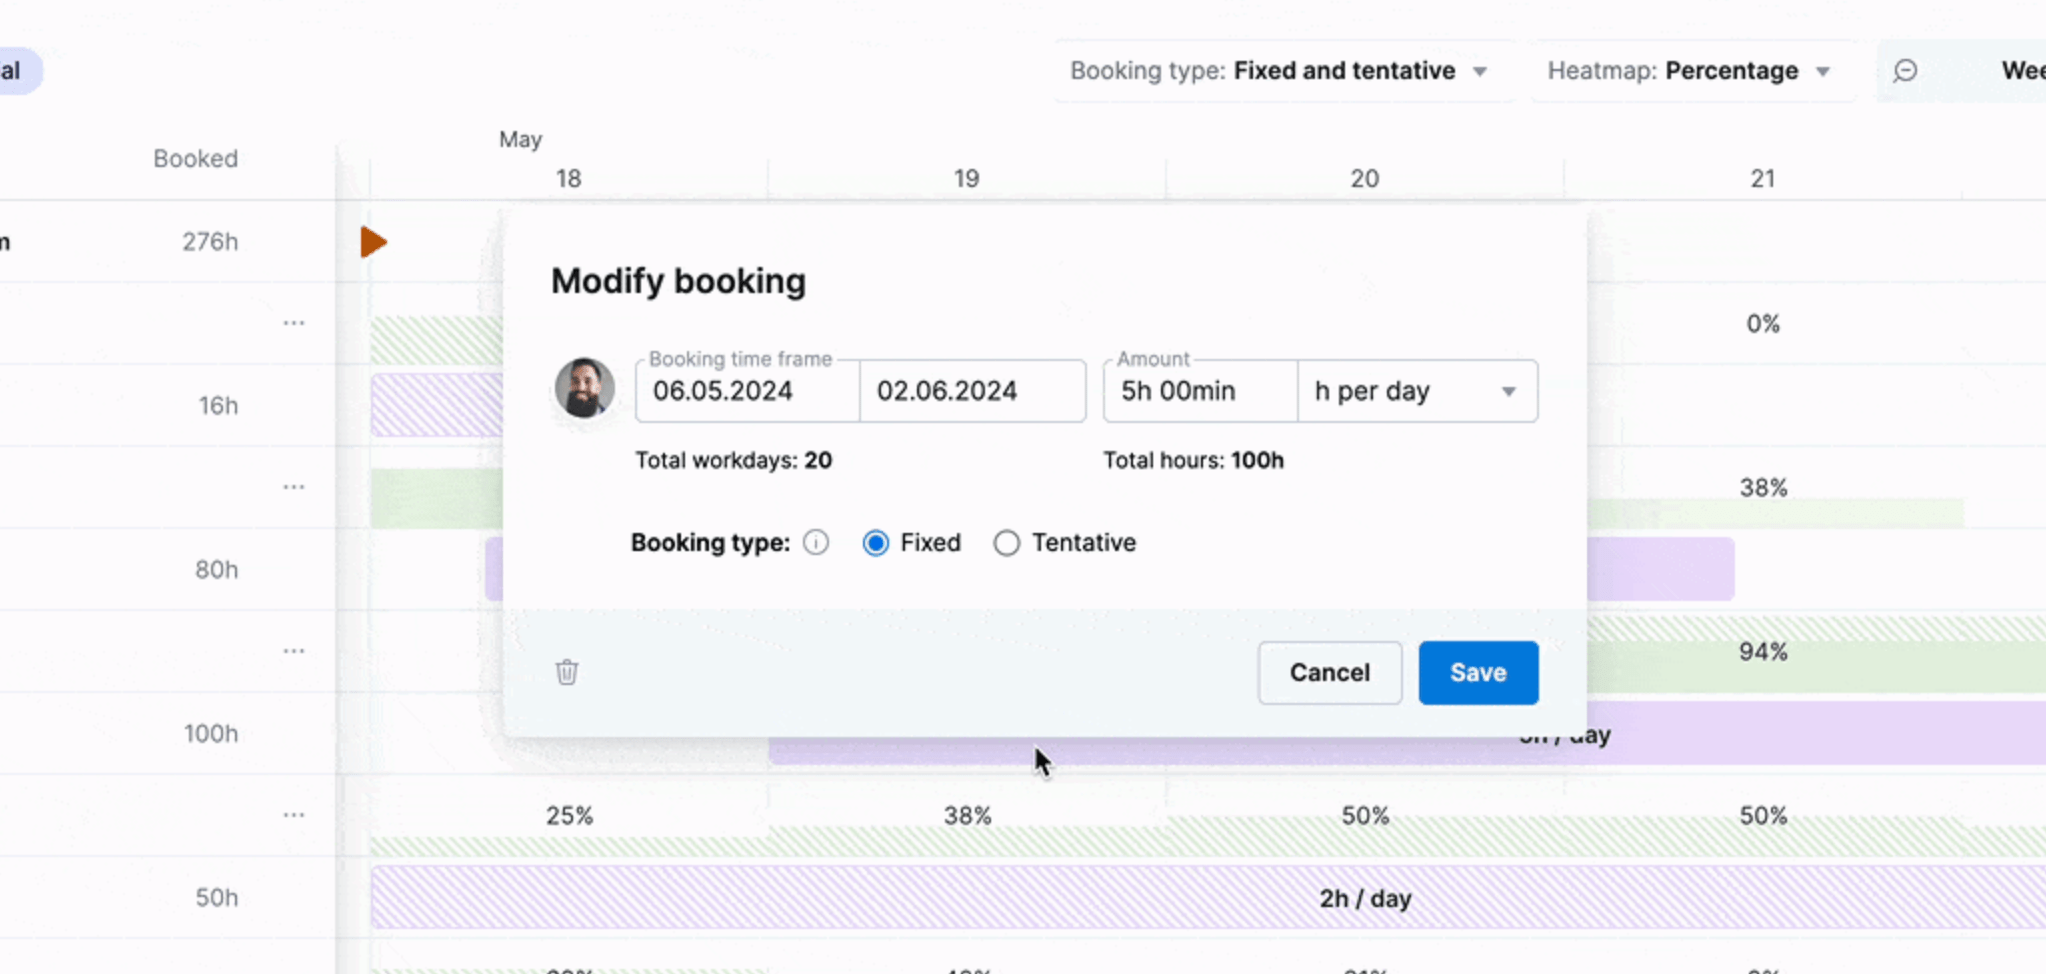
Alternatively, you can adjust the time frame of the booking by simply dragging it.

Step 5: Identify capacity gaps for the following quarters
Once your immediate capacity plan seems set, it’s crucial to assess its long-term viability.
Look ahead at your team’s workload for the coming months to proactively identify and address potential issues before they derail your projects.
You can do this by using the “Utilization report” in Scoro. Go to the “Reports” module and click on “Utilization report.”
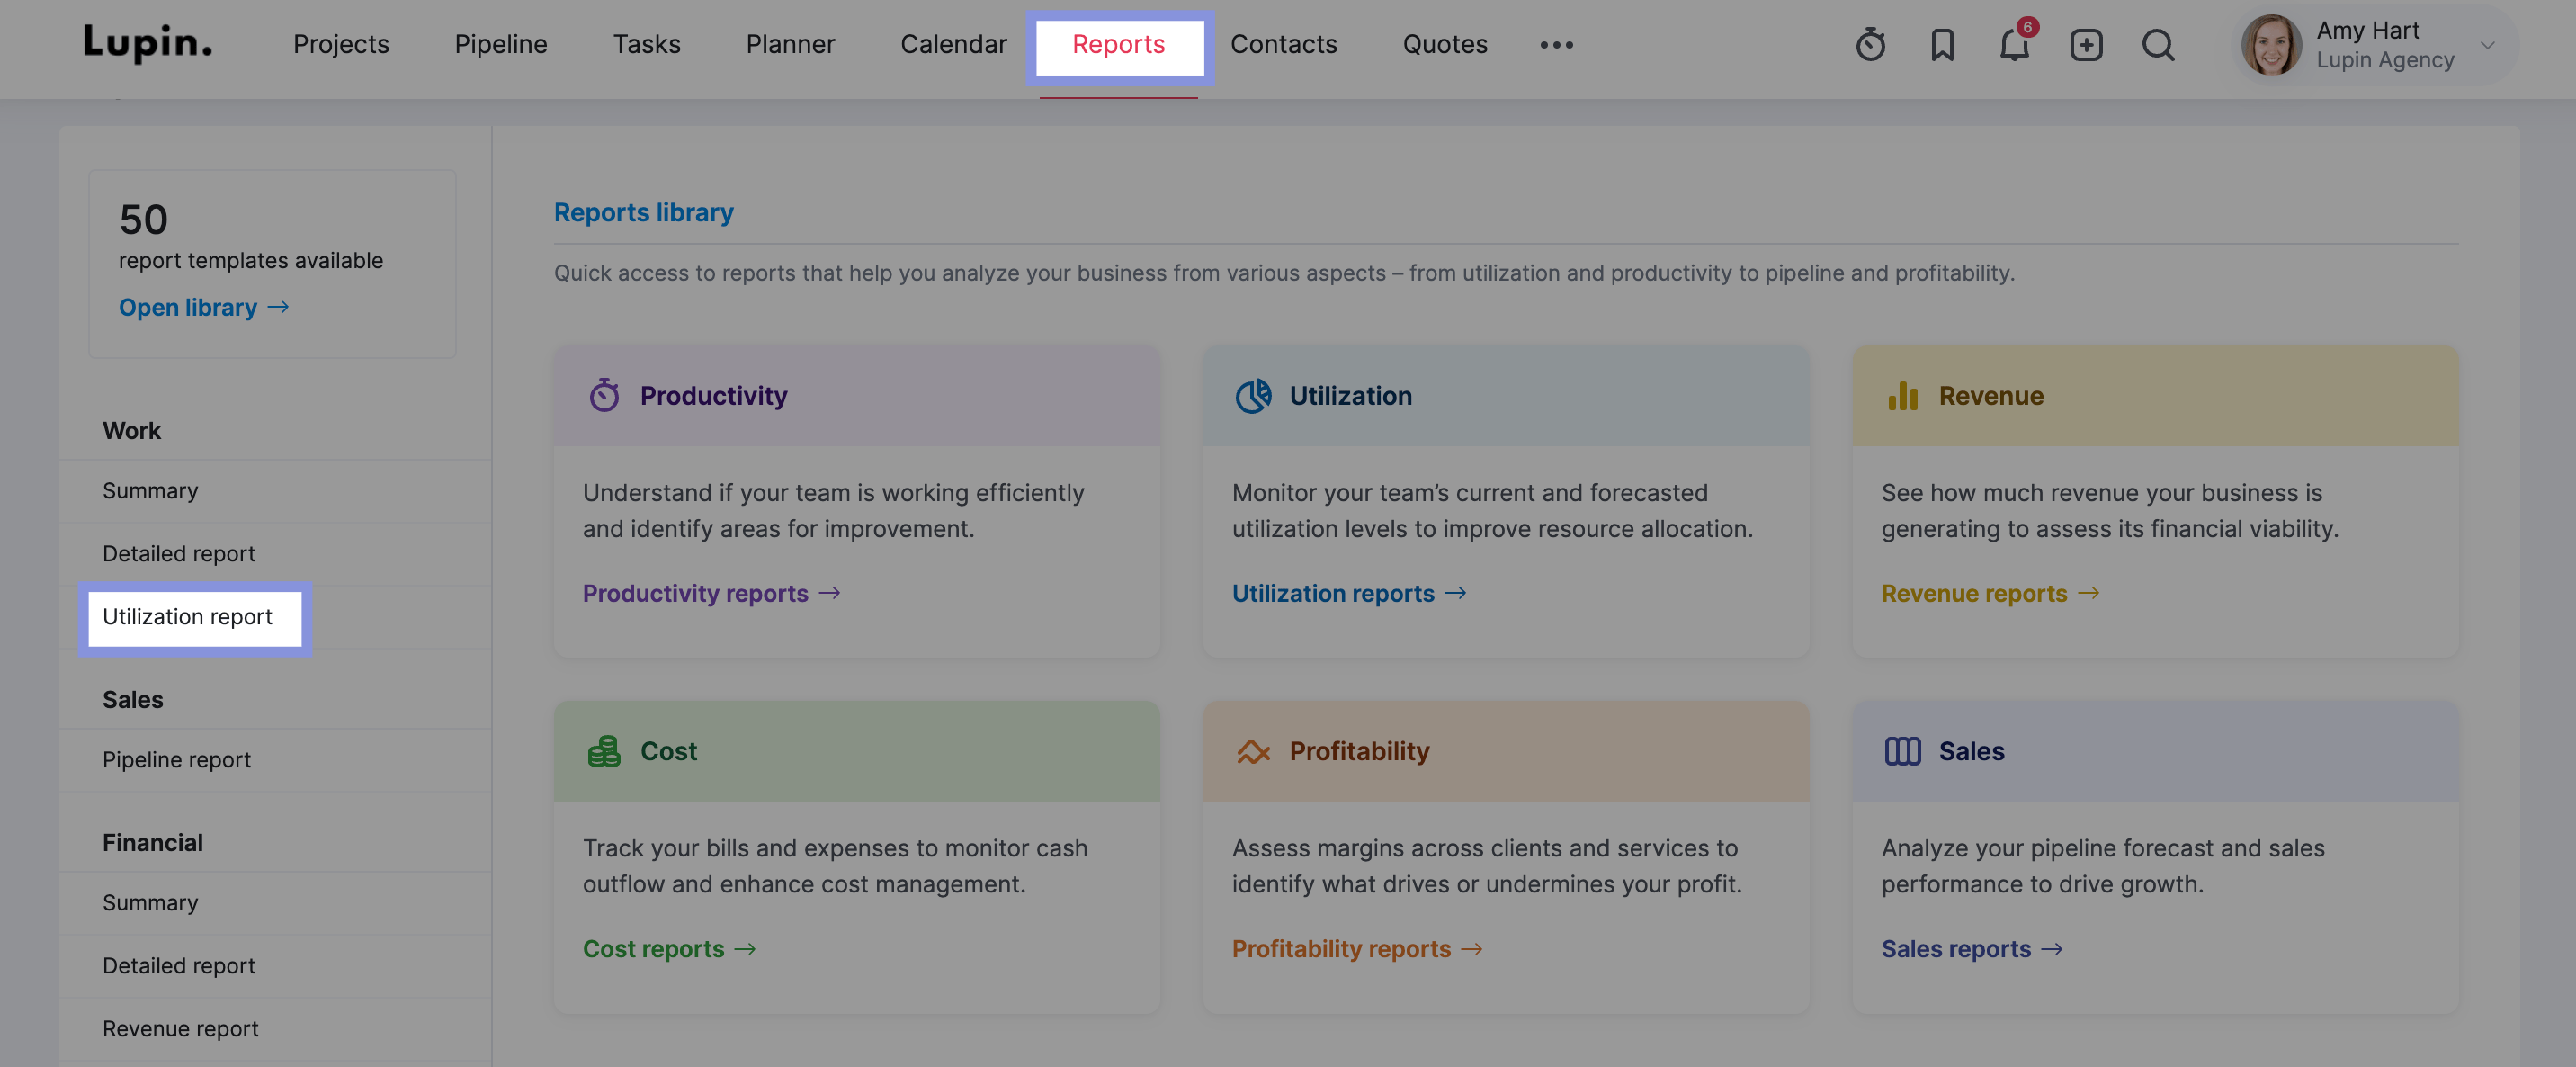
Then, adjust the the report to cover the next quarter or a custom period you want to analyze. This gives you a broader perspective on your team’s workload over time.
Timeframes include the next 7, 14, 30, 90 or 36d days.
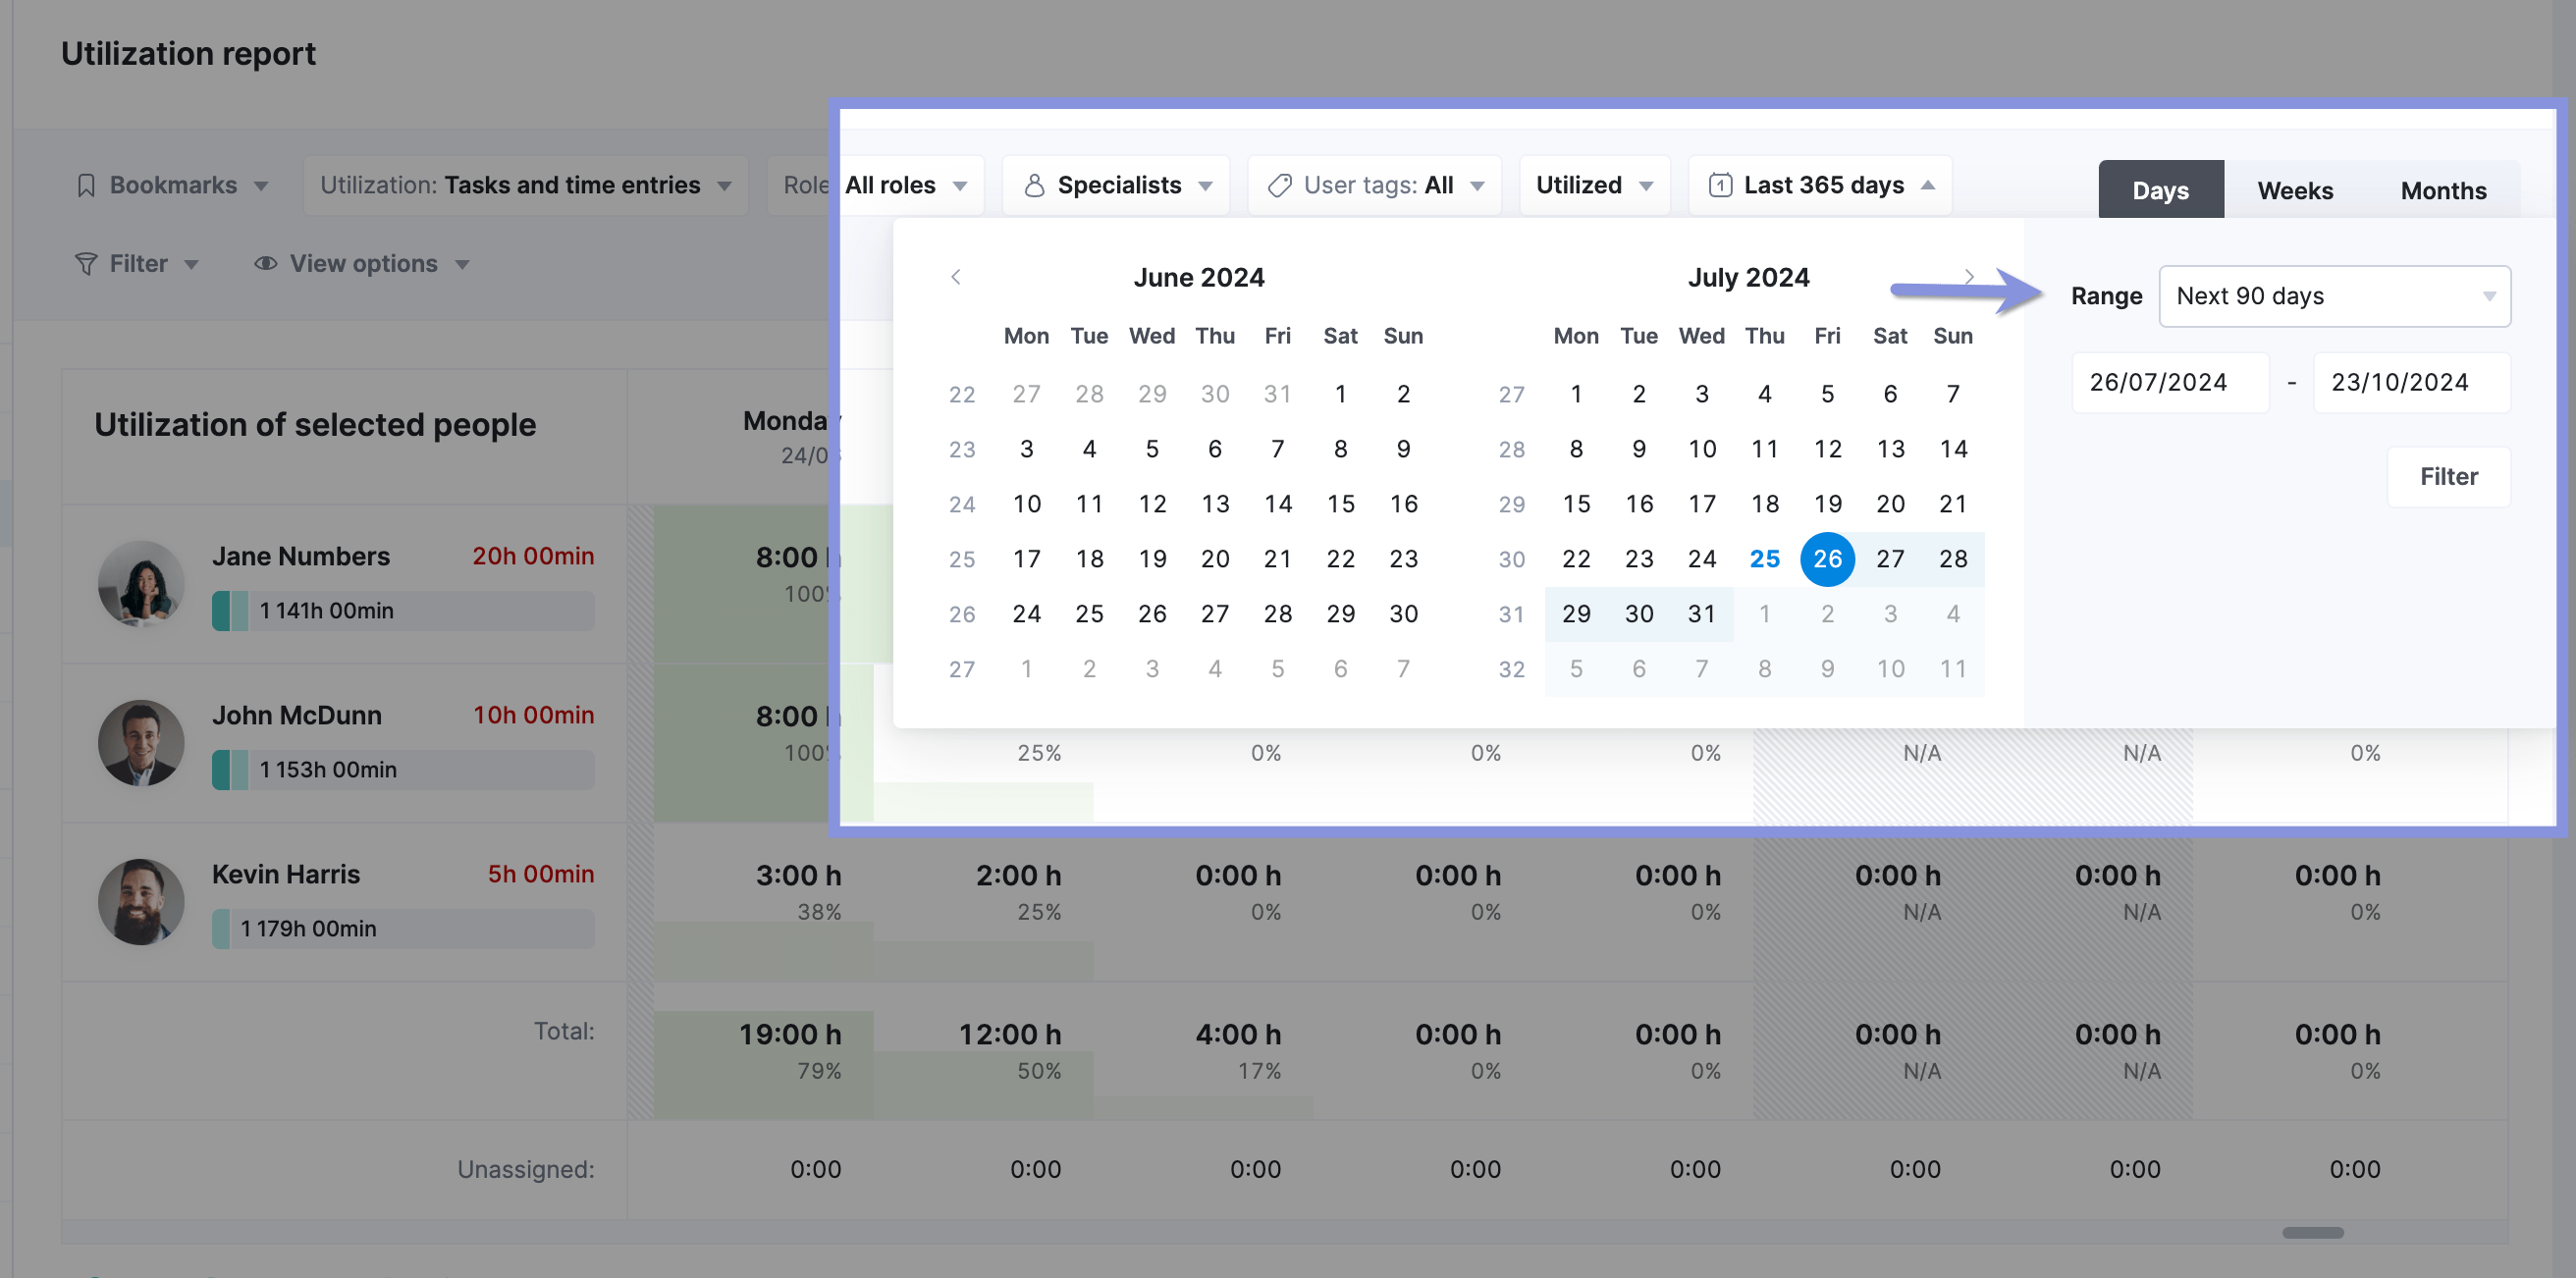
You can then get a good sense of your team’s capacity for the upcoming months.
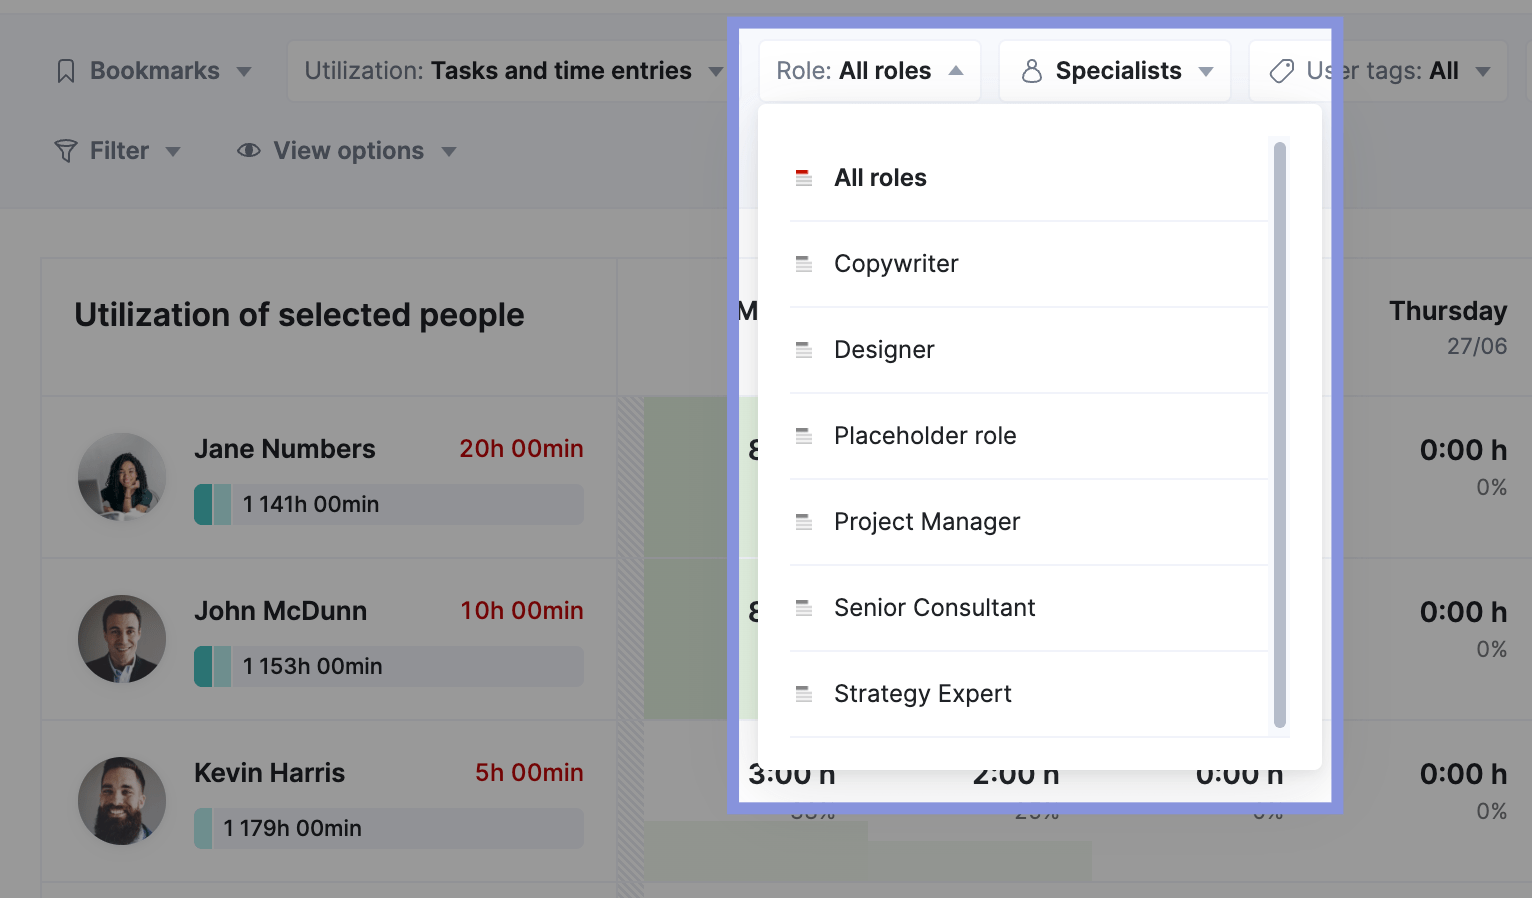
You can also filter the report by role by clicking the “All roles” tab and then a specific role to pinpoint specific areas where you might face resource constraints or skill gaps.
Furthering Reading: Employee Utilization Reports 101: Your Ultimate Guide
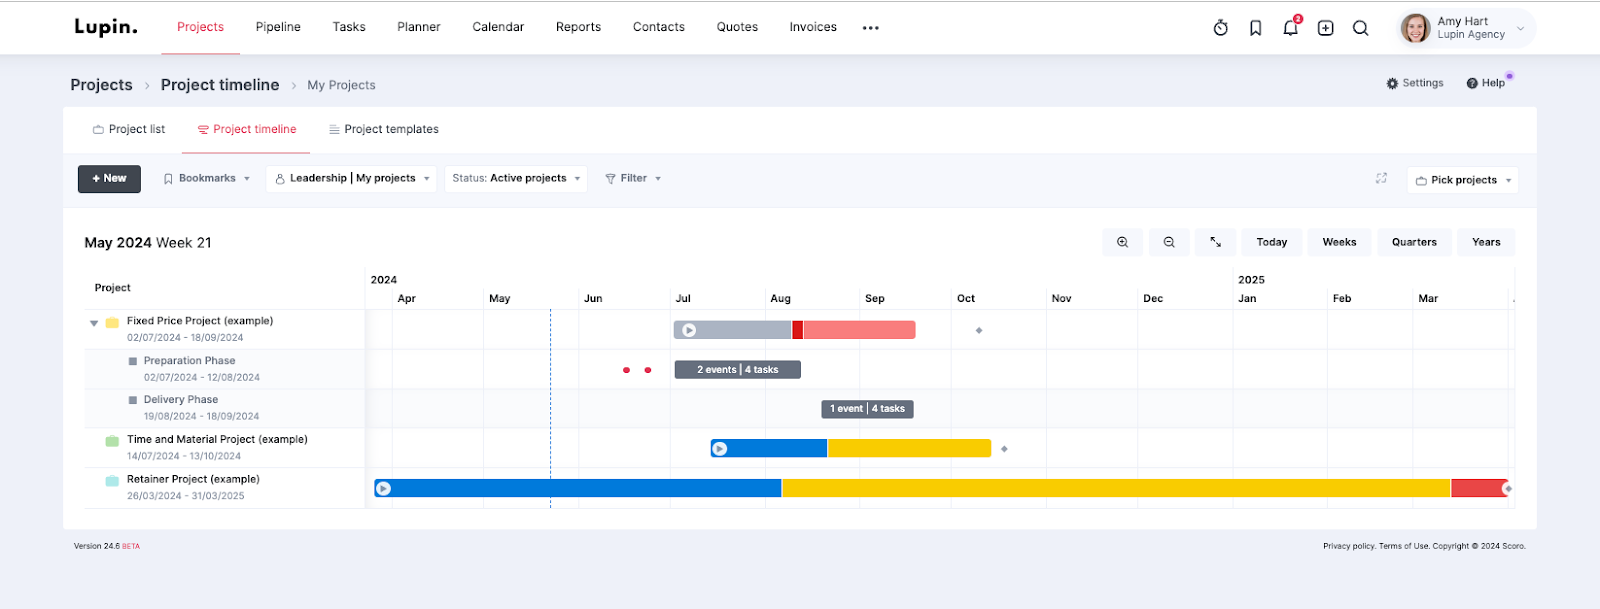
Scoro’s “Project timeline” view gives you another clear way to visualize your project timelines and avoid potential resource conflicts:
- Yellow bars represent future work that hasn’t started yet, allowing you to see upcoming project demands
- Gray bars indicate work currently in progress
- Blue bars show completed phases, giving you a sense of project history and progress
- Red bars highlight where multiple projects overlap in time—warning signs of potential bottlenecks
Build a strong foundation for successful projects with capacity planning
Capacity planning is key to delivering projects on time and within budget, preventing burnout, and keeping your team engaged. It makes adjusting project timelines, distributing workloads, and ensuring your team has the bandwidth to deliver high-quality work easier.
But capacity planning is only the first step in the resource management puzzle. Next, you need to master resource planning.
Check out our resource planning guide to learn how to improve your staffing choices and balance required expertise with labor costs to keep clients and your company happy.
In this guide, we’ll explain project return on investment (ROI), and you’ll discover a more accurate way to measure project profitability than simple ROI calculations.
What is project ROI?
Project ROI measures a project’s true profitability by comparing its revenue to its cost to deliver.
It answers the question: “For every dollar we invested, how much did we earn back?”
You calculate project ROI using this formula:
(Project Revenue – Project Costs) / Project Costs x 100 = Project ROI %
See how it factors in both revenue and costs?
If you just look at revenue, you’re not factoring in how much you actually have to spend to earn that revenue, which can lead to taking on projects that hurt your bottom line with a low or negative ROI instead of helping it.
What project costs should you consider?
Project costs include all expenses directly associated with the project. These can be categorized as:
Direct Costs:
- Labor Costs: Salaries, wages, benefits, and any payroll taxes associated with the project team members directly involved in project execution.
External Costs:
- Supplier Bills/Invoices: Payments to external vendors or contractors for services or goods provided specifically for the project.
- Project Expenses: Out-of-pocket expenses incurred by the project team, including items such as Equipment rentals or purchases, travel costs (flights, accommodation, meals, transportation), software or subscription fees
Types of project ROI
There are four main types of project ROI:
- Anticipated/Expected ROI: The ROI you predict based on estimated revenue and costs during project planning.
- Actual ROI: The real ROI is calculated using the final revenue and cost numbers after completing the project.
- Positive ROI: A positive project ROI is the ultimate goal for any project. It signifies that the project generated more revenue than it cost, resulting in a net profit.
- Negative ROI: A negative project ROI indicates that a project’s costs exceeded its revenue, resulting in a financial loss.
Positive ROI Example
A marketing agency just completed a $200,000 website redesign project.
Here’s how the project financials break down:
- Revenue: $200,000
- Costs: $125,000 (labor, software licenses, stock imagery, etc.)
Now, let’s plug those numbers into the ROI formula:
($200,000 – $125,000) / $125,000 x 100 = 60%
The 60% ROI represents the return on investment for this project. This means that the agency earned an additional 60 cents in profit for every dollar invested in the project.
Negative ROI Example
A consulting agency just finished a $100,000 strategy project.
Here’s what the organization made—and what they spent:
- Revenue: $100,000
- Costs: $130,000 (labor, software licenses, stock imagery, etc.)
Now, let’s run the ROI calculation:
($100,000 – $130,000) / $130,000 x 100 = -23.08%
A -23% ROI means the agency lost almost a quarter of its investment in the project.
A cost breakdown can reveal areas for improvement to ensure future projects deliver a positive ROI. Analyzing consultant rates, exploring alternative research methods, or refining project scoping processes could be part of this analysis.
The benefits of calculating project ROI
Knowing your project ROI helps you:
Determine which projects and clients to take on (or avoid)
High ROI projects with low-maintenance clients are ideal. Project ROI analysis helps you identify these projects and their associated clients. This allows you to prioritize attracting clients who bring profitable projects and avoid those that drain resources without a strong return.
Improve your pricing
Low prices can lead to projects costing more than they bring in, resulting in financial losses. However, charging too high can cause you to lose work to competitors with lower rates.
So, what do you do?
Look at the ROI on past projects. This will help you find the pricing sweet spot that maintains both your profit margins and competitive edge.
For example, analyzing project ROI data might reveal that projects with X type of deliverable consistently yield a higher ROI, leading you to adjust your pricing model to prioritize those high-value services.
Optimize your spending
Project ROI analysis helps you identify which parts of your project are the most profitable and which are not. By analyzing your project data, you can pinpoint the tasks or activities that consistently lead to higher profits. These areas are where investing more resources will likely yield the greatest ROI.
Delivery margin: a deeper dive into project profitability
While project ROI gives you a broad overview of a project’s financial success, delivery margin, on the other hand, focuses on the profitability of your team’s work.
It measures the profit generated from your labor after covering your direct costs (like salaries and software), excluding any costs passed through to the client (like subcontractor fees).
The formula is:
(Gross Revenue – Delivery Costs) / Gross Revenue x 100 = Delivery Margin %
Project ROI vs delivery margin: which is more important?
Both Project ROI and delivery margin offer valuable insights, but their focus differs:
- Project ROI is a broader measure of overall project success, reflecting the project’s profitability as a whole.
- Delivery Margin zooms in on your team’s efficiency, revealing how much profit you generate from your core services.
Delivery margin is often a more critical metric for agencies and consultancies. It directly reflects your team’s productivity, utilization, and profitability.
Imagine two projects at a design agency:
Project A (Website Design):
- Revenue: $20,000
- Direct Costs: $10,000 (labor, software, etc.)
- External Costs: $5,000 (subcontracted photography)
- Project ROI: 50% ((20,000 – 15,000) / 15,000 * 100)
- Delivery Margin: 50% ((20,000 – 10,000) / 20,000 * 100)
Project B (Logo Design):
- Revenue: $10,000
- Direct Costs: $2,000 (labor, software, etc.)
- External Costs: $0
- Project ROI: 400% ((10,000 – 2,000) / 2,000 * 100)
- Delivery Margin: 80% ((10,000 – 2,000) / 10,000 * 100)
At first glance, Project B seems much more profitable due to its higher ROI. However, the agency’s core competency is design work, not subcontracting photography. Therefore, the delivery margin is a more accurate reflection of their profitability.
- Project A: While it has a lower ROI, its 50% delivery margin shows that the agency is efficiently using its team’s skills to profit from its core design services.
- Project B: The 400% ROI is impressive, but it’s inflated by the lack of external costs. The 80% delivery margin is a better indicator of the profitability of the agency’s actual design work.
4 best practices for measuring and monitoring project profitability
Accurate and timely data is the foundation of effective project profitability analysis.
Avoid costly mistakes and ensure your calculations are precise with these four best practices:
1. Rely on historical data to inform your expected delivery margin
Ballpark estimates are fine for initial client chats. But you shouldn’t use them to predict your project profit.
Why?
This guesswork can lead to figures far from reality, especially for complex projects with big teams and multiple deliverables.
The solution? Base cost estimates on concrete historical data instead of ballpark numbers.
Scoro makes this easy.
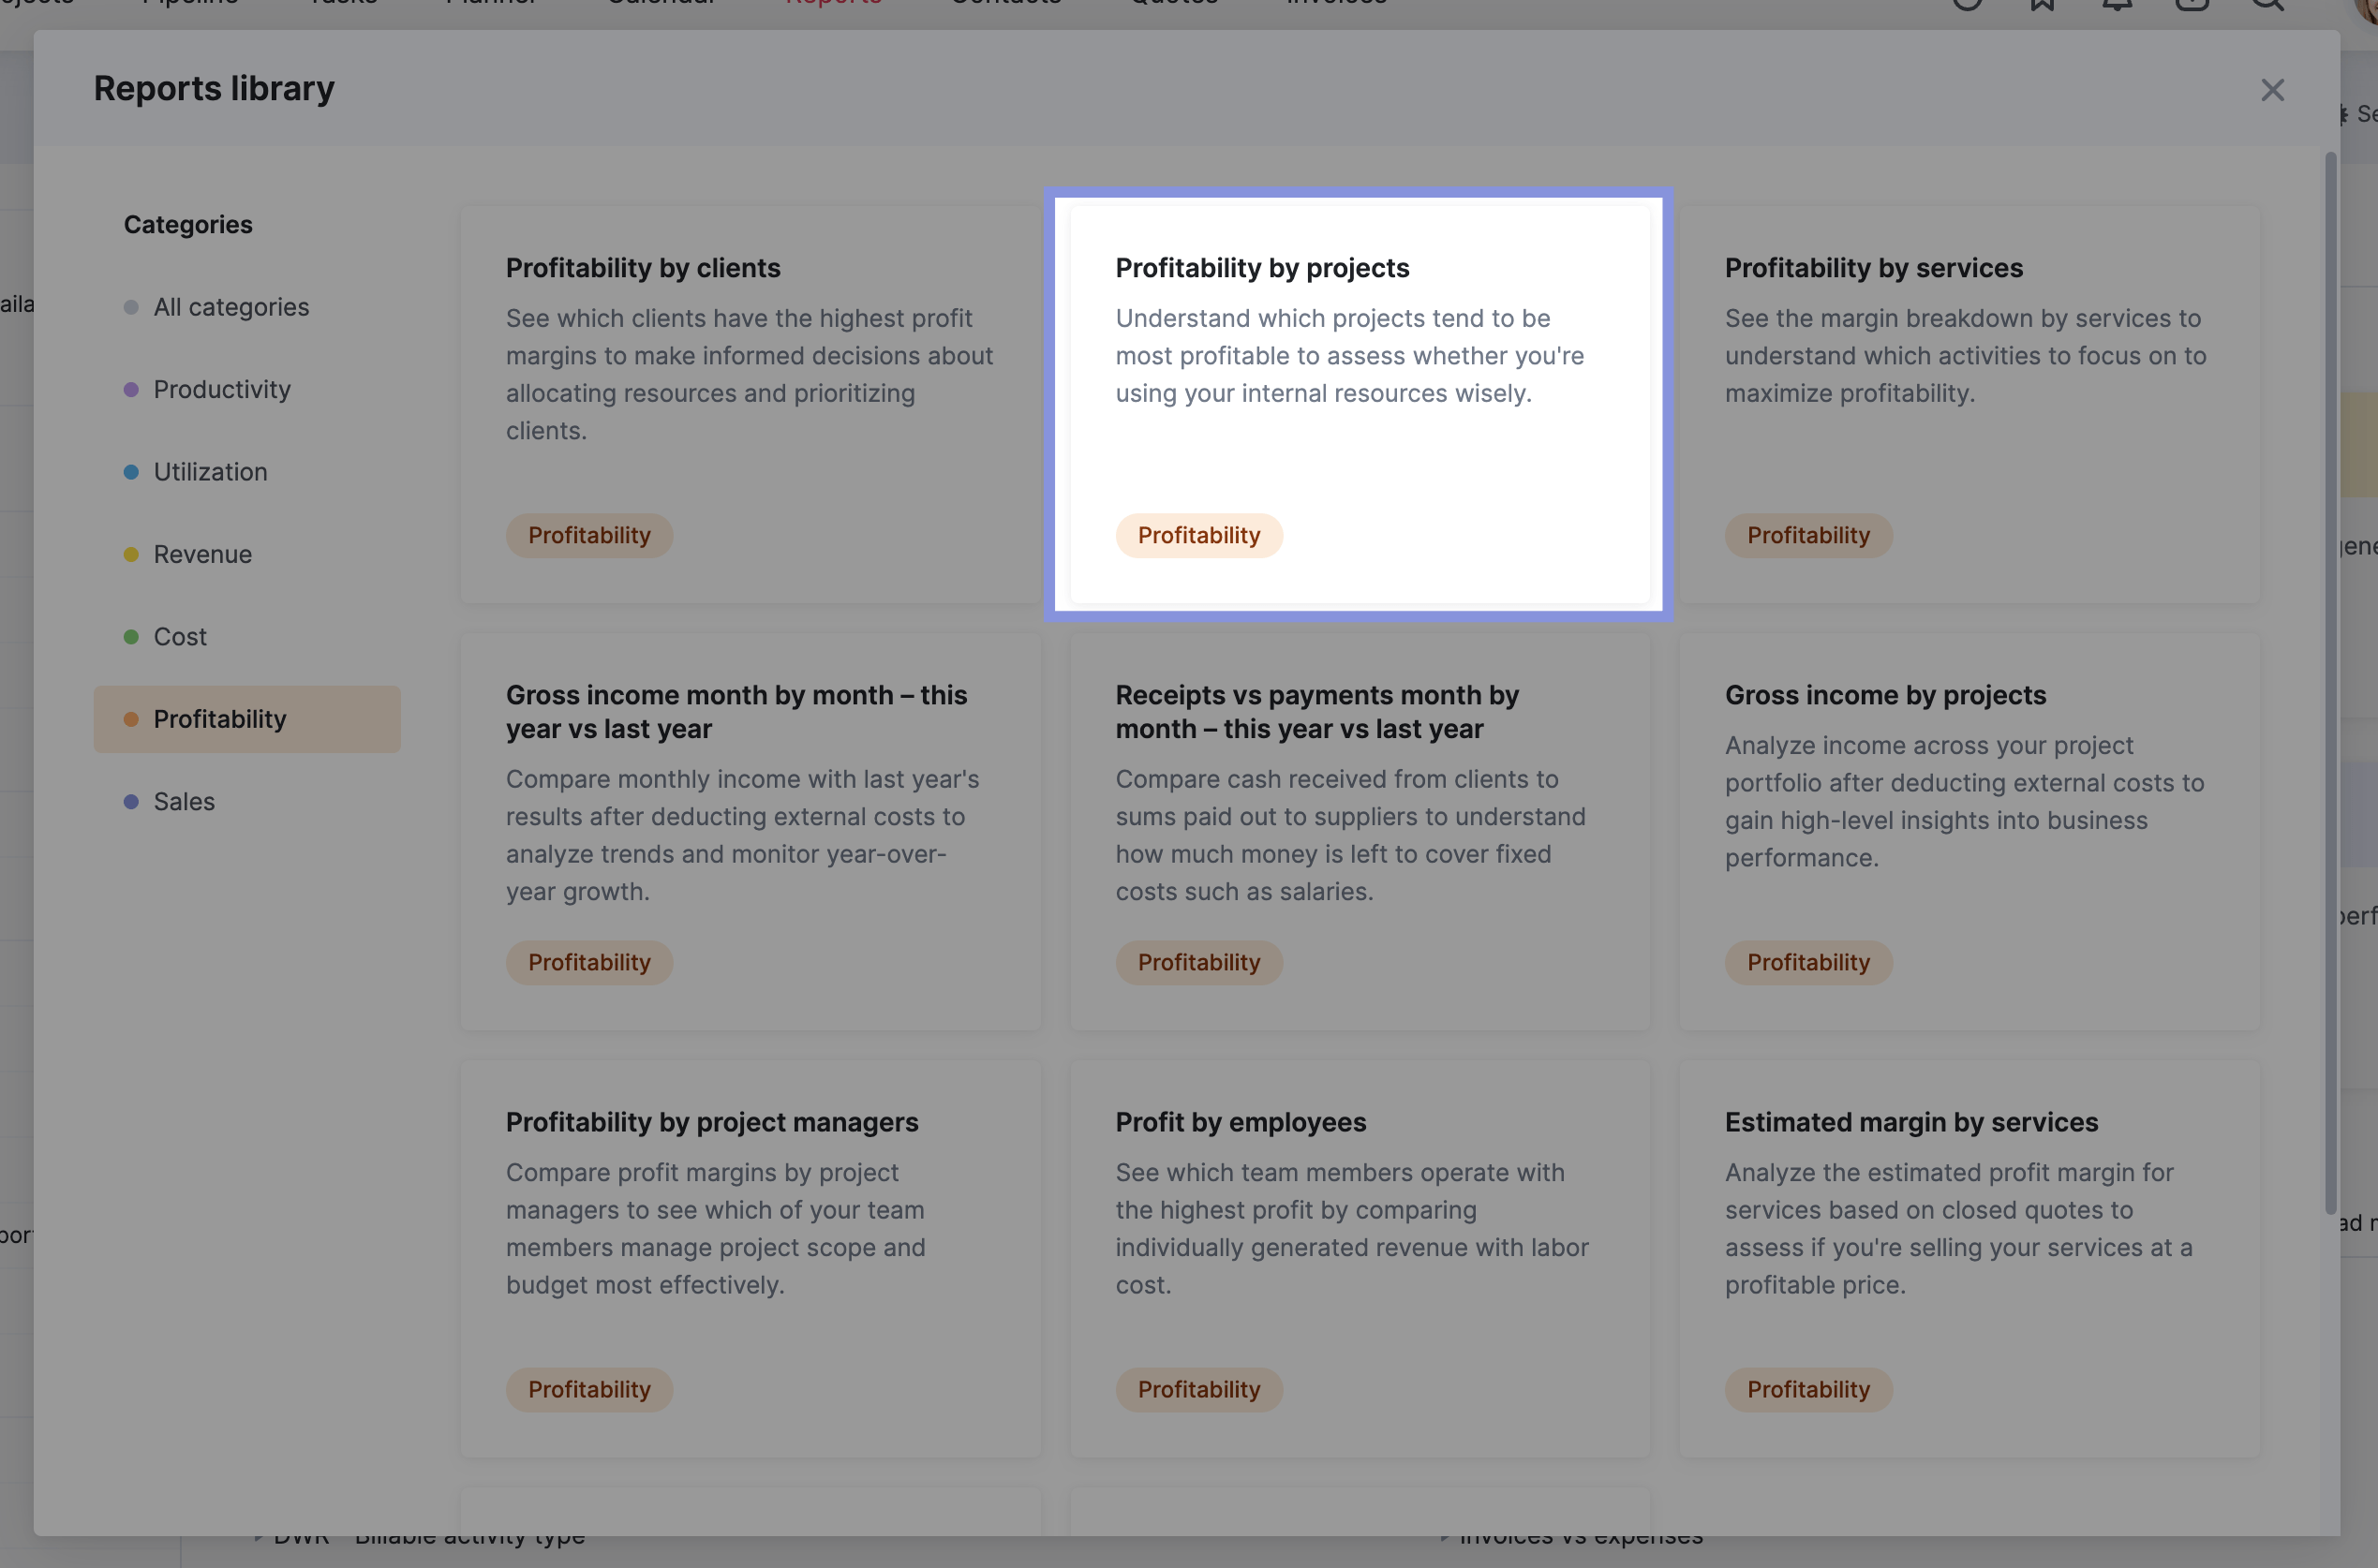
Go to the “Reports” module and click the “Profitability” box.
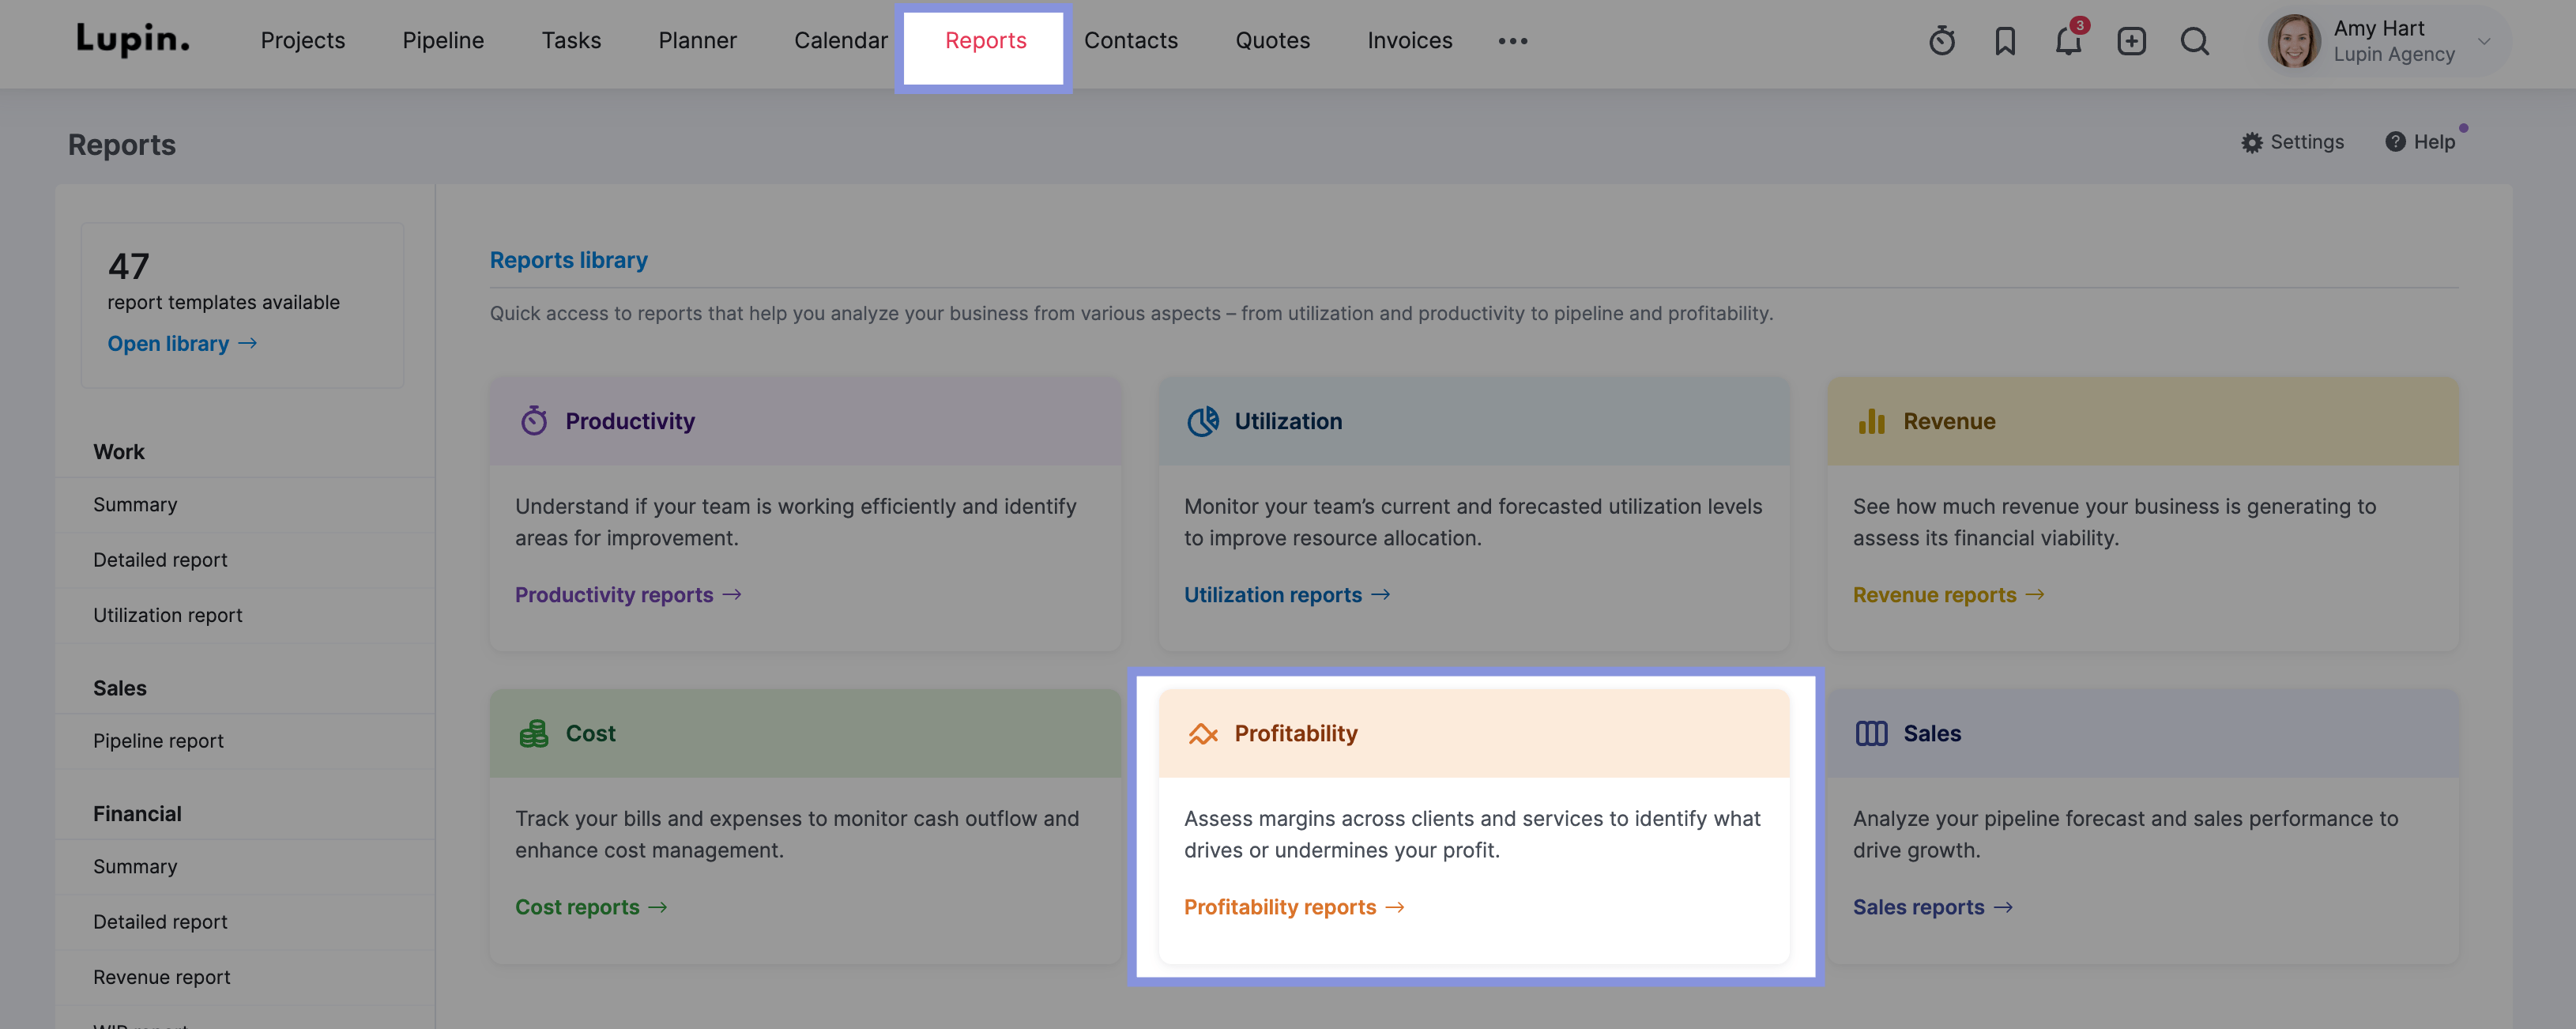
Then, click on “Profitability by projects.”
This will take you to the “Project” list view. Click “View” > “Data columns,” check “Delivery margin,” and then hit “Display”

Now, you’ll have a clear breakdown of key profitability metrics for each project, including:
- Income: The actual revenue generated by the project.
- External Cost: Costs for external vendors or suppliers.
- Labor Cost: The cost of your team’s time on the project.
- Project Profit: The project’s overall profit, accounting for all costs.
- Delivery Margin: The profit your team generates after covering their direct costs.
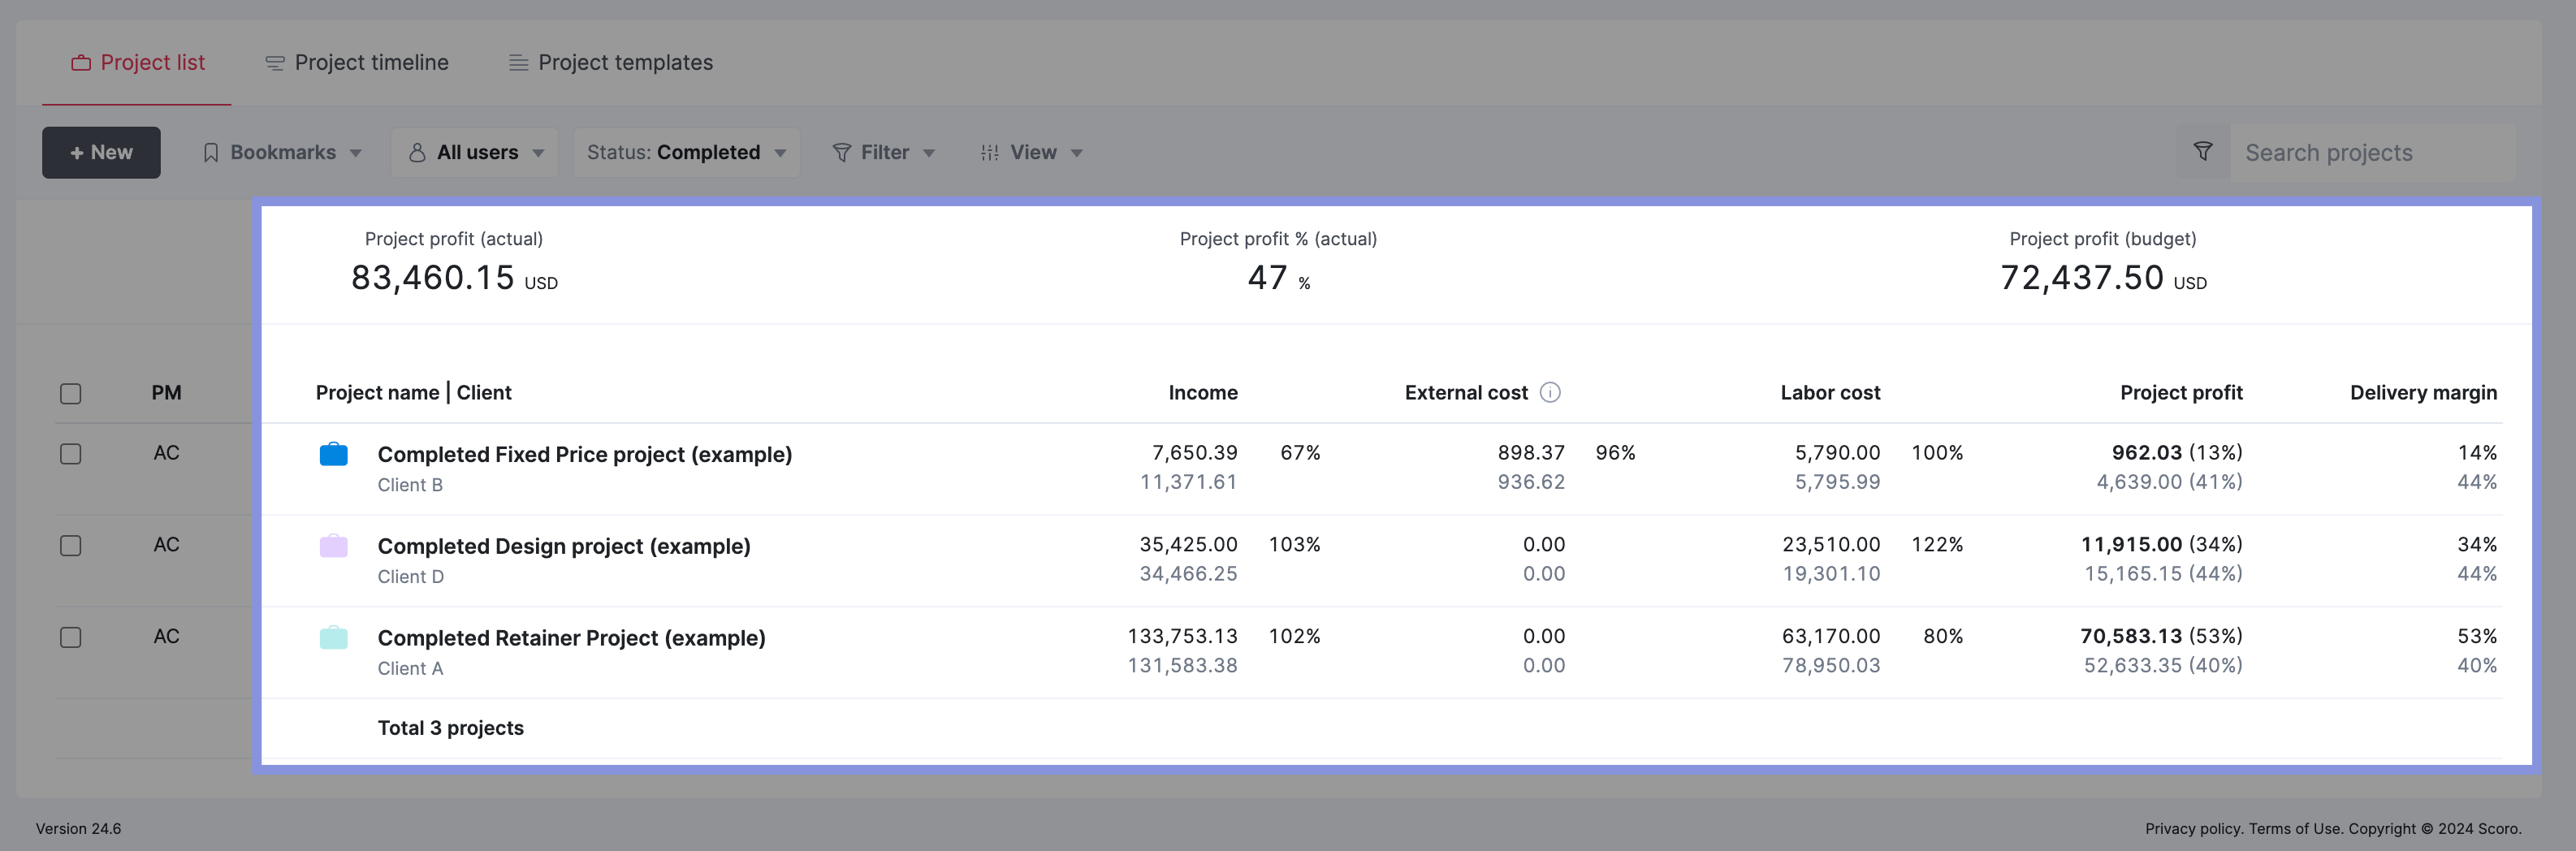
Each project’s actual results are displayed in bold, while the planned numbers are in gray.
2. Automate your profit calculations
Skip the manual profitability math to save yourself time. And save your projects from potential financial losses.
Scoro automatically calculates your project profitability before, during, and after your projects are finished.
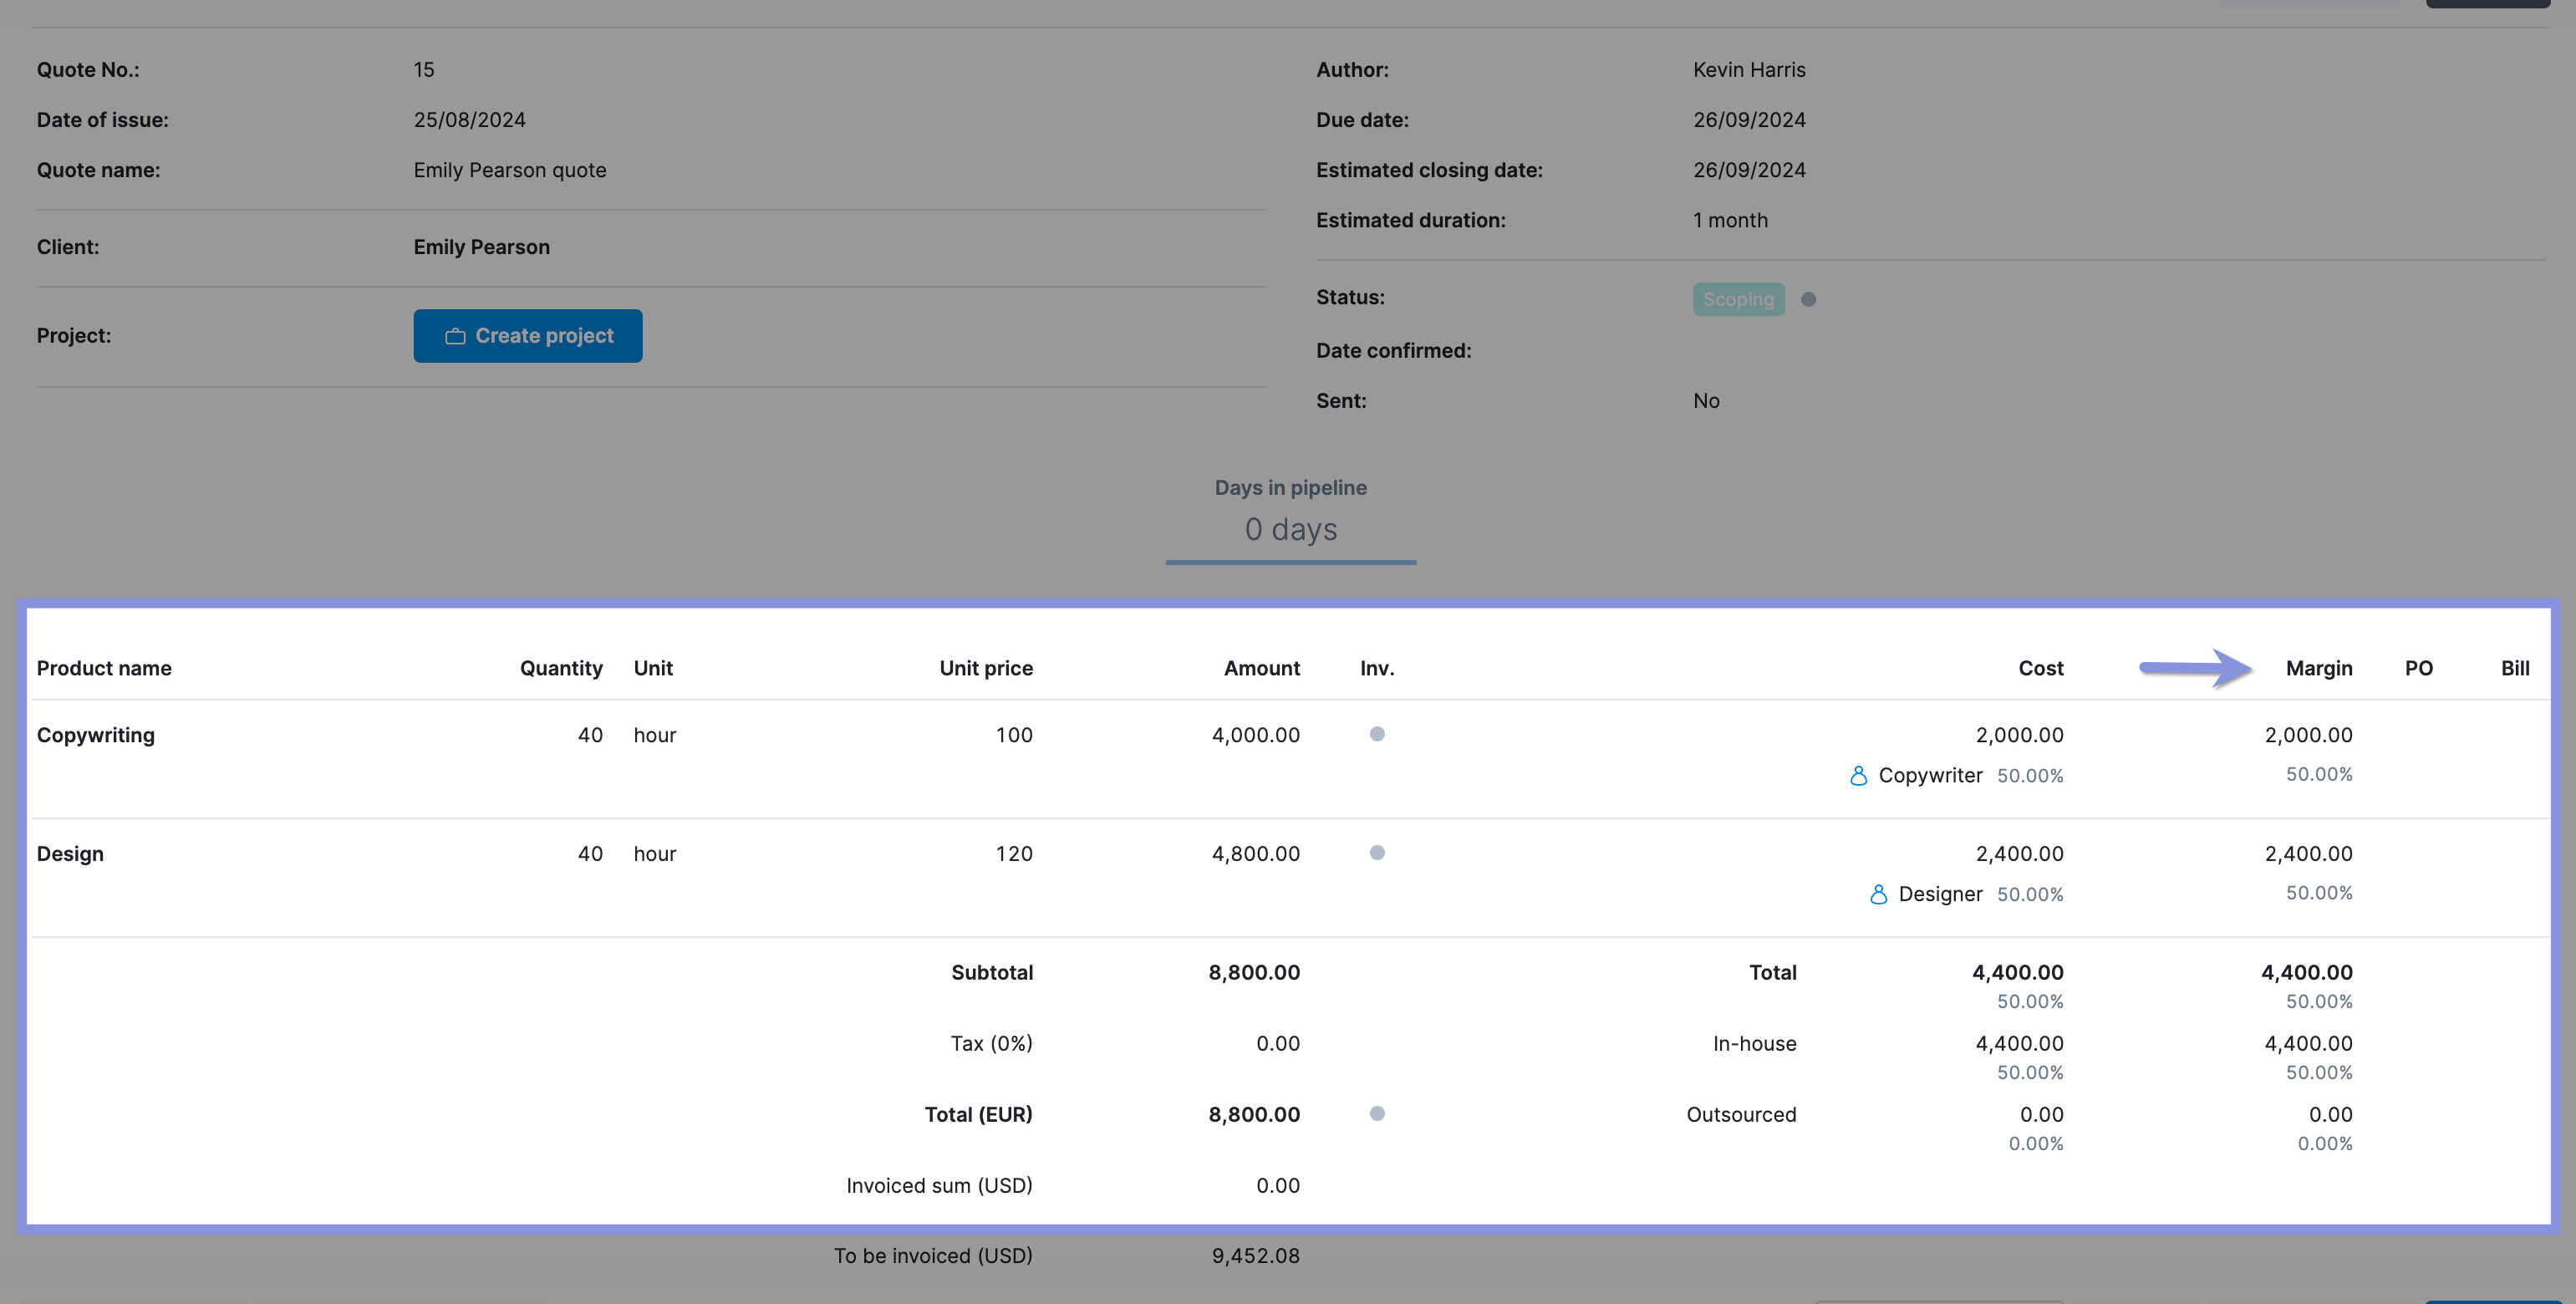
View your expected delivery margin, “Margin” column for each quote you build at the bottom.
This will help you decide whether it’s smart to take on a project, pass on it, or adjust pricing to make it worth your team’s time.
Further Reading: Project Cost Estimation: A Guide to Quoting Profitable Projects
3. Keep an eye on your budget health
Managing your project’s budget is crucial.
If you don’t, it’s easy to miss problems that can hurt your profit, like the project growing bigger than planned or tasks taking way longer than expected.
You can easily track all project-related costs in Scoro. Click on the “Projects” module, then click on any individual project.
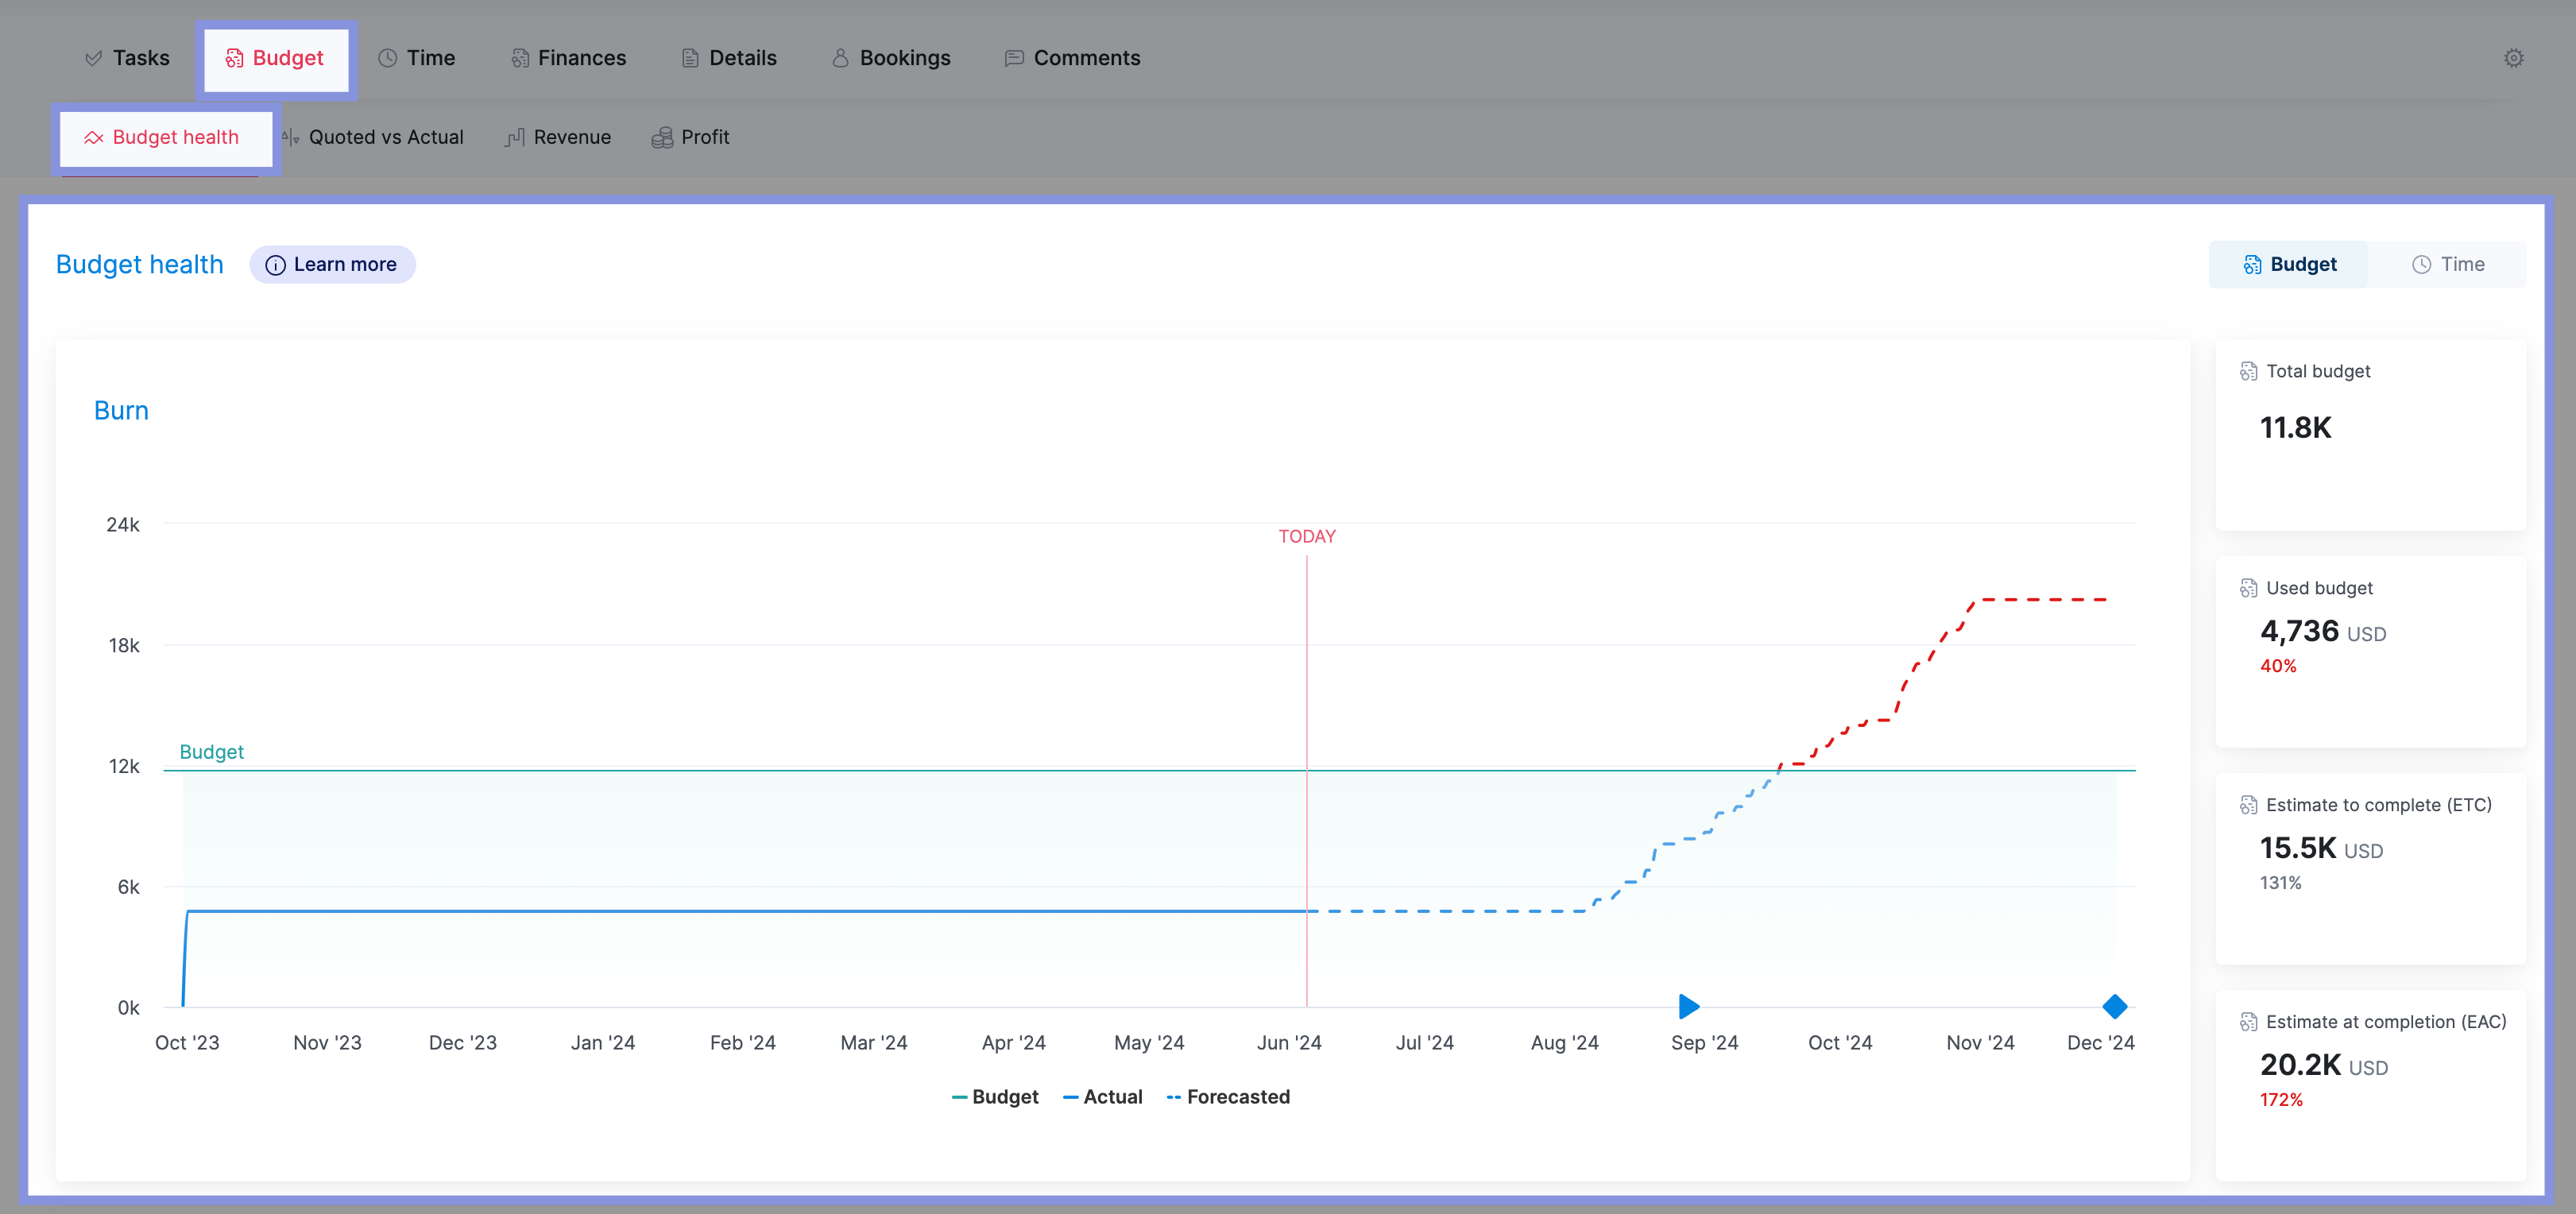
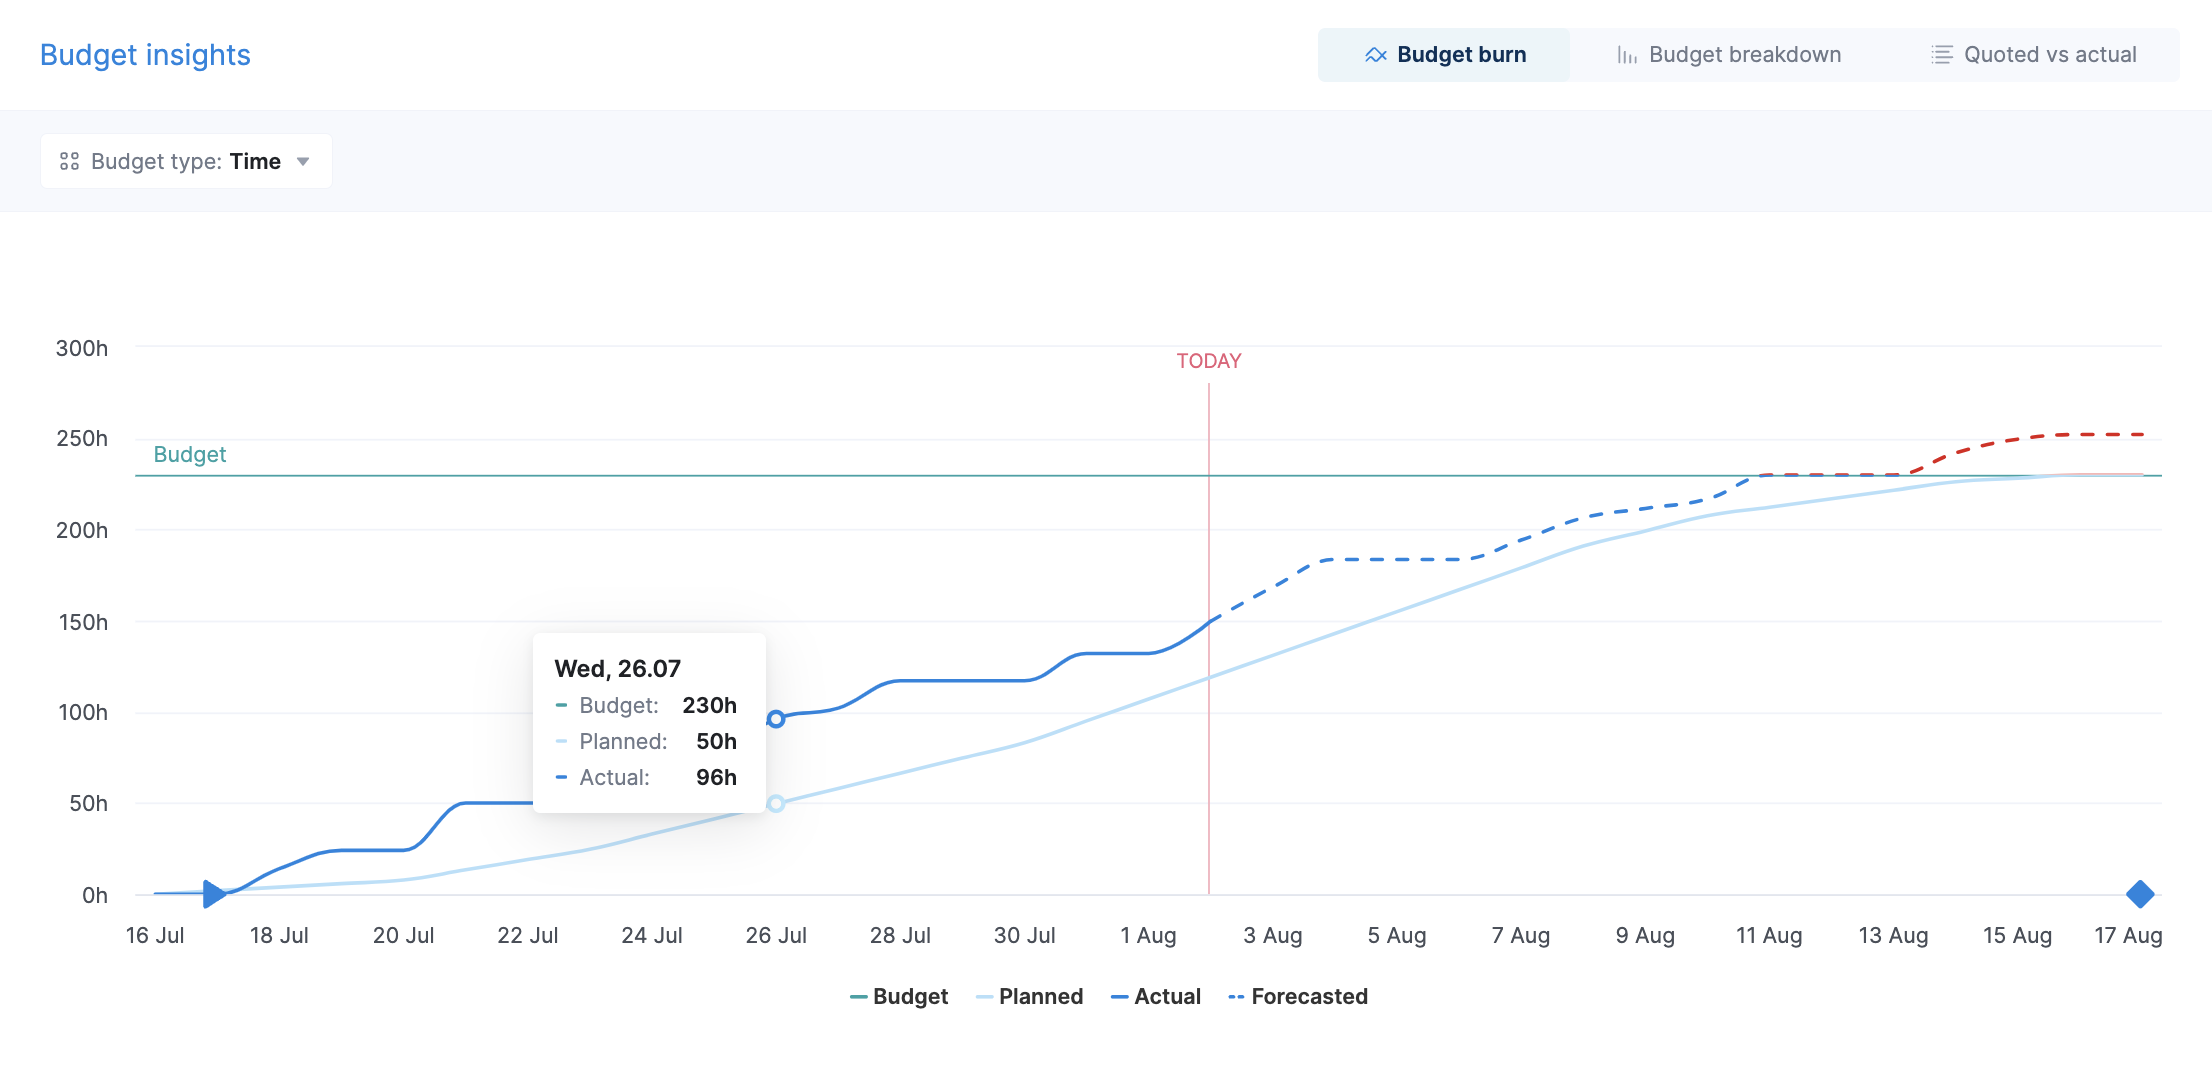
To see your Burn-up chart, click on the “Budget” tab, followed by “Budgert health”
The Burn-up chart in the “Budget health” section tracks all project-related activities. It shows your project’s budget progress over time so that you can analyze the burn rate.
You’ll see data such as:
- Total Budget: The total amount of money allocated to the project.
- Used Budget: The amount of the budget already spent.
- Estimate to Complete (ETC): The estimated amount of money needed to complete the remaining project tasks.
- Estimate at Completion (EAC): The total estimated project cost, including both used and remaining budget.
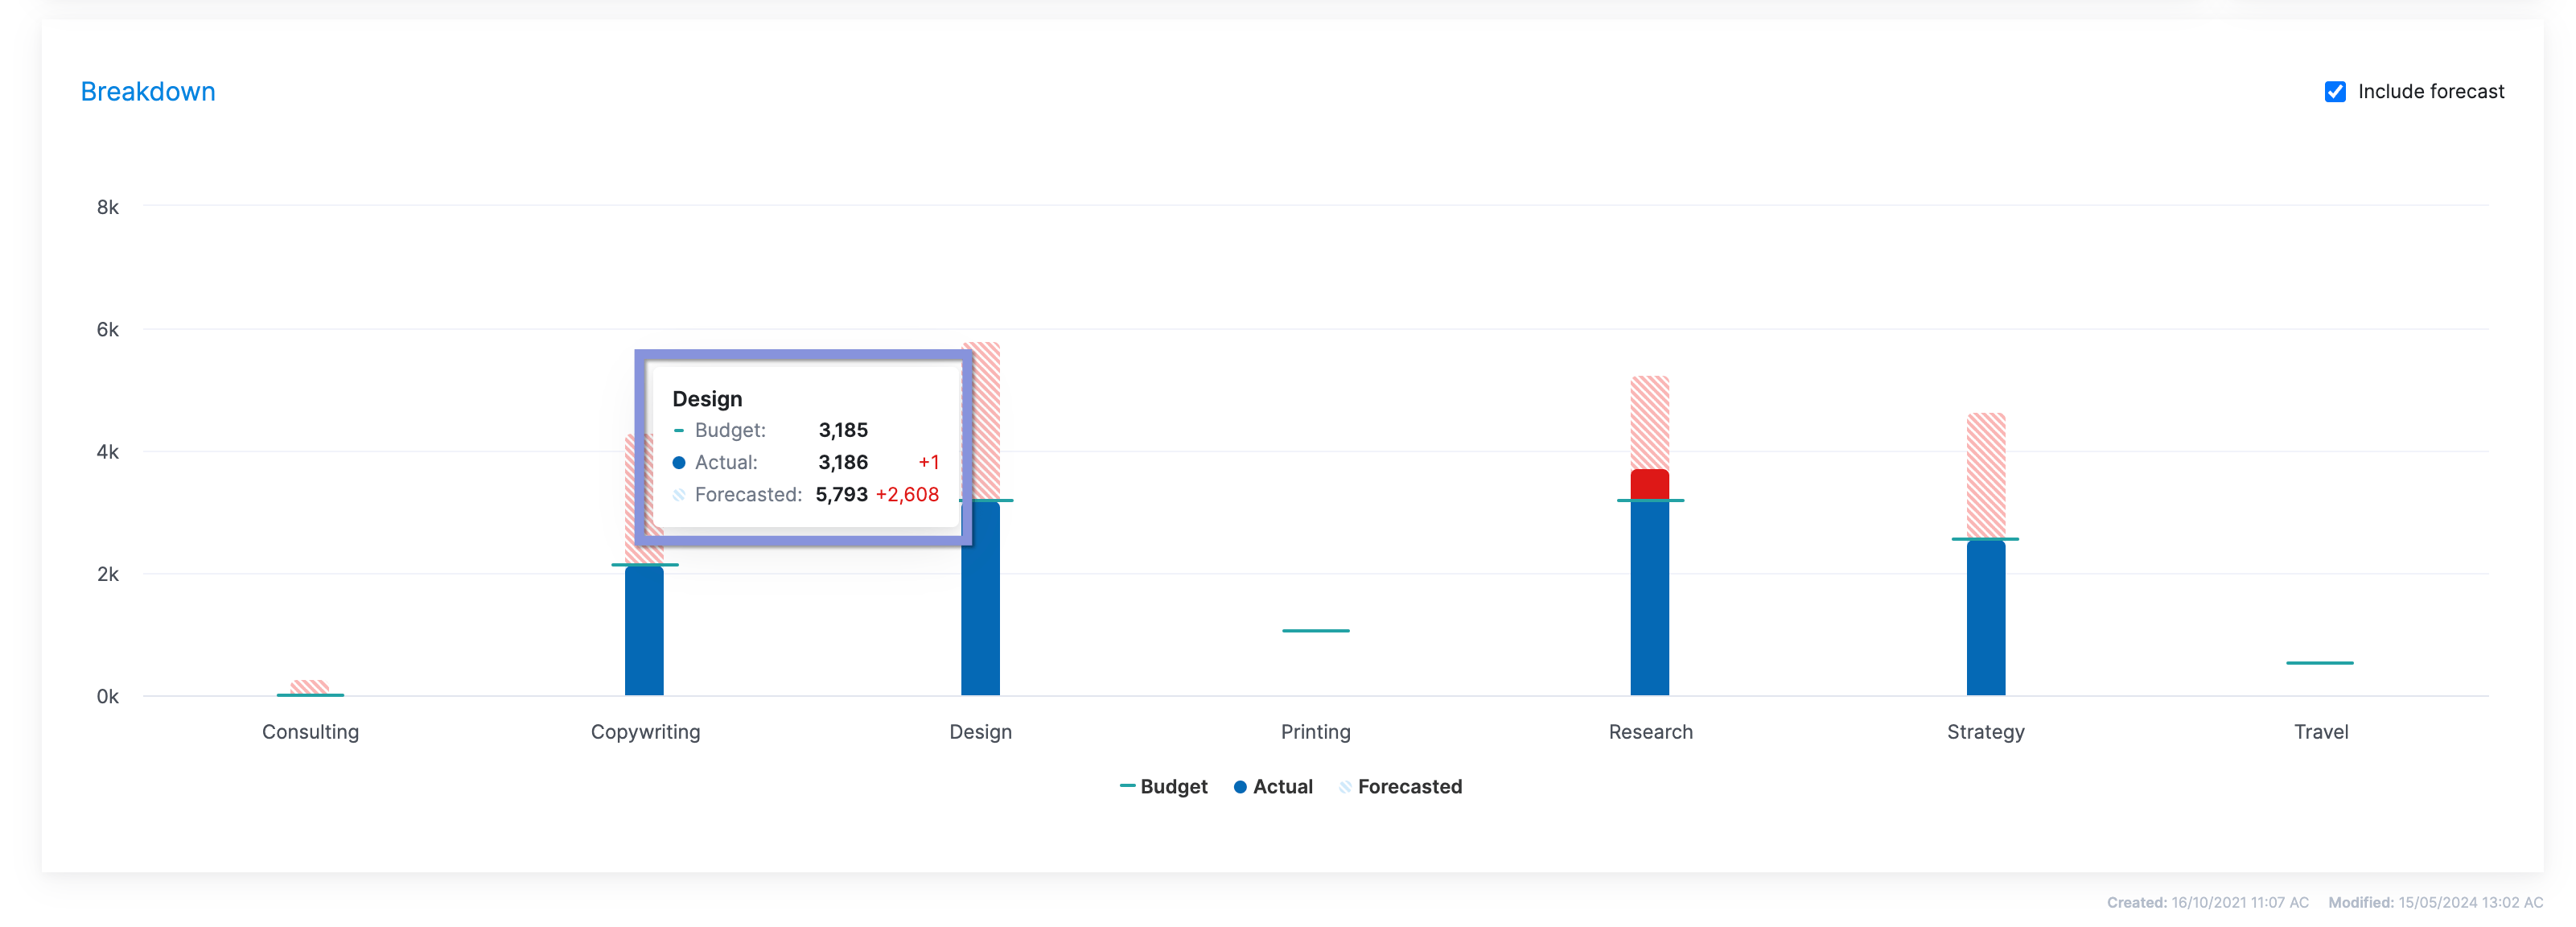
Scroll down, and you’ll also see a breakdown of the services included in that project. Hover over any service to see its budget, actuals, and forecasted numbers.
Use this knowledge to make decisions to get things back on track, such as reallocating work. Or renegotiating the project scope to protect your margins.
4. Analyze your planned vs. actual numbers
The final piece of the profitability puzzle is comparing your planned and actual results. This will allow you to see how well (or poorly) your team used their time and budget.
Whether you exceed or fall short of your targets, you want to learn how to improve from each project.
If you don’t figure out why you went over budget or didn’t have enough people to finish the work on time, the same problems will happen again in future projects.
Over time, these unresolved discrepancies erode your profit margins.
In Scoro, you can see your planned vs. actual numbers for any completed project by clicking the “Quoted vs. Actual” tab within the individual project view.
Here, you’ll see a comparison of your expected revenue and costs (gray text) to what you spent and made on the project (bold) for each phase.
This information is automatically calculated using your quotes and your team’s logged billable hours, bills, and expenses.
When reviewing the data, pay special attention to:
- Overall Profitabilty: Did you achieve your profitability targets? If not, was the deviation due to factors within your control (e.g., labor costs, resource allocation) or external factors (e.g., unexpected expenses, client changes)?
- Revenue Discrepancies: Were your project earnings higher or lower than expected? If so, why? Were there changes in scope, additional services provided, or adjustments to the project fee? Understanding these factors can help refine your pricing and scoping strategies for future projects.
- Labor Costs and Delivery Margin: Did your labor costs exceed your estimates? If so, which tasks or phases took longer than anticipated? Analyze this data to identify potential bottlenecks, inefficiencies, or areas where your team may need additional training or support.
- Expense Surprises: Were there any unexpected expenses that impacted your delivery margin? Review your project expenses to see if any costs could have been avoided or minimized.
- Scope Creep: Did the project scope expand without a corresponding increase in revenue? Identify any tasks or deliverables added after the project started and assess their impact on your profitability.
Say your project’s actual delivery margin was 10% lower than expected. Upon reviewing the quoted vs. actual data, you notice that the design phase took 20% more hours than initially scoped.
Your next steps could be:
- Investigating why the design phase exceeded estimates
- Determining if the scope was unclear or if there were unforeseen challenges
- Adjusting your future quoting process to account for similar design complexities
- Considering negotiating a bigger budget for design-heavy projects
If your project achieved a higher margin than expected, focus on identifying and replicating what brought you that success.
Your team may have delivered the work faster than anticipated because you invested in a new project management tool.
Or you were able to successfully negotiate additional fees during the project to account for increased scope or extra revisions requested by the client.
If you’re having trouble pinpointing the “why,” ask yourself the following:
- Did you price the project optimally?
- Did you accurately estimate the time and resources needed?
- Were there any process improvements or efficiencies that boosted productivity?
- Did you manage scope creep and client expectations?
Improve your project profitability with Scoro
Calculating and tracking project ROI is just one piece of managing and improving your overall profitability.
With Scoro, you can go much further. Use our customizable dashboards and real-time reports to streamline workflows, optimize resource allocation, identify areas for cost reduction, and maximize ROI for future projects.
Take it from Cosmonauts & Kings—this political comms agency boosted their billable utilization and cut overservicing by using our automated work management platform.
See how Scoro can help your own org by signing up for a free trial today.
Here’s how to easily calculate profitability in five steps:
1. Determine the project’s total revenue
This part is usually the easiest. Your project revenue is simply the amount your client will pay you.
So, if your company charges them $20,000 for an ad campaign, that’s your project revenue.
Scoro, an end-to-end project management tool, makes it easy to monitor your project revenue.
Here’s how:
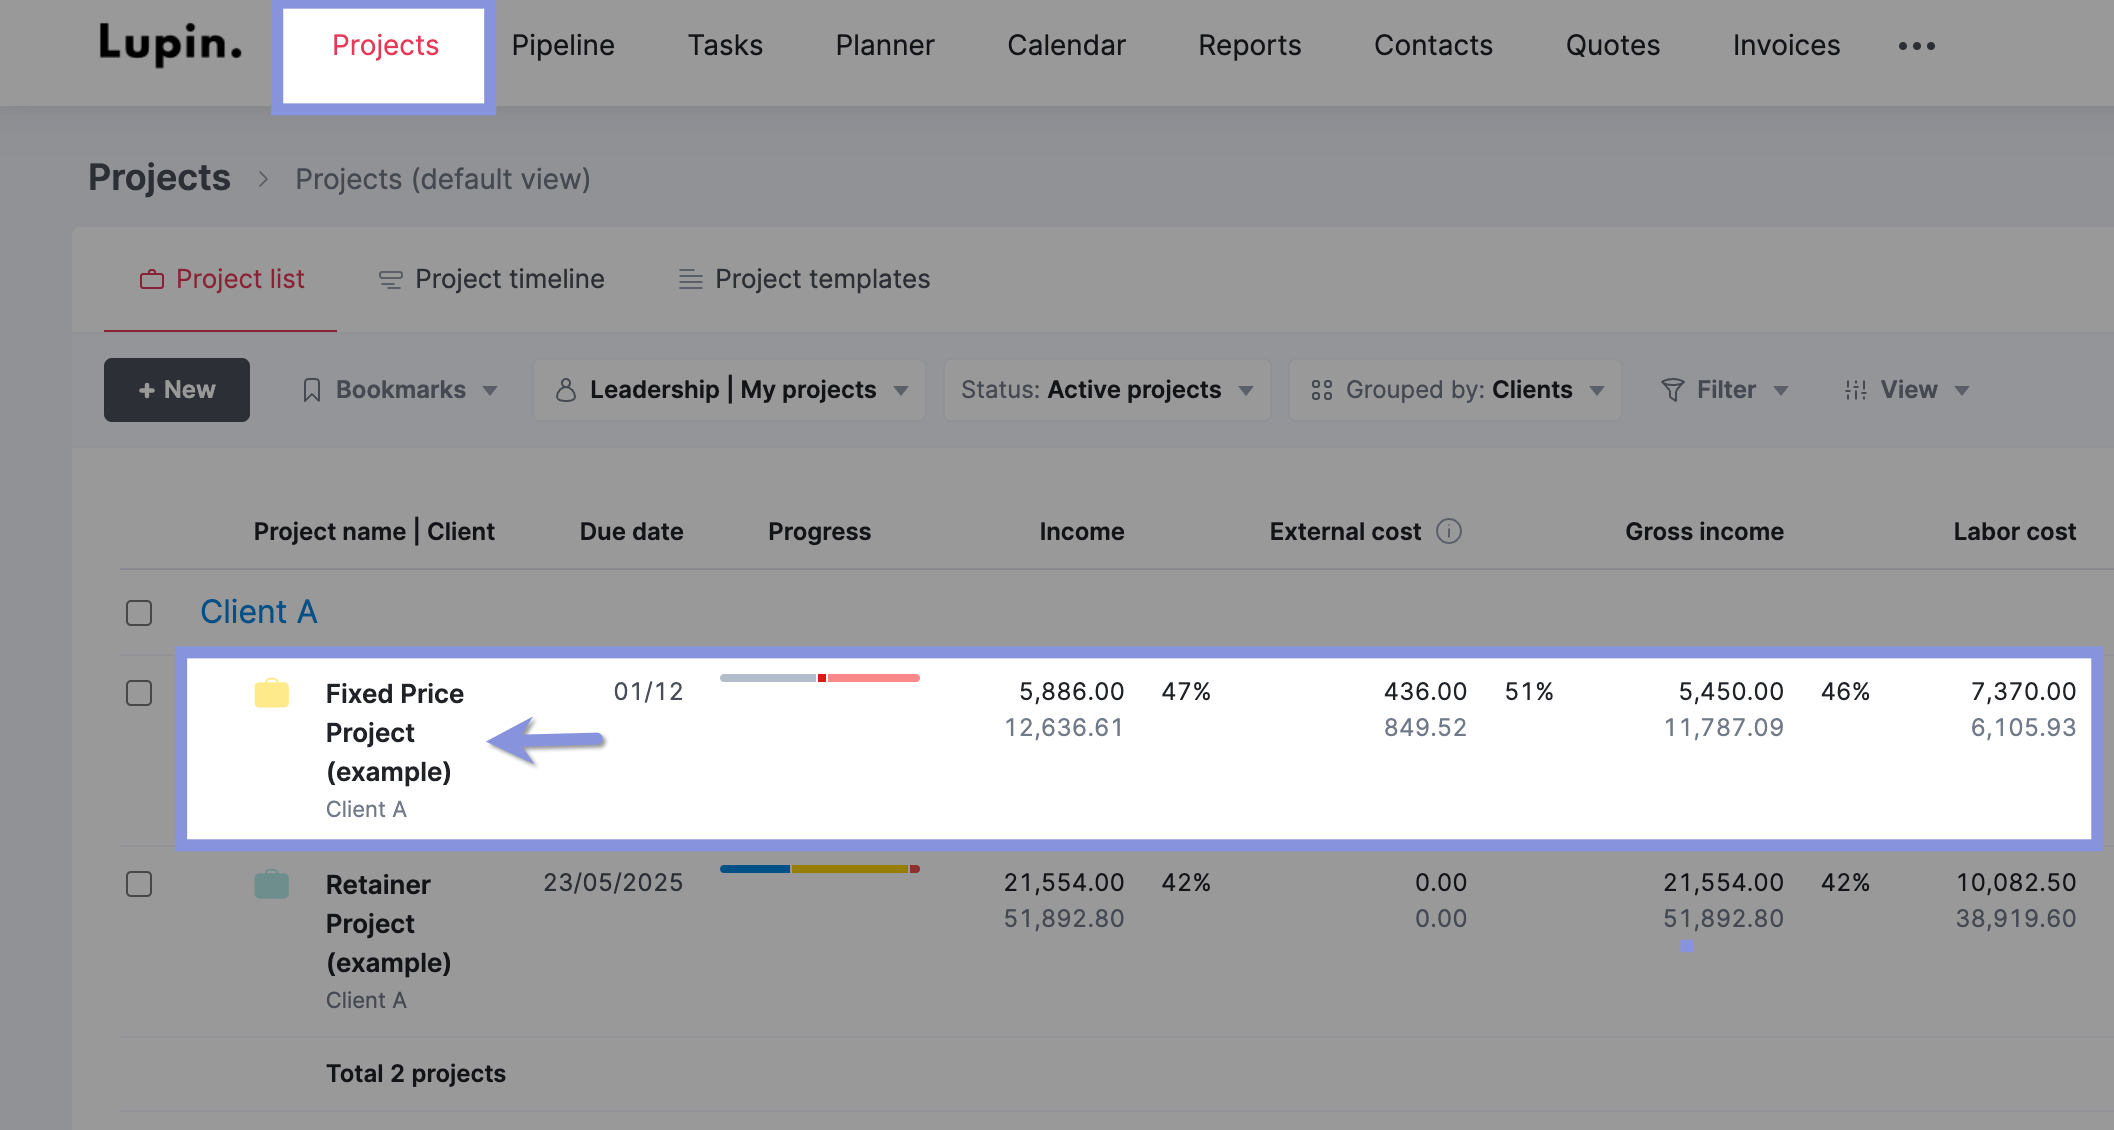
Go to the “Projects” module and click the “Project list” tab.
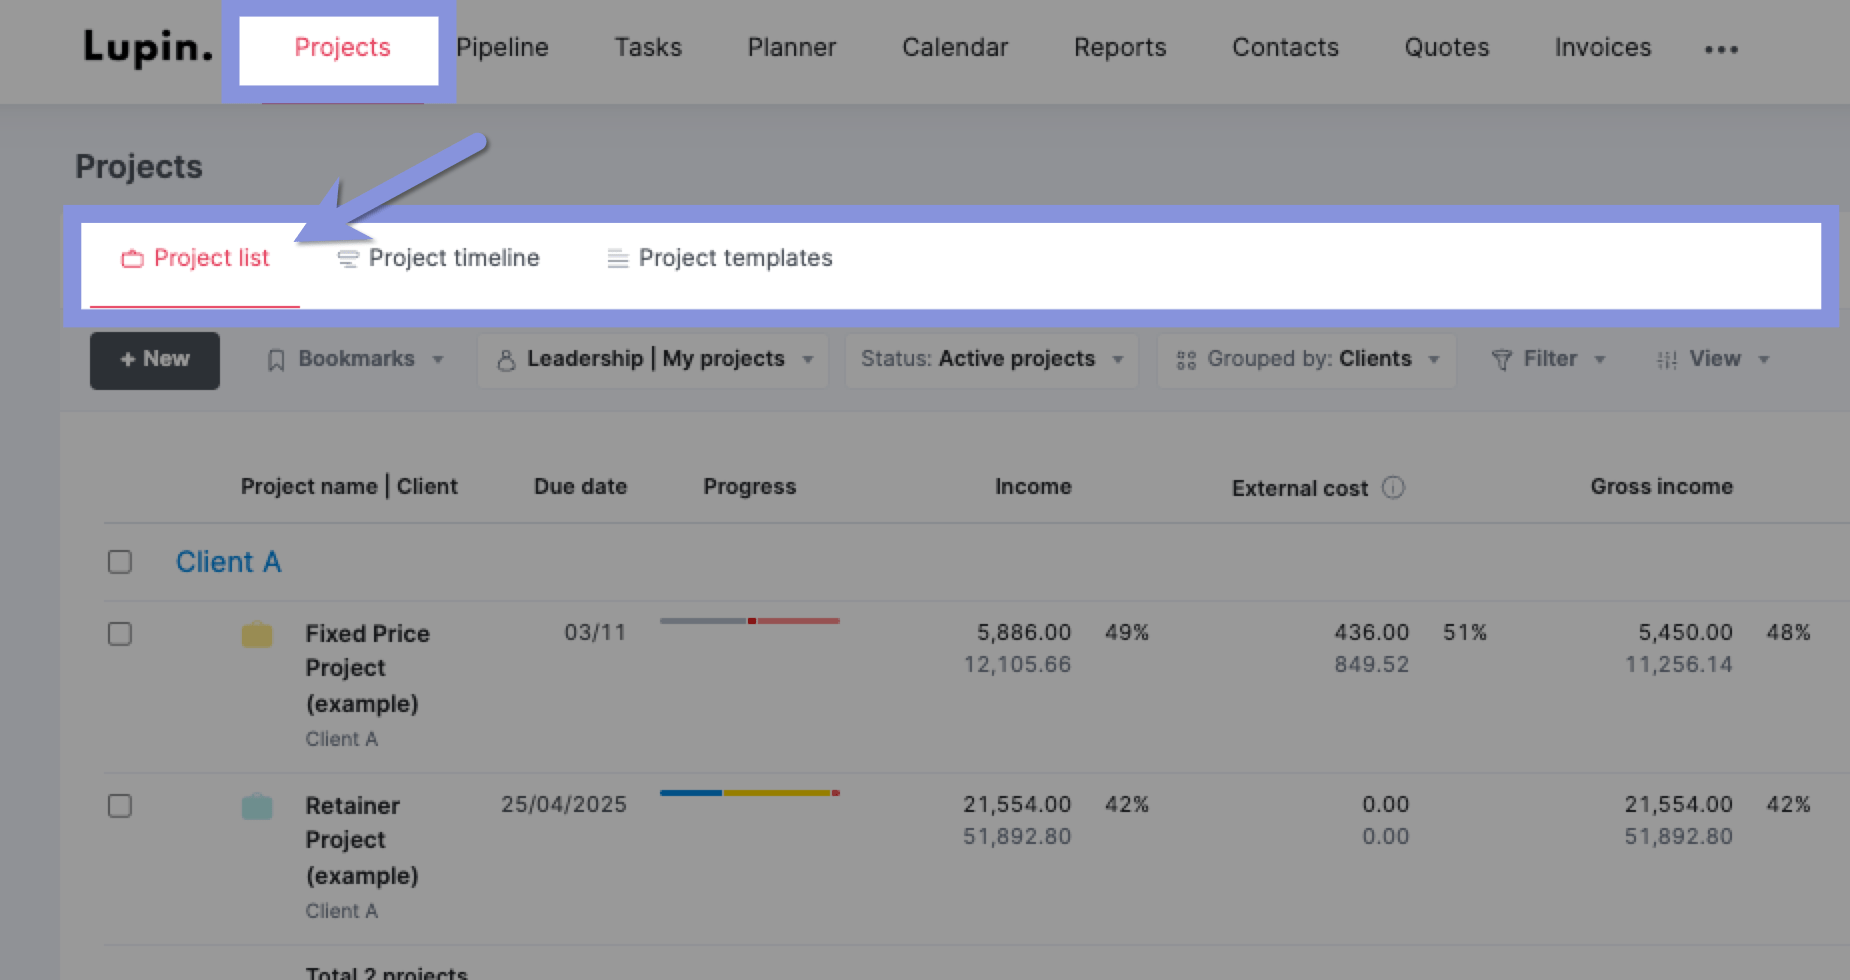
Then, look at the “Income” column. It’ll show your estimated revenue (in gray) and actual revenue (in bold) based on invoices and client payments.
2. Add up direct project costs
Now that you know your revenue, it’s time to tackle the other side of the profitability equation: costs.
Start by calculating all the direct costs your company will incur to deliver the project.
These are the expenses directly tied to delivering the project, including:
Labor costs
Multiply each team member’s estimated hours by their hourly rate to calculate their individual labor cost.
First, list all employees and contractors assigned to the project. Then, identify their hourly labor rate.
For full-time employees, add up their:
- Annual salary
- Training costs
- Equipment costs
Then, divide by 2,080 (40 hours a week x 52 weeks) to get their hourly labor rate.
Working with contractors? Multiply their hourly rate by the number of hours they’ll be working. Add this to the total labor cost for employees.
Repeat for each employee. Then, add up the costs to get your total labor cost.
Here’s what it looks like in practice:
List all employees and contractors assigned to the project:
- Employee A (Project Manager)
- Employee B (Designer)
- Contractor C (Developer)
Determine each employee’s hourly labor rate:
- Employee A: ($80,000 salary + $2,000 training + $1,500 equipment) / 2,080 = $40.14/hour
- Employee B: ($60,000 salary + $1,500 training + $2,000 equipment) / 2,080 = $30.53/hour
Use the contractor’s hourly rate:
- Contractor C: $100/hour
Multiply each person’s hourly rate by their projected hours on the project:
- Employee A: $40.14/hour x 200 hours = $8,028
- Employee B: $30.53/hour x 150 hours = $4,579.50
- Contractor C: $100/hour x 100 hours = $10,000
Then, add up all the individual labor costs.
Which gives you something that looks like this:
| Team member | Hourly rate | Estimated hours | Total cost |
|---|---|---|---|
| Employee A (Project Manager) | $40.14 | 200 | $8,028 |
| Employee B (Designer) | $30.53 | 150 | $4,579.50 |
| Contractor C (Developer) | $100 | 100 | $10,000 |
| Total labor cost | $22,607.50 |
Expenses
Expenses are usually one-off purchases your team members make to complete a project, such as client lunches or business travel.
Estimate your expenses before a project begins by:
- Analyzing past projects of similar scope and size to identify typical costs
- Identifying anticipated expenses with team members and clients
- Creating a detailed budget for each expense category (e.g., travel, meals, supplies)
Here’s an example:
Travel: Two team members meeting with a client at their main office
- Flights: $800
- Hotel (Two nights): $600
- Ground transportation: $200
- Total travel expenses: $1,600
Client lunches: Four lunches during project kickoff and review meetings
- Average cost per lunch: $100
- Total client lunch expenses: $400
Software licenses: Two new design software licenses needed
- Cost per license: $250
- Total software expenses: $500
After adding these estimated expenses, the total would be $2,500 ($1,600 + $400 + $500).
Bills
Now, figure out how much you’ll spend paying external suppliers.
Say you’re working on a website redesign project that requires these external resources:
- Outsourced copywriting: $2,000 for 10 pages of content
- Freelance developers: $4,000 at $200/hour
In this example, the total bills would be:
- $2,000 + $4,00 = $6,000
Now, let’s add up the labor costs, expenses, and bills to get the total projected direct costs for the project:
- Labor costs: $22,607.50
- Expenses: $2,500
- Bills: $6,000
Total projected direct costs = $22,607.50 + $2,500 + $6,000 = $31,107.50
Congrats—you made it through a lot of math!
If you’d rather skip the calculations, Scoro automatically calculates labor costs, bills, and expenses in one place.
Here’s how:
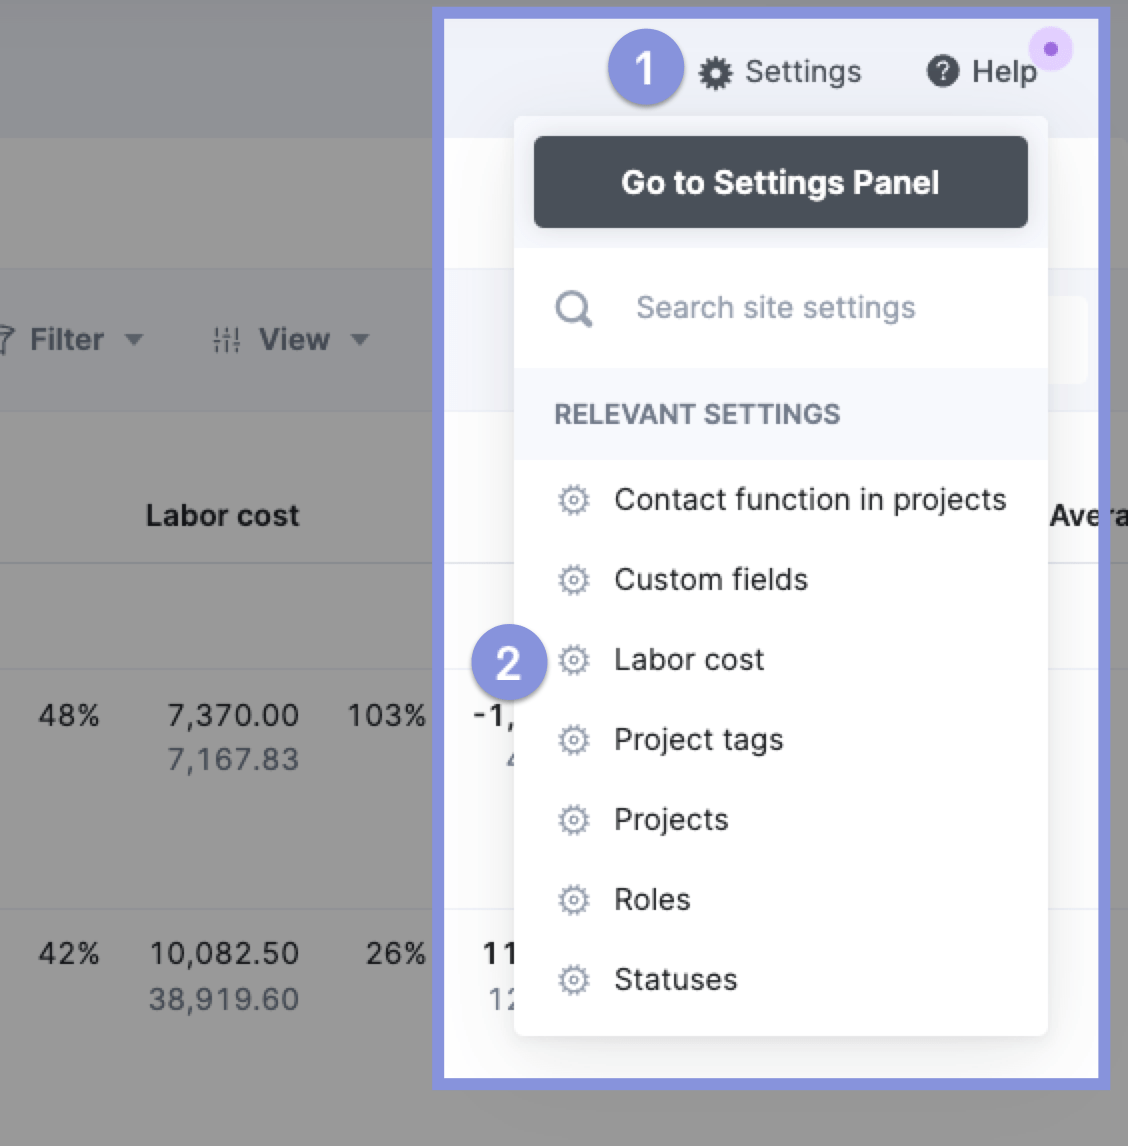
First, click “Settings” in the top right-hand corner and then “Labor cost.“
You can either set a default labor rate for users without a defined role within your team or for specific roles.
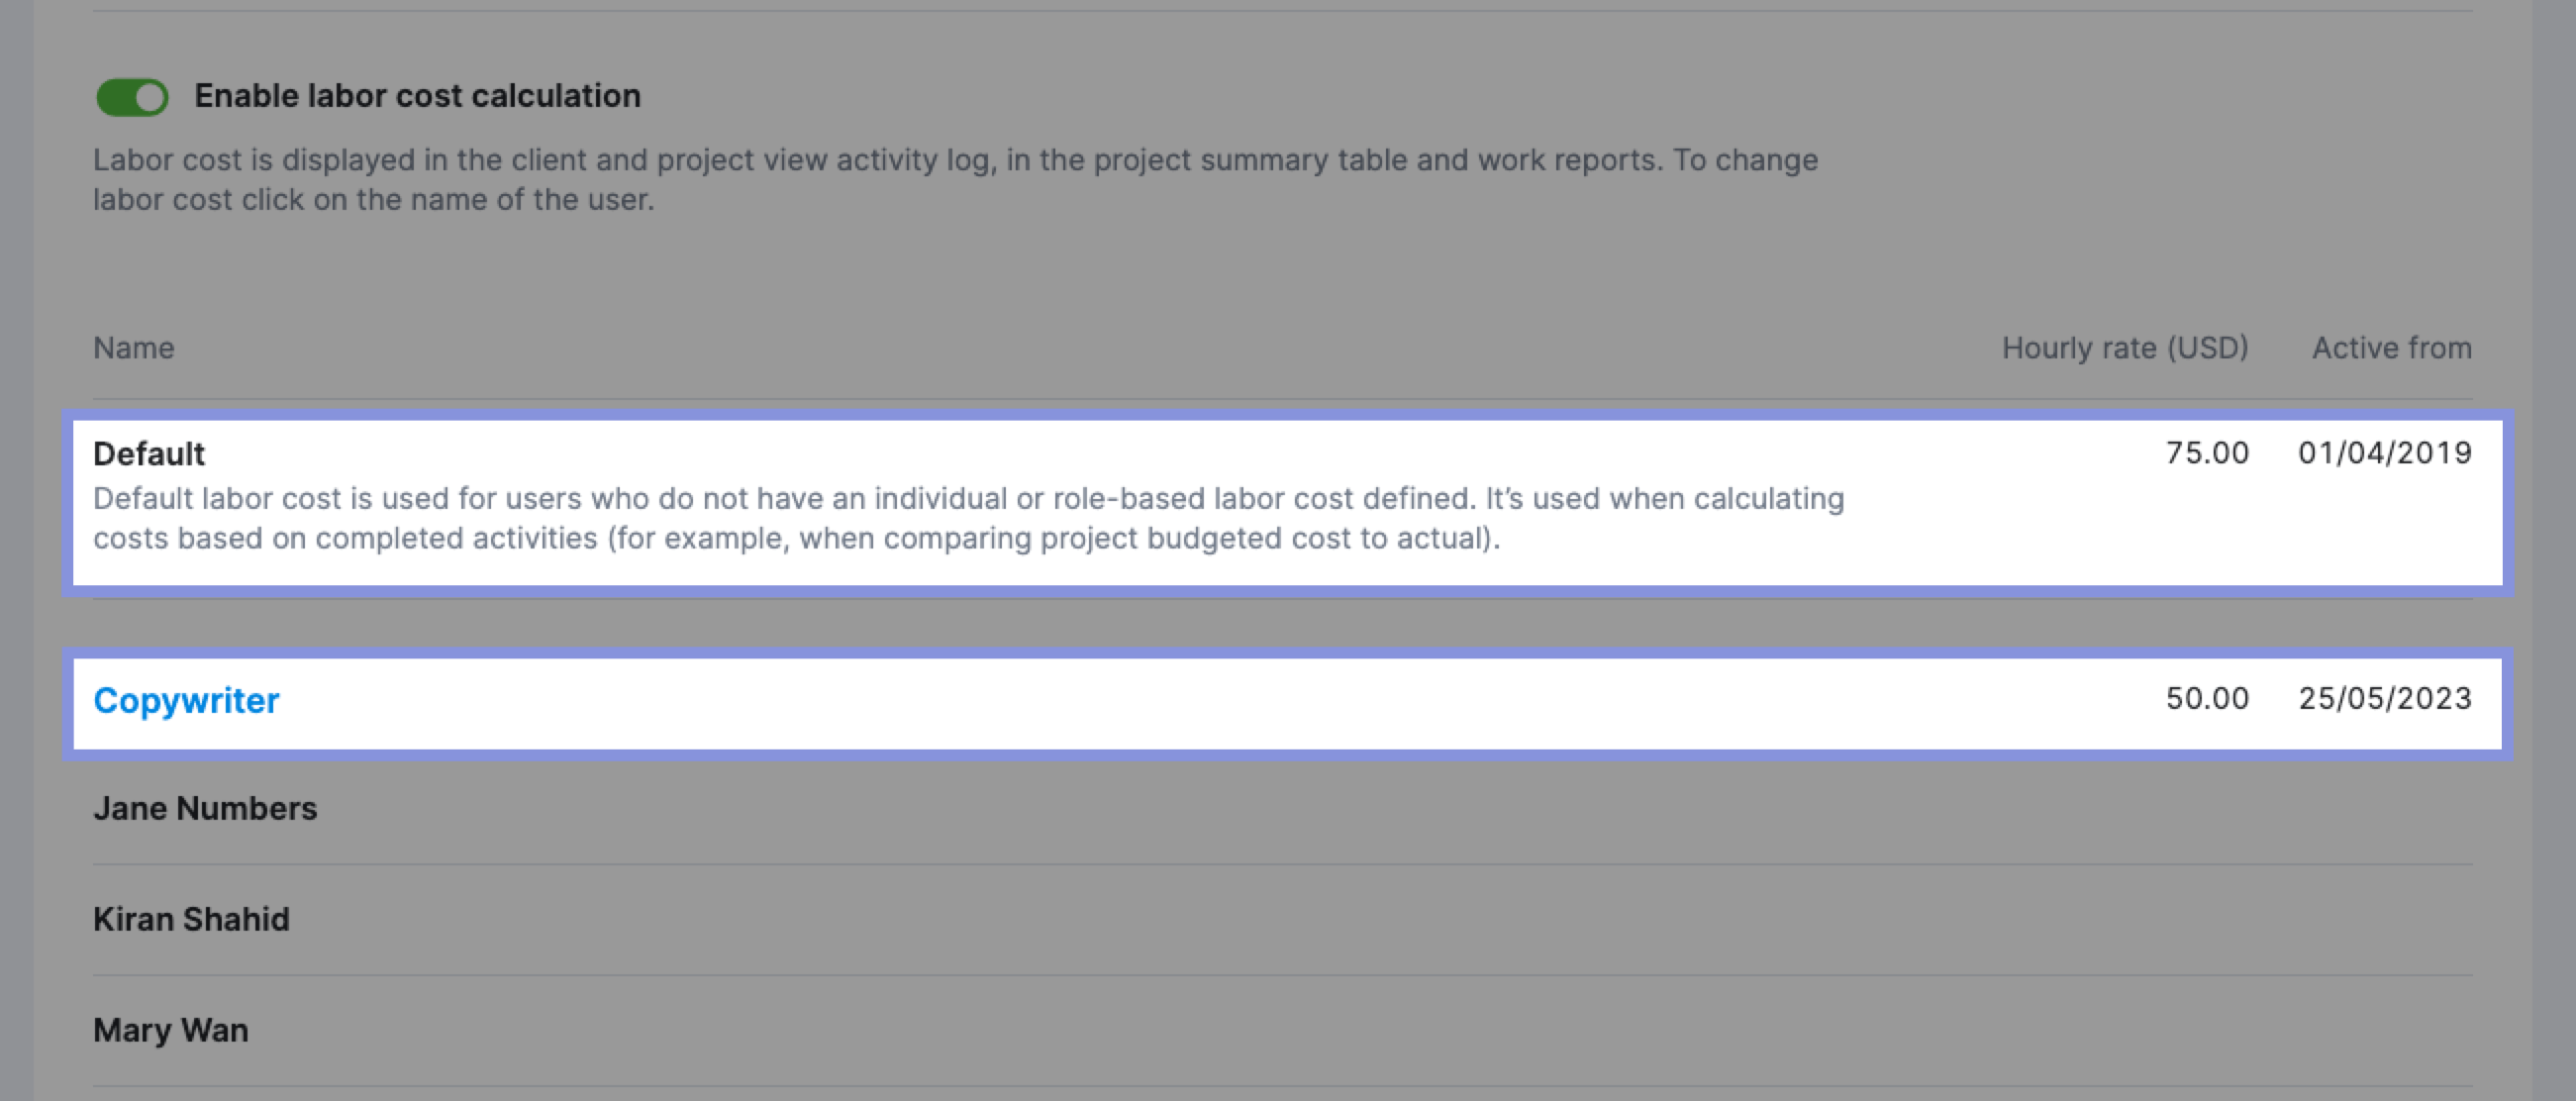
You can also set a specific labor rate for each user by clicking on their name. In the “Active from” field, you can set a specific date when the rate becomes active.
Next, you want to ensure that expenses correspond to the right project. Misallocating or overlooking expenses can skew financial data.
The result? Misinformed decisions about which projects to pursue or pass up.
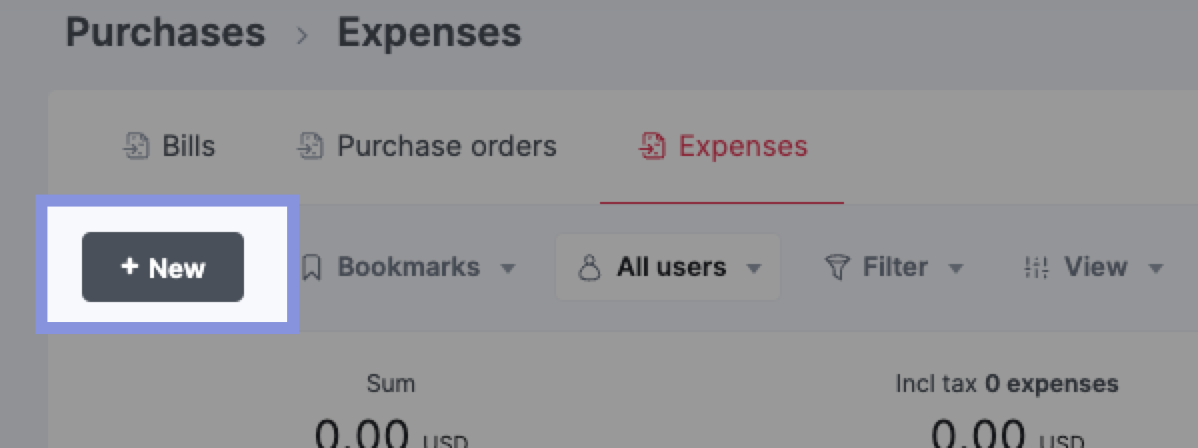
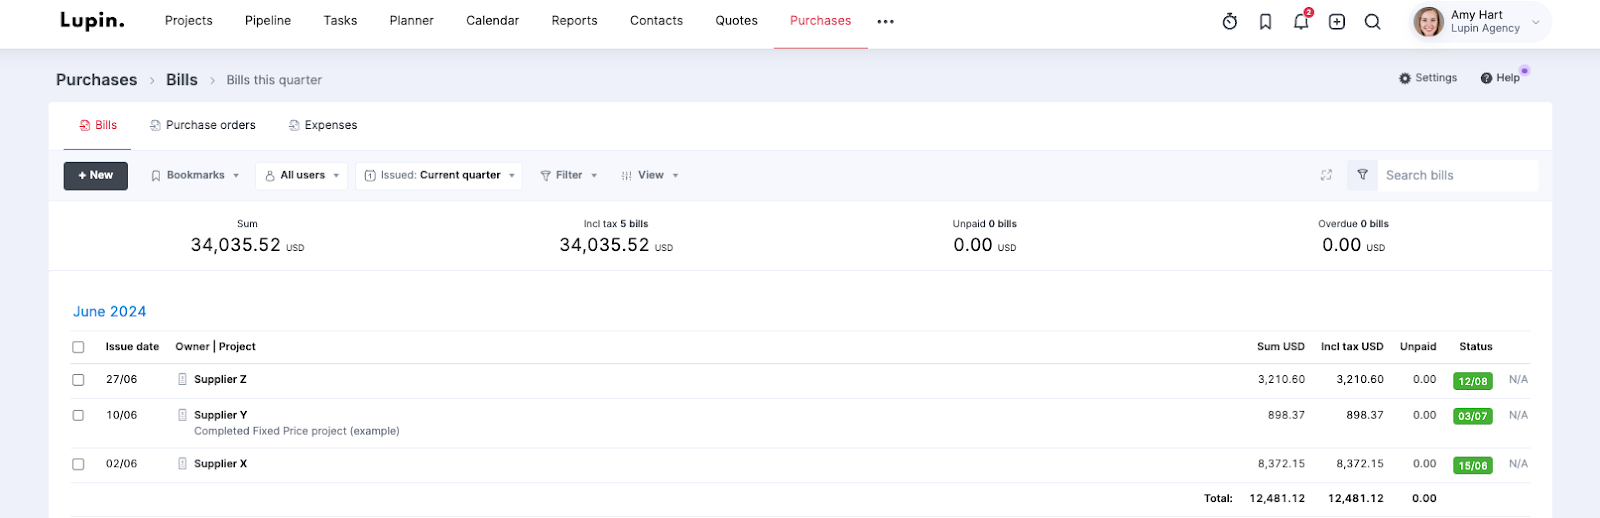
In Scoro, click on the “Purchases” module and then select either “Bills” or “Expenses” to log an external cost.
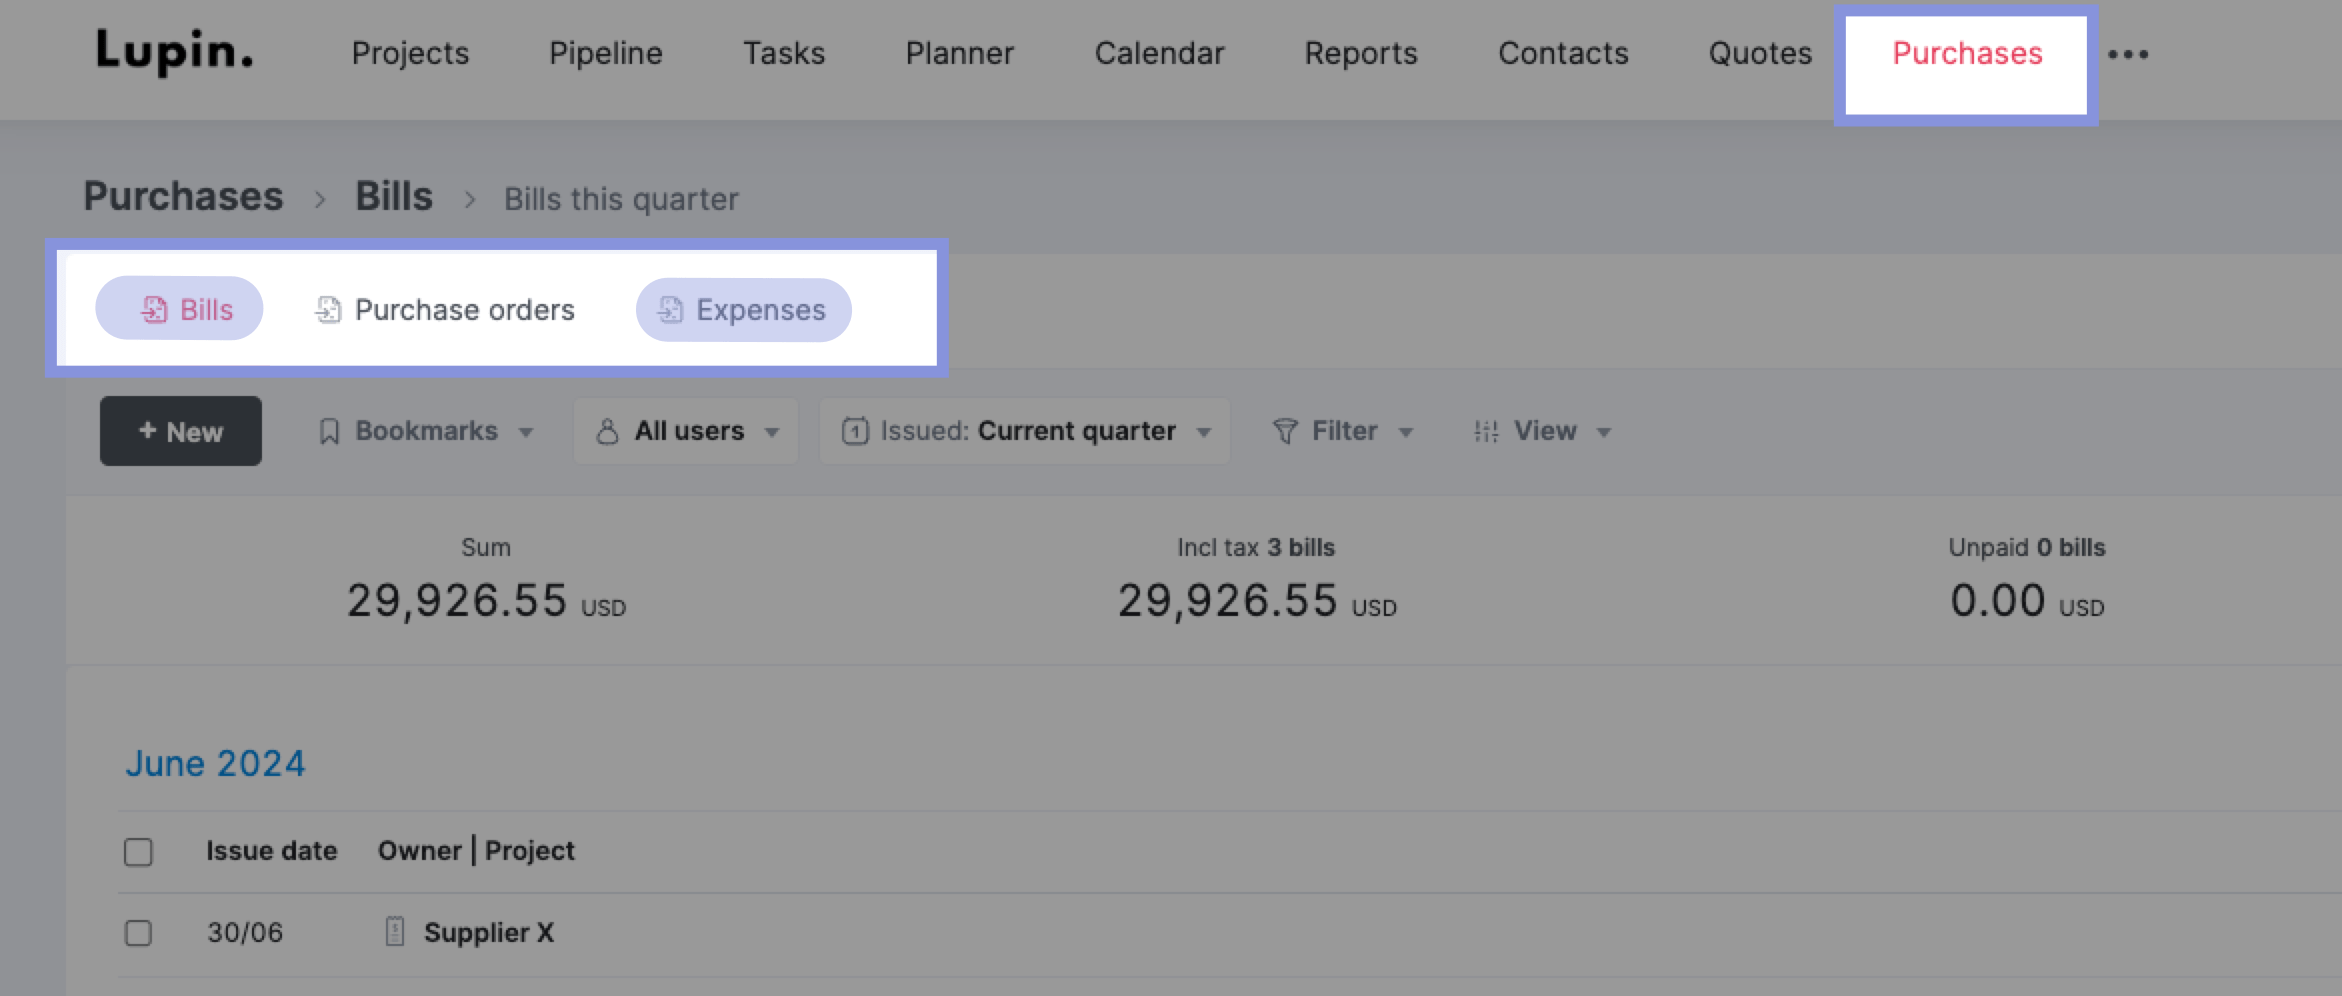
Click “+ New.”
Next, fill in the relevant details for the expense. If any team member initially covered the expense with personal funds, mark it as reimbursable.
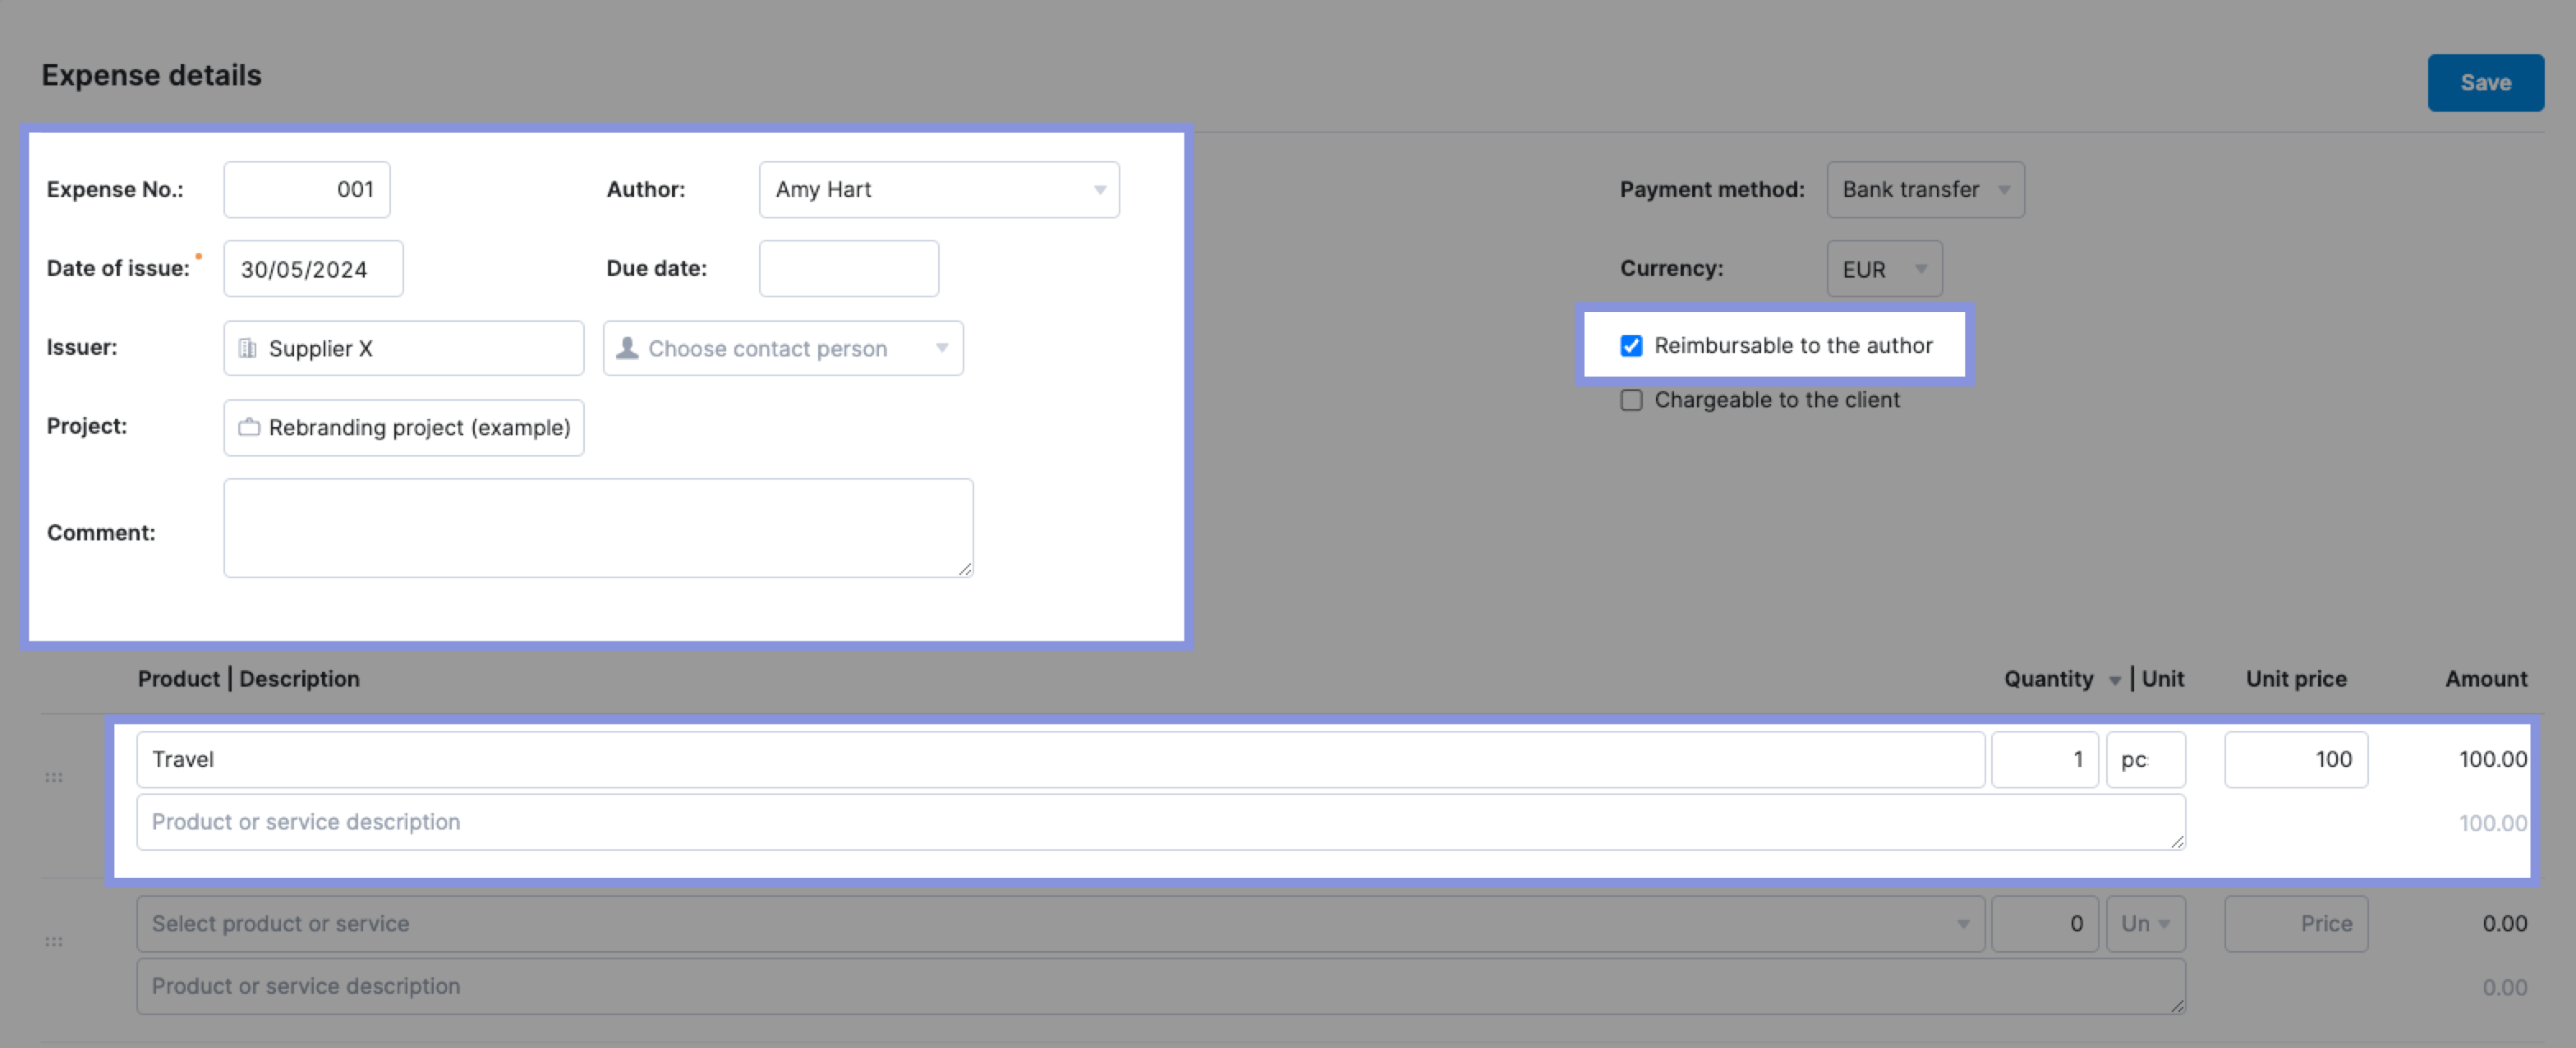
Top Tip
If your business uses Expensify, you can sync your data with Scoro to avoid duplicate work and save time. Scoro integrates with Expensify to automatically link expenses to the relevant project.
Lastly, Scoro can also help you track all supplier bills (invoices you receive from your suppliers) using the “Purchases” tab.
If you’ve already estimated the supplier fee when estimating the cost of your project, you can use the data on your quote to automatically generate a bill.
Head to “Quotes” and scroll down. Select “Use data on quote to…” and then select “Create bill.”
Scoro will then use the details from the quote to populate fields in the “Bill” window.
Top Tip
Scoro also integrates with accounting software like Quickbooks and Xero to automatically import real-time invoices.
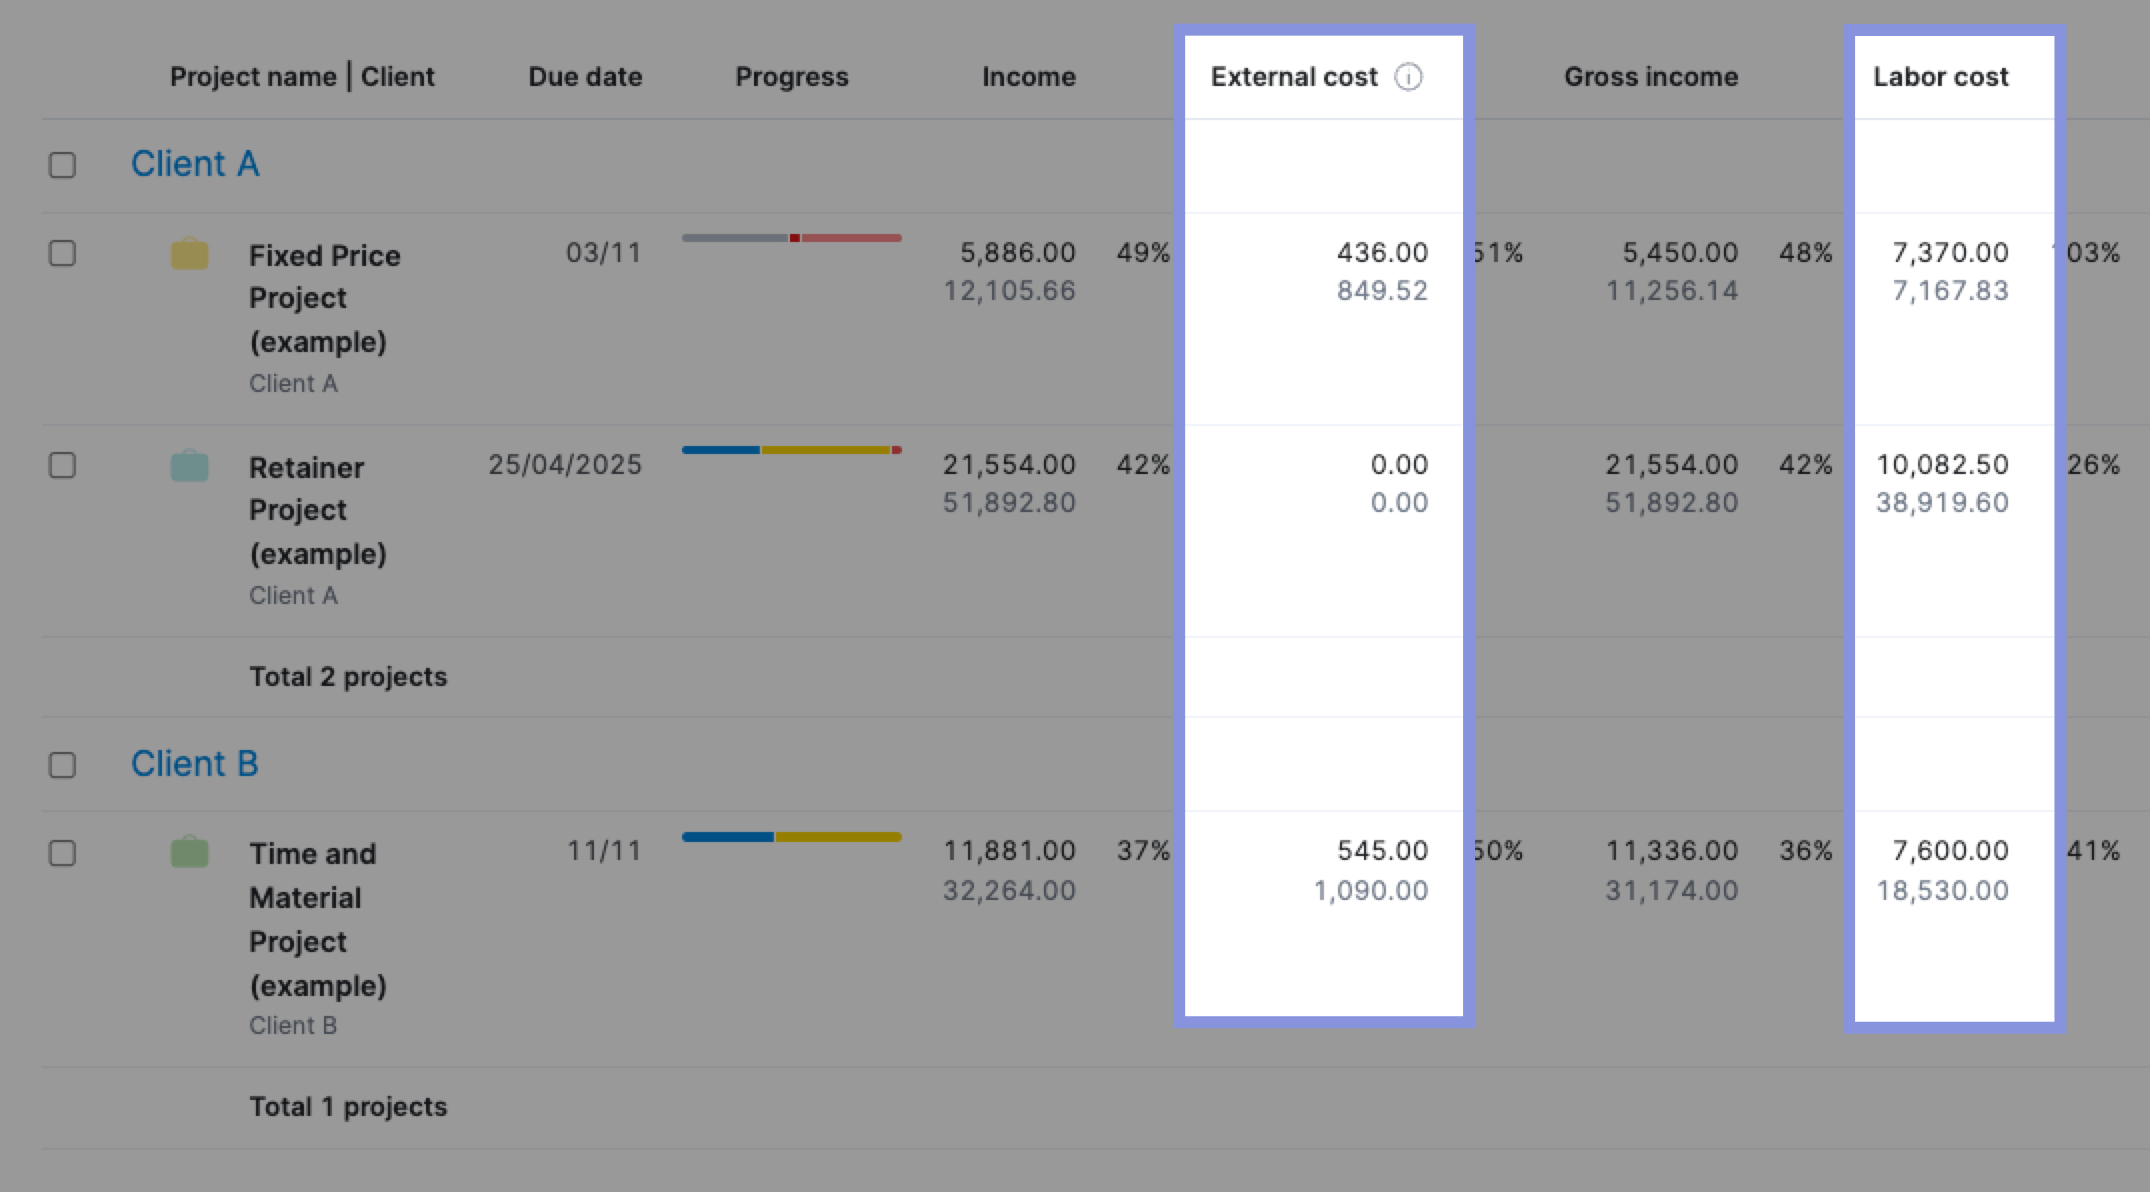
Scoro’s “Project list” view displays labor costs, expenses, and bills together.
To access it, click “View” > “Data columns” and select “Labor cost” and “External costs.“
Note: “External costs” in Scoro include both bills and expenses for each project.

You will then see each project’s total external costs (bills and expenses) and labor costs.
Further Reading: Project Cost Estimation: A Guide to Quoting Profitable Projects
3. Calculate your gross profit
Now, subtract your external costs (bills and expenses) from your project revenue to calculate the gross project profit.
Gross profit reveals the raw profitability of your project, independent of labor costs and other operational expenses. It’s the revenue remaining after covering the direct costs of delivering the project – expenses and bills.
Simple formula:
Gross Profit = Total Revenue – (Expenses + Bills)
Suppose your project generates $50,000 in revenue, with $2,500 in expenses and $6,000 in bills. The external costs in this scenario are $8,500 (expenses + bills).
Your gross profit would be $41,500 ($50,000 – $8,500).
Not including labor costs gives you a clearer picture of your project’s fundamental profitability and whether it generates enough revenue to cover its labor costs.
If gross profit is low or negative, your pricing might be too low or your expenses too high for the scope of work.
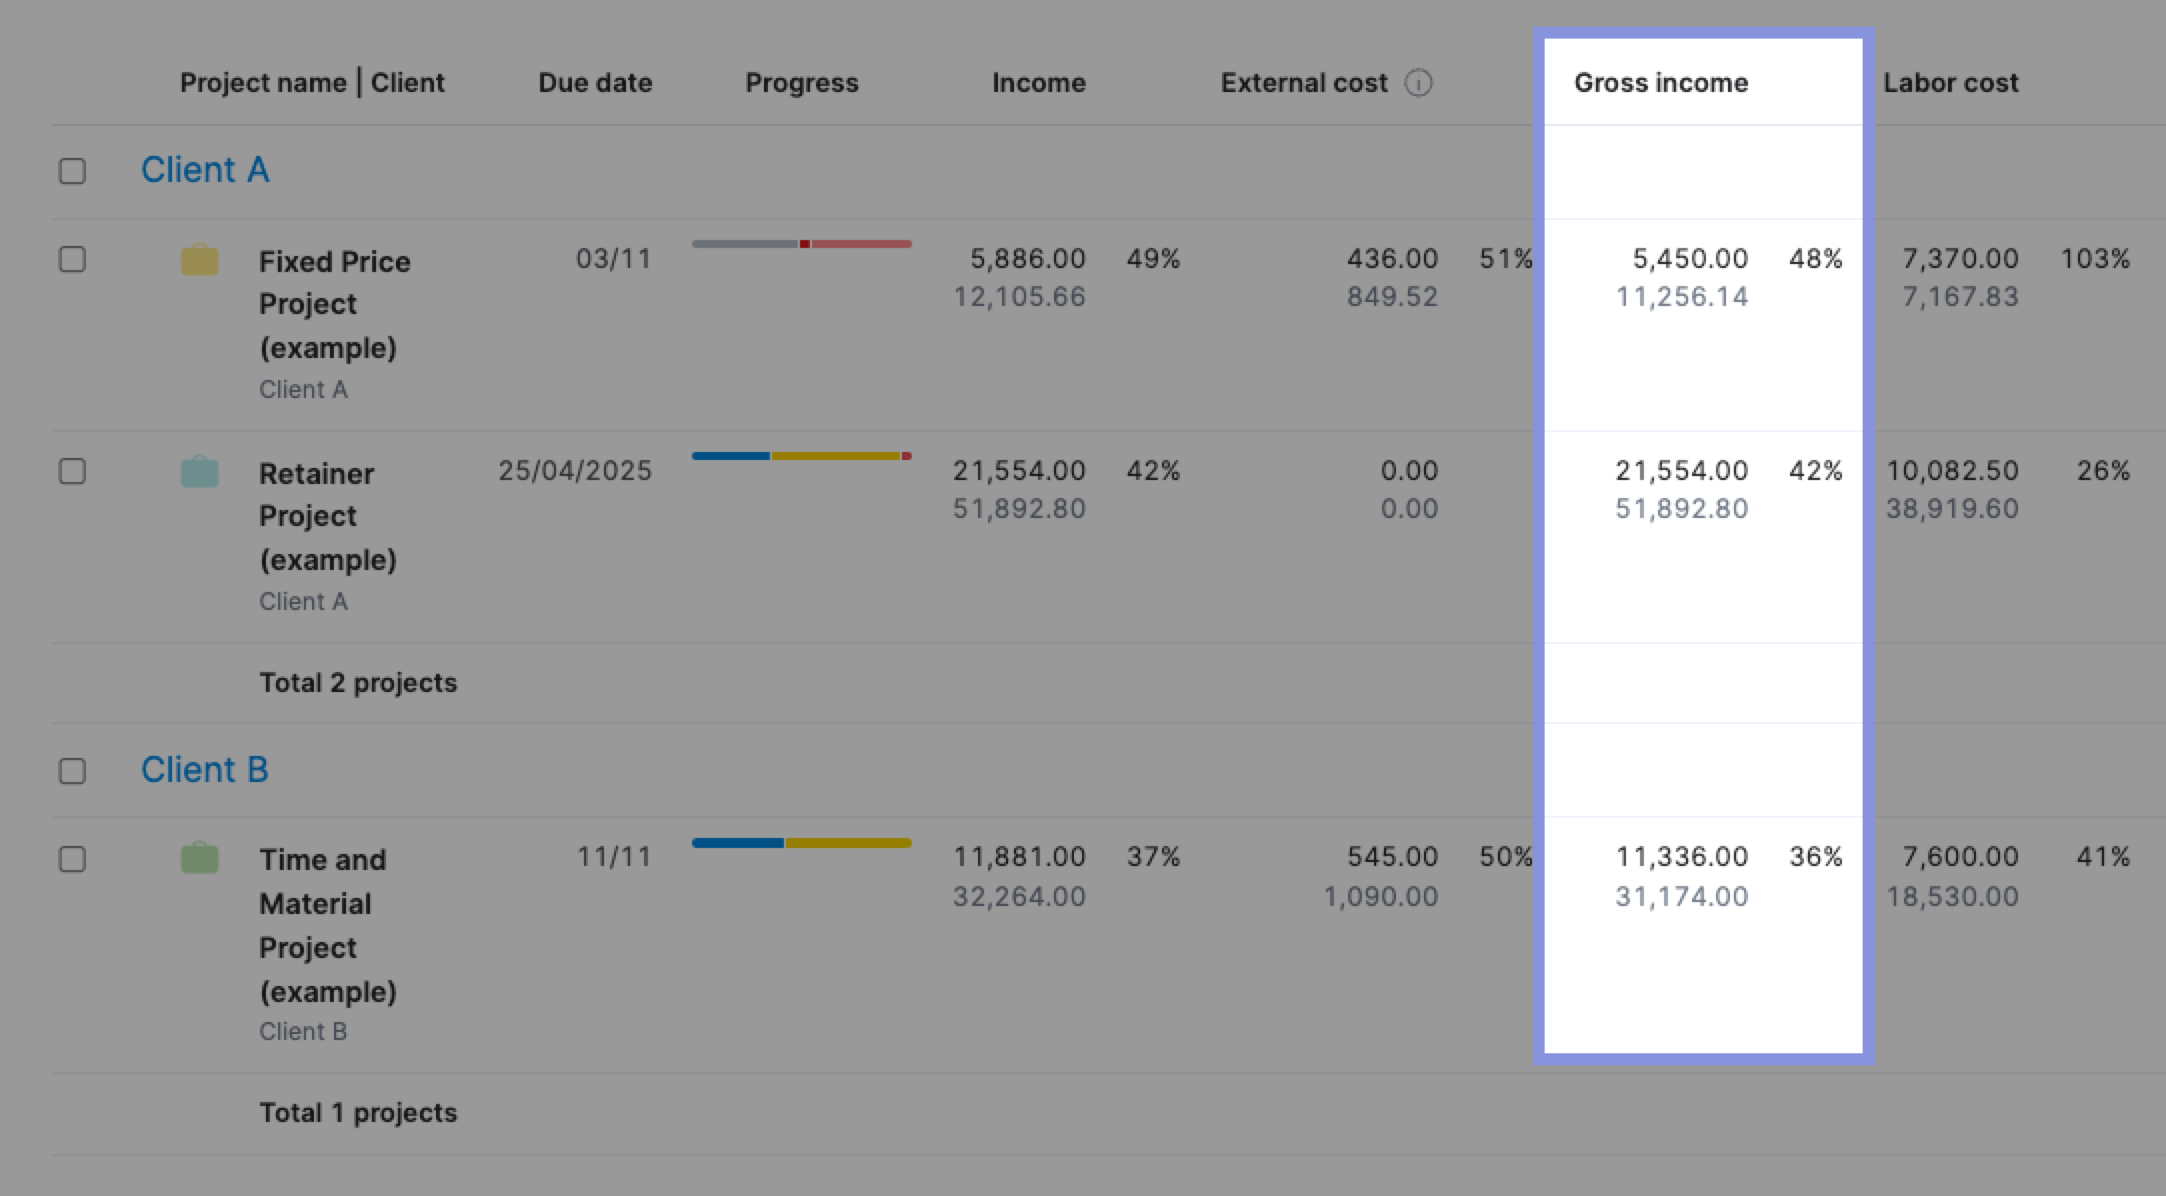
In Scoro, you can add the “Gross Income” column to your “Project list” view to see the gross profit for each project.
4. Calculate your project profit
After calculating gross profit, factor in labor costs and determine your project’s net profit. This metric reveals the actual profit your business earns after all costs, including labor, have been accounted for.
The project profit formula:
Project Profit = Gross Profit – Labor Costs
Let’s revisit our previous example:
- Total Revenue: $50,000
- Expenses: $2,500
- Bills: $6,000
- Labor Costs: $20,000
First, calculate Gross Profit: $50,000 – ($2,500 + $6,000) = $41,500
Then, calculate Project Profit: $41,500 – $20,000 = $21,500.
Project profit is the ultimate measure of your project’s financial success. It tells you the exact amount of money your business has earned after all expenses have been paid.
This information is crucial for:
- Assessing overall profitability: Understand how much each project contributes to your bottom line after accounting for all costs.
- Evaluating project performance: Compare the profitability of different projects to identify which ones are most successful.
- Making informed decisions: Use project profit data to guide future project selection, resource allocation, and pricing strategies.
Enabling the “Project profit” column in the “Project list” view in Scoro instantly shows the profit for each project.
5. Calculate your delivery margin
Your delivery margin (also known as profit margin) reveals the percentage of revenue that’s pure profit after accounting for labor and external costs.
It’s calculated as:
Delivery Margin = (Project Profit / Total Revenue) * 100%
Delivery margin allows you to:
- Compare apples to apples: Accurately compare the profitability of different projects, regardless of size or budget.
- Make smarter decisions: Identify the most profitable project types and clients to focus your efforts.
- Optimize pricing: Set prices that consistently achieve your target profit margins.
- Spot red flags: A low delivery margin could indicate budget overruns, scope creep, or inefficient resource allocation.
You can use Scoro to calculate delivery margins for all your projects automatically. Go to your “Project list” view. Ensure the “Delivery margin” option is enabled from the “Data columns” drop-down menu.
Now, you can see your estimated delivery margin in gray alongside your actual delivery margin, displayed in bold.
But what’s a good delivery margin?
Every company is different; Parakeeto Founder and CEO Marcel Petitpas recommends aiming for a delivery margin of:
- 60-70% per project: This ensures your projects generate enough profit to cover other business expenses not included above (like overhead) or due to inefficiency in your processes.
- At least 50% overall: This is a good target for your agency’s overall quarterly or annual profit margin after accounting for all expenses, including overhead.
Further Reading: Calculating Agency Margins: A Beginner’s Guide
Top Tip
Delivery margin shows project profitability, but your bottom line is net profit after ALL expenses. Integrate Scoro with your accounting software (Quickbooks, Xero, Sage Intacct) to track all project costs and get the full financial picture.
Boost project profitability with Scoro
If you’re consistently hitting your delivery margin goals, congratulations! Keep up the great work, and continue monitoring your projects to maintain this level of profitability.
But if your profit margins aren’t meeting your targets, don’t panic!
Scoro’s powerful reporting and filtering capabilities can help you pinpoint the root causes. The “Project list” view allows you to analyze project profitability by client, project manager, project type, and more to identify areas for improvement.
In this guide, we’ll compare some of the best project management software that help you manage tasks, collaborate with your team, and manage resources.
Key project management features to look for
Consider these key features when evaluating the best software for project management:
- Project management: Task organization features like Kanban boards for visual project status and easy task reassignment
- Gantt charts: Visual project roadmaps showing tasks, timelines, assignments, milestones, and dependencies
- Resource management: Tools to allocate and track resource utilization, preventing overallocation and burnout
- Time tracking: Built-in time tracking for accurate billing and payments based on work completed
- Reporting and analytics: Dashboards to uncover trends, form insights, and guide decisions
- Collaboration tools: Features supporting seamless communication among team members
- Integrations: Extend functionality by linking with other software, enabling streamlined workflow
Considerations when selecting the best project management tool
Every tool has its strengths and weaknesses. Consider the specific needs of your team and projects when selecting a project management tool. Some key considerations include:
- Team size: Different tools cater to varying team sizes—if you’re a small team, you may only need straightforward task management. Larger teams might need more advanced features like resource allocation and project cost management.
- Industry: Select a tool that aligns with your industry’s best practices and specific requirements. For example, marketing agencies will need a project management tool to manage client retainers.
- Flexibility vs structure: Agile teams may prefer tools with Kanban boards and iterative planning features, and traditional projects may benefit from visual project planning using Gantt charts.
- Budget: Consider upfront costs, long-term value, scalability, and additional expenses when assessing pricing models.
- Ease of use: A tool’s ease of use directly impacts your team’s adoption rates and overall productivity. Look for an easy-to-use tool for smooth team adoption and increased productivity.
Project management tool comparison: 11 popular software to consider
Now, let’s run through some of the best project management tools.
1. Scoro
Scoro is an all-in-one work management system build for agencies and consultancies. It combines project and work management with time tracking, invoicing, and financial reporting. It offers a centralized platform for consultancy and agency firms.
You can use the “Gantt” tab for each project to plan out tasks and milestones, track project progress, and identify timeline discrepancies. If certain tasks run over time, you can easily adjust deadlines and replan on the go to respond to changes and keep the project on track.
Equally powerful, Scoro’s “Budget” tab gives you insights into a project’s time and monetary data. For example, the “Burn-up” chart shows your project’s time budget consumption over time. Helping you monitor the rate at which your team utilizes the allocated hours for the project.
The chart is always visible in the “Budget” section and shows data as soon as you have set a start and an end date for the project or planned some tasks.
For a deeper dive into project financial data, the “Quoted vs Actual” table within the same section offers granular insights into real-time project profitability.
It helps you to track:
- how many hours worth of budget you still have left
- whether completed work has been invoiced and payments received
- how much you’ve already spent and whether each service is progressing within budget
- how much profit the project has generated, i.e. whether you got the expected margin for each service or should you adjust your price or time estimates next time
All this project-level time and financial data can help you better understand estimated versus actuals in real-time. Helping you fight scope creep and reallocate resources smartly to stay within the budget.
What you’ll love
The portfolio management feature helps you monitor and manage multiple projects simultaneously.
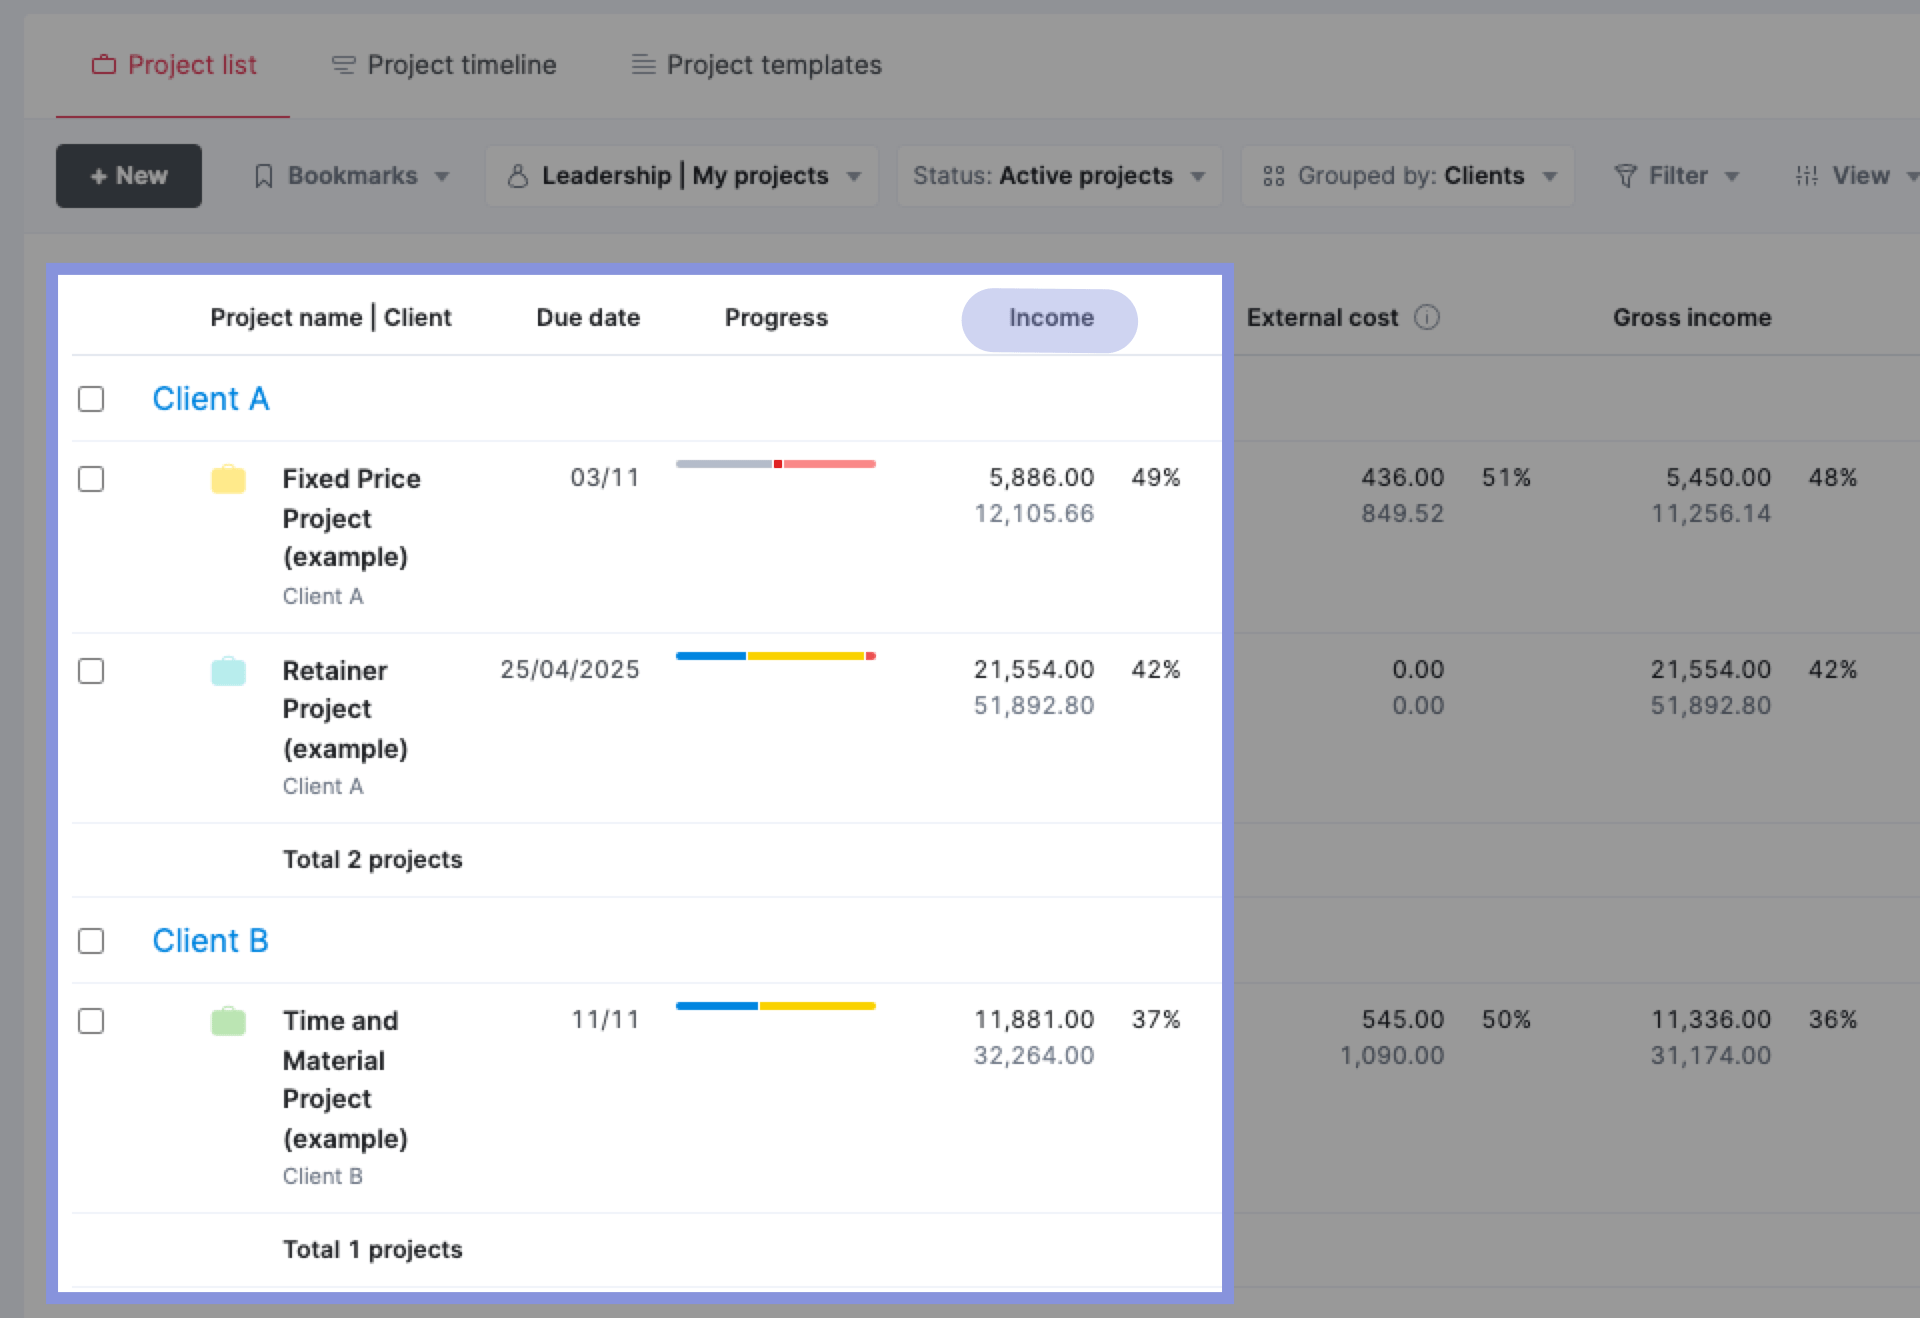
The “Project list” view gives you an instant snapshot of progress, income, labor costs, external costs, project profit, and status at a glance.
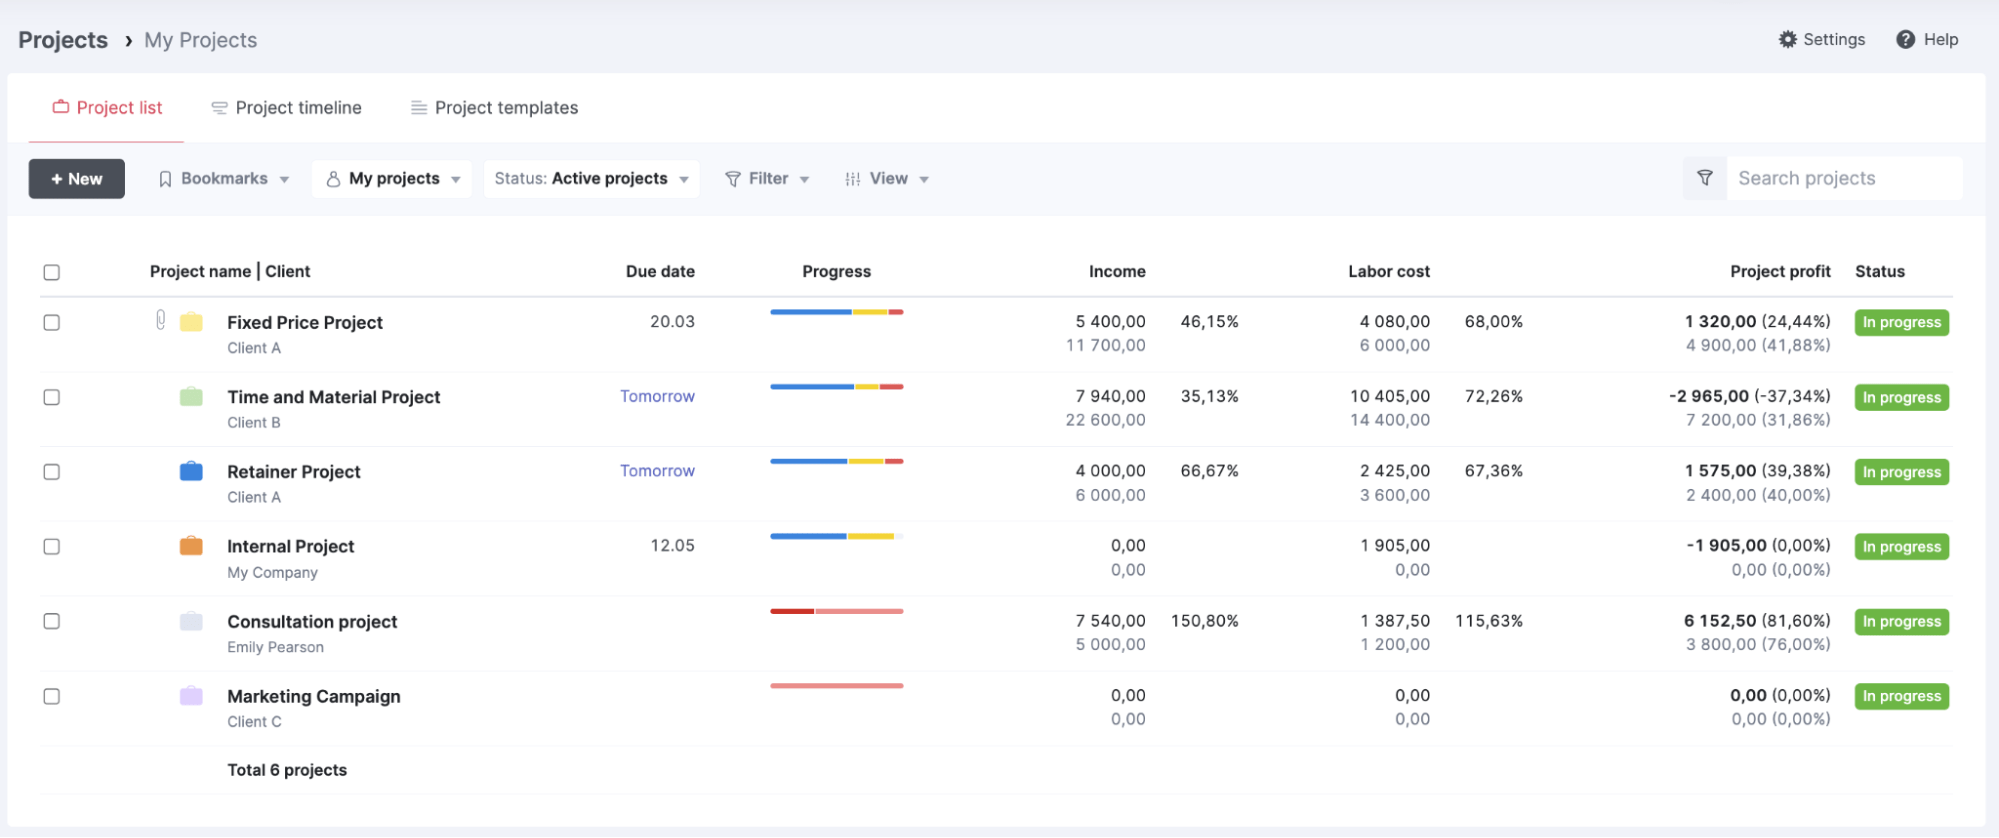
You can filter and group the list in various ways to slice it and dice data whichever way you want to (e.g. by status, clients, project managers, dates, tags, etc).
You can also use the “Project timeline” tab to gather all your future and in-progress projects into one visualized graph to give you the ability to zoom out and see the bigger picture.
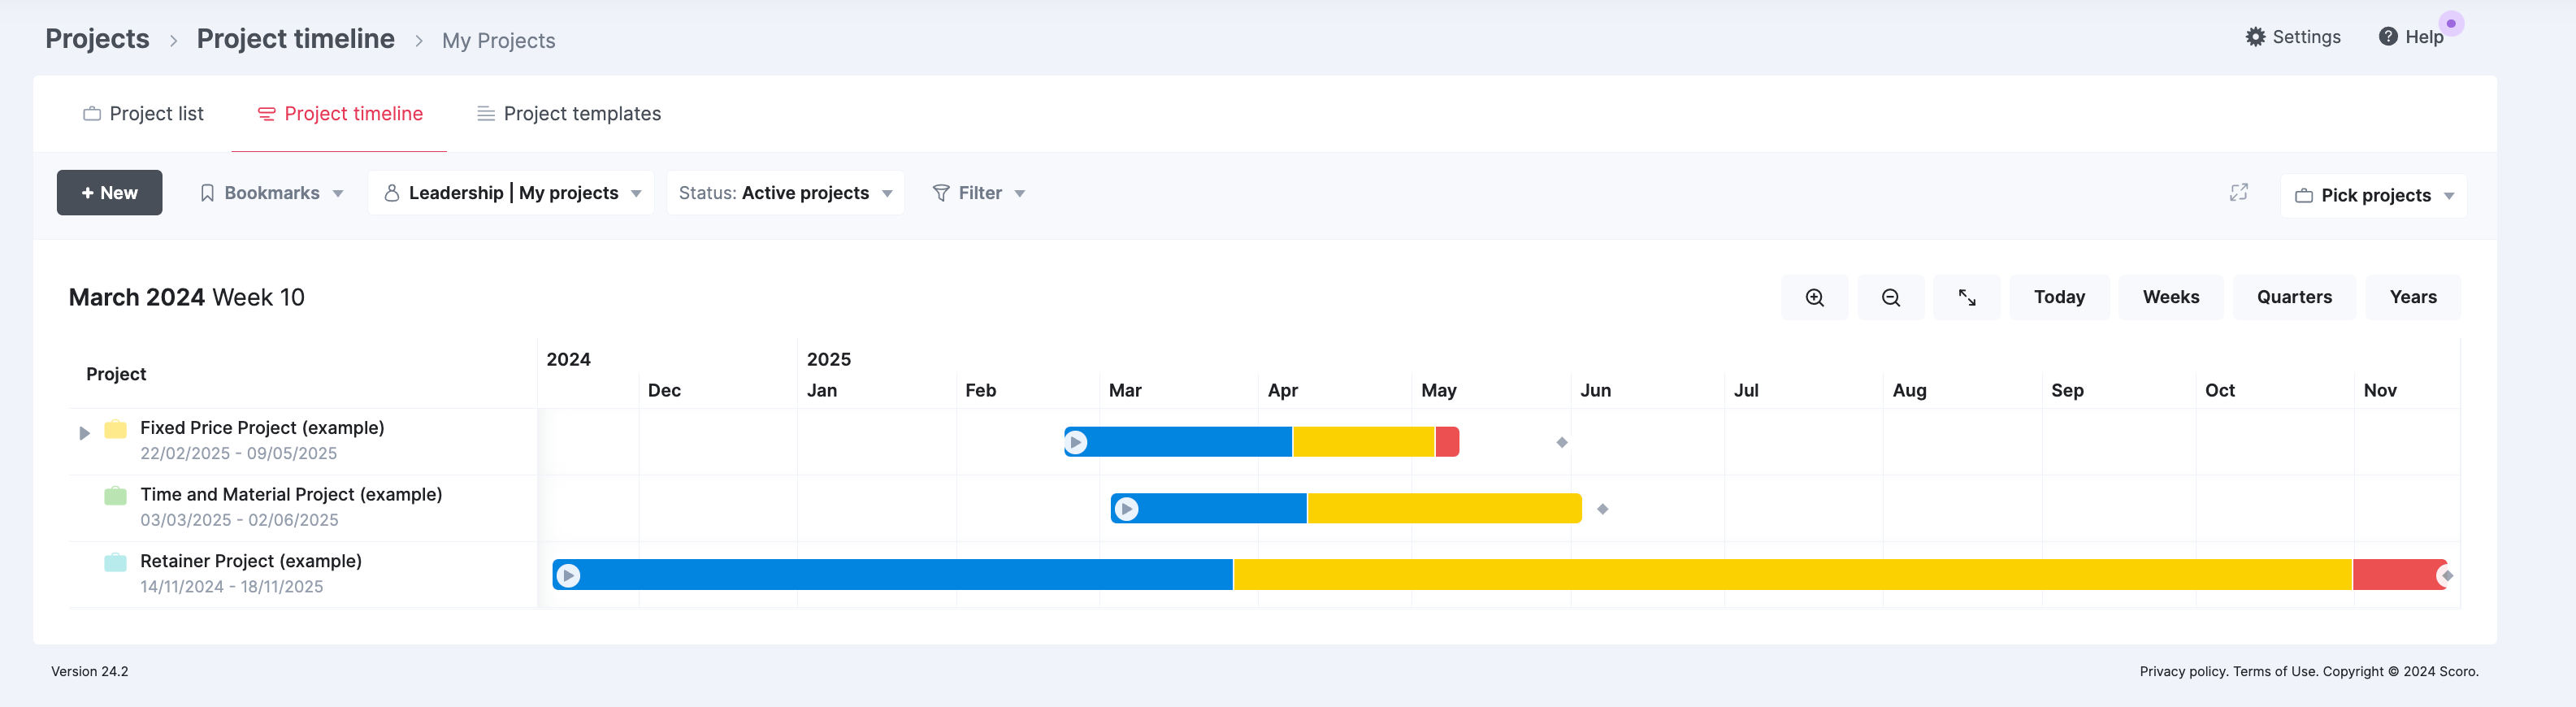
All your projects automatically appear on the “Project timeline.” The left-hand side of the table displays all selected projects along with their start dates, end dates, and deadlines.
Core features of Scoro you’ll like
- Retainer agreements for ongoing collaborations with clients by setting up long-term agreements
- Project quote builder to create accurate project cost estimates based on phases and tasks
- Team labor rates for precise project budgeting and profitability analysis
- Project expense management to help you keep costs under control
- Resource tools to help you accurately forecast and balance workloads
- Time tracking and timesheet options for keeping an eye on where your team time is going
- Sales CRM dashboard to keep track of client proposals
- 50+ report templates to analyze various aspects of project performance, including productivity, utilization, revenue, and profitability
Pricing
Scoro has four plans:
- Essential: $26 per user per month
- Standard: $37 per user per month
- Pro: $63 per user per month
- Ultimate: customized enterprise pricing
You can also try Scoro free for 14 days.
2. ClickUp
ClickUp is an all-in-one project management and collaboration platform that brings teams closer together with connected workflows, docs, and real-time dashboards.
The platform provides tailored views for cross-functional projects to allow your team to visualize their work in various ways, including Gantt charts, timelines, lists, boards, and calendars.
Like Scoro, the “Gantt” chart view can help you easily map out project roadmaps with interactive timelines.
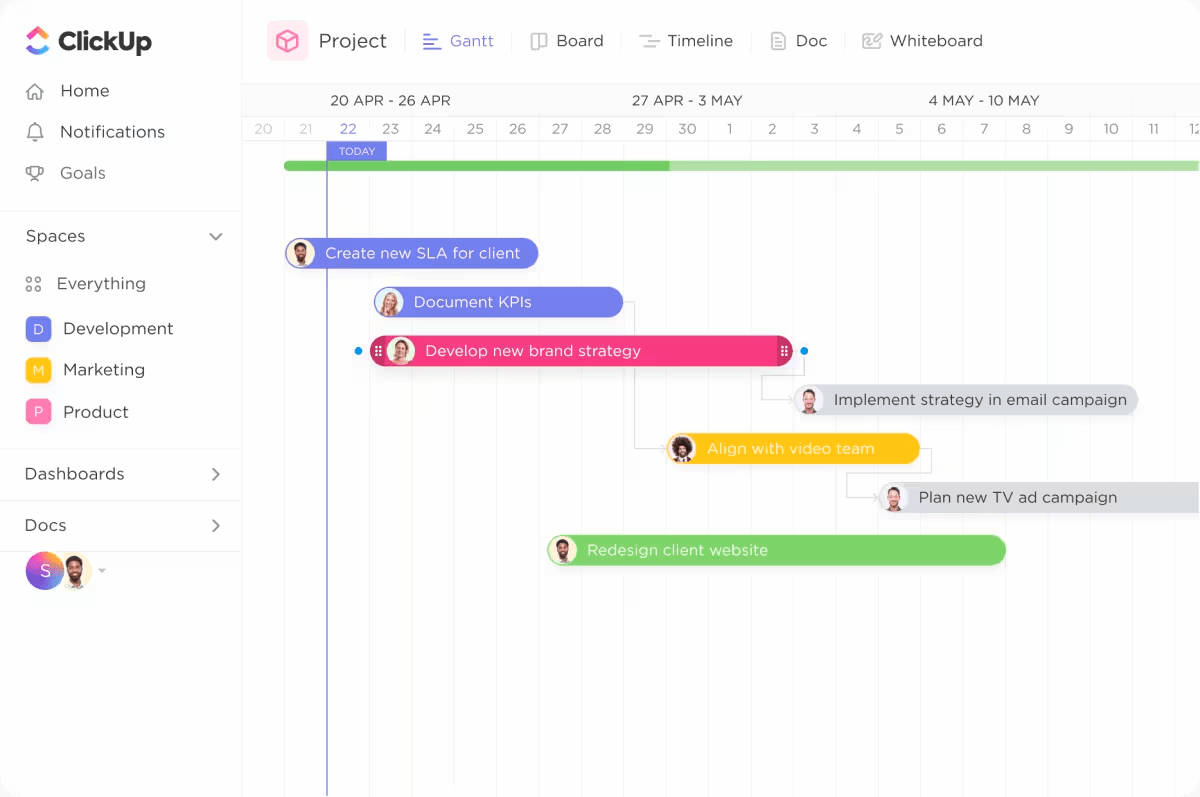
Here, you can manage dependencies, get progress percentages, make bulk edits, and reschedule groups of tasks.
For example, let’s say you’re managing a software development project using a Gantt chart. The project involves multiple phases, such as design, development, testing, and deployment. Each phase consists of several tasks assigned to different team members.
You realize that the design phase is taking longer than expected, and you need to adjust the start dates and durations of the associated tasks in bulk.
You can do this without leaving the “Gantt” chart view by:
- Hovering over the tasks you’d like to edit
- Clicking the task selector on the left side
- Use the “Multitask Toolbar” to make your edits
You can perform a number of actions on selected tasks, such as setting watchers, assignees, status, tags, start and due dates, priority, task types, milestones, dependencies, and custom fields.
ClickUp also makes project management easier with customizable dashboards and views to track project progress and keep an eye on your team’s productivity in real-time.
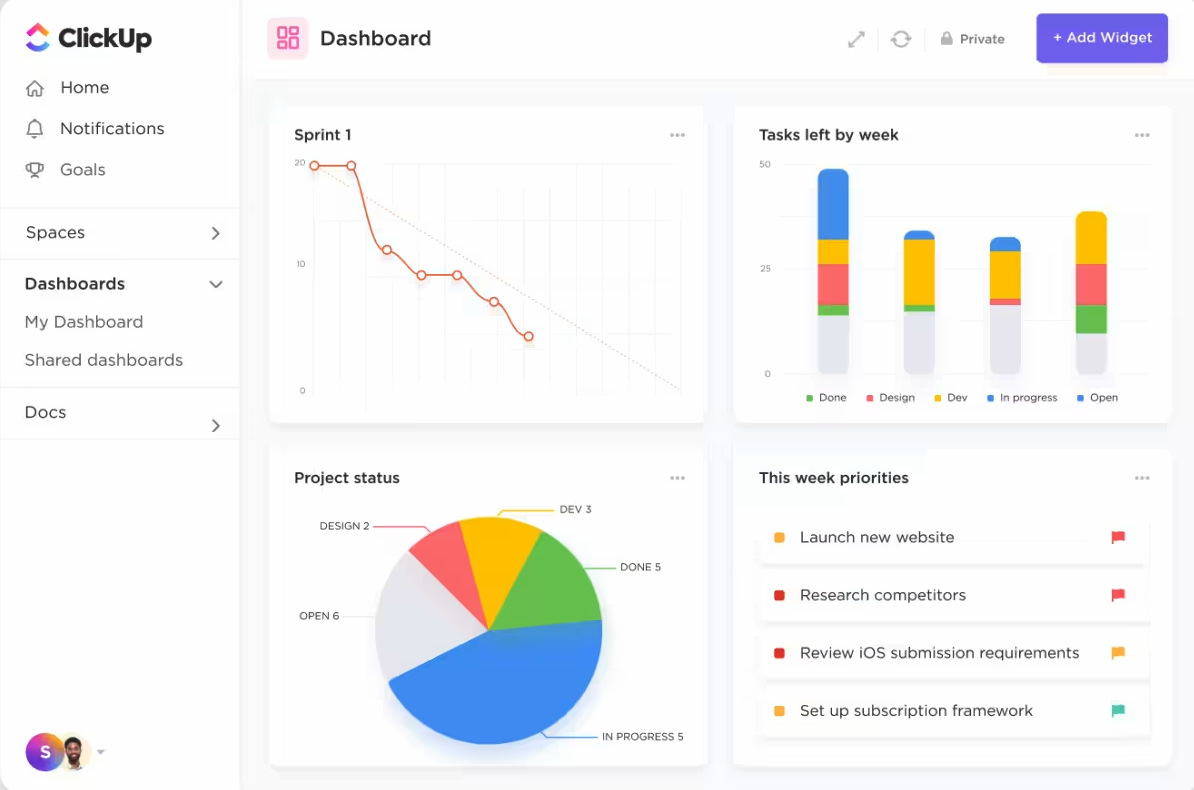
You can build fully customizable dashboards to gain high-level overviews and deeper insights into your projects. You can choose from over 50 widgets to create the perfect dashboard for your needs.
For example, use project dashboards to:
- Create a dashboard to provide a high-level overview of a project’s progress. Include widgets like a timeline displaying key milestones, a bar graph showing the percentage of tasks completed in each project phase, and a list of upcoming deadlines.
- Create a dashboard to visualize how resources (e.g., team members, equipment, budget) are being allocated across projects. A table widget displays project names, assigned resources, and allocation percentages.
- Build a dashboard to track progress against key goals and objectives. Use widgets like a goal progress bar showing each goal’s completion percentage and a line graph visualizing goal progress over time.
What you’ll love
ClickUp’s advanced automation capabilities streamline workflows by setting custom actions and triggers.
Access the “Automations” menu within a “Space,” “Folder,” or “List,” selecting from pre-set templates or creating custom workflows to meet the unique demands of your project.
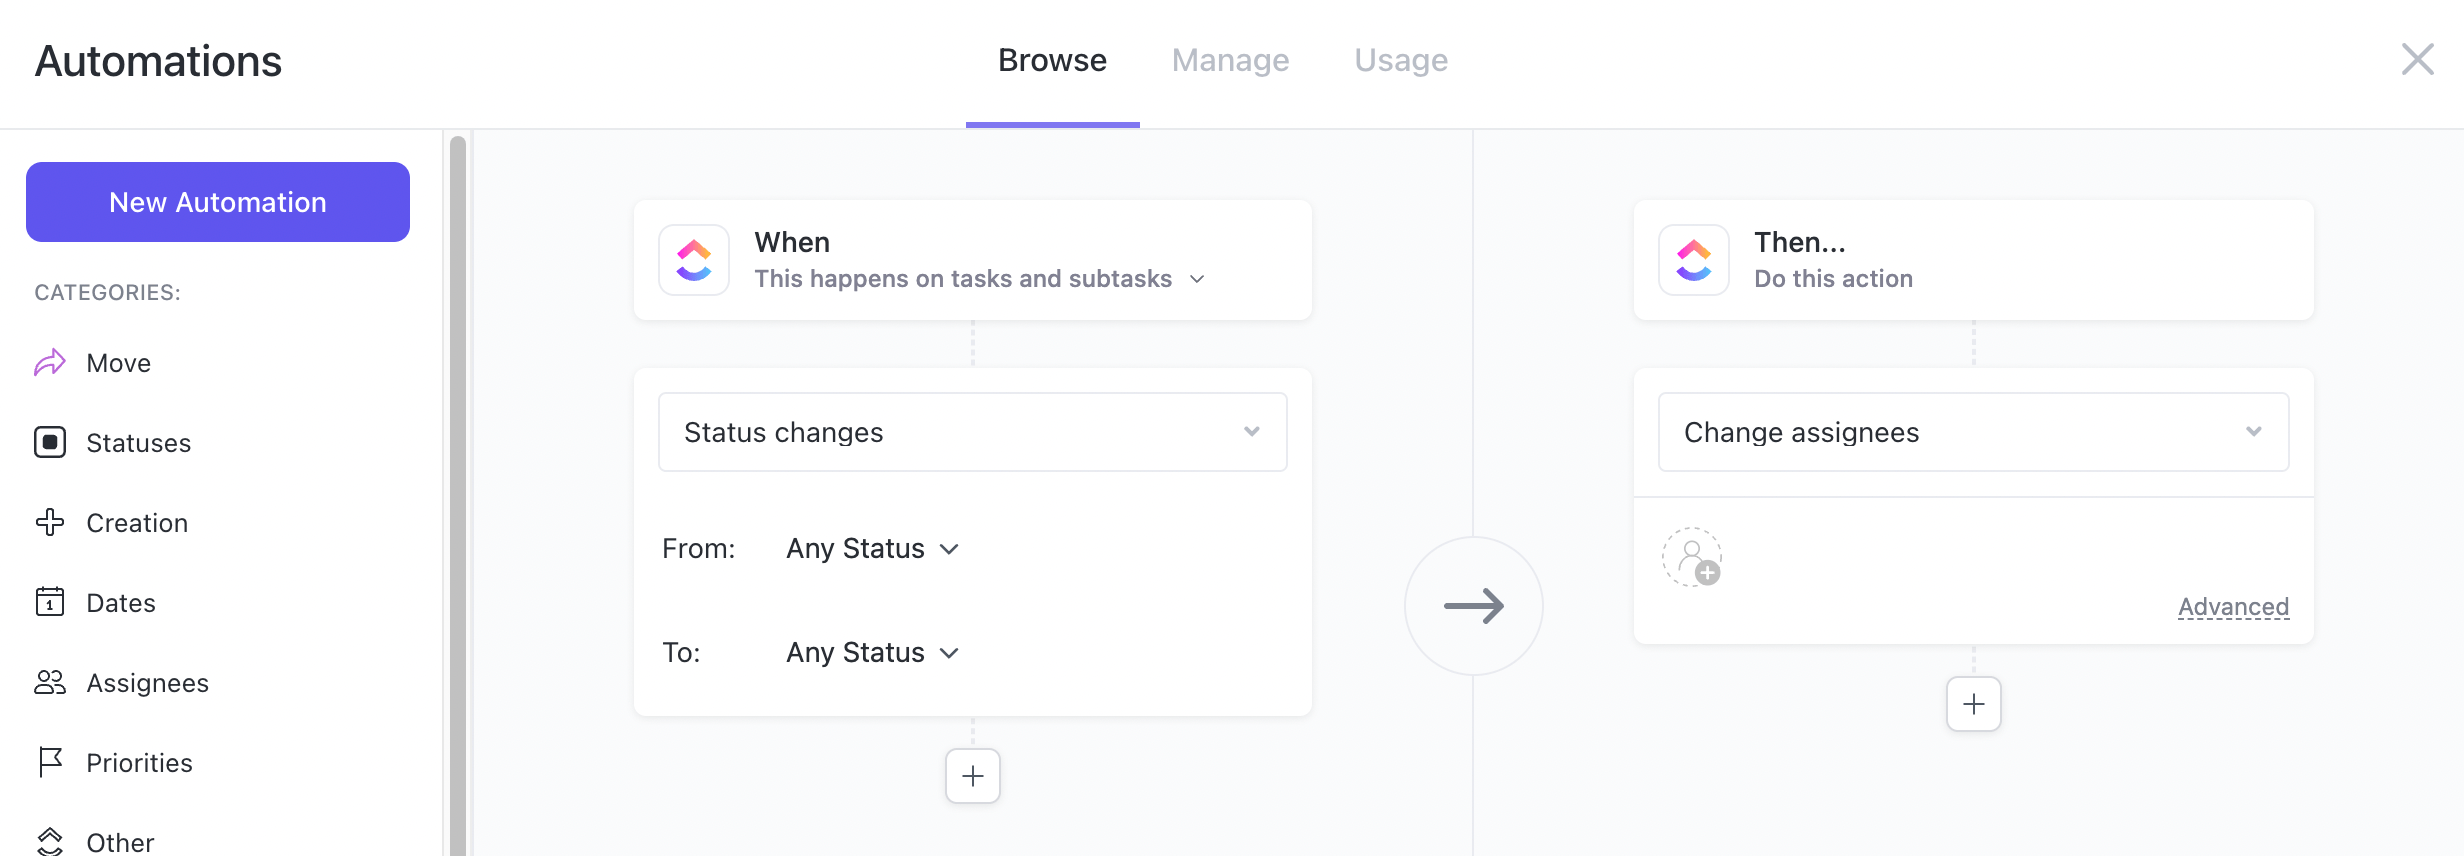
Choose from 100+ pre-built automations to create new tasks and implement clear SOPs across your team quickly. Customize these automations based on your needs; your team can concentrate on what matters most.
For example:
- Escalate the priority level of a task if it remains incomplete past a certain deadline
- Send automatic notifications to stakeholders when a task status changes
- Assign team members to new tasks based on their roles
Core features of ClickUp you’ll like
- Tasks to manage and organize project tasks and backlogs
- Docs to collaborate on project documentation and notes
- Whiteboards to brainstorm and visualize ideas with the team
- Permissions to control access and visibility for different team members
- Automations to streamline workflows and reduce manual work
- Custom views to create personalized views of project data, such as Lists, Boards, and Gantt charts
- Forms to capture project requests, feedback, and surveys using customizable forms
- Dashboards to get a high-level overview of project progress and key metrics
Pricing
ClickUp has four plans:
- Free
- Unlimited: $7 per user per month
- Business: $12 per user per month
- Enterprise: customized enterprise pricing
3. Monday
Monday is a comprehensive project management tool with features like goals, resource management, Gantt charts, and reports to help teams plan, execute, monitor, and evaluate their projects.
Monday also utilizes Gantt charts to help you visualize project tasks, milestones, and dependencies within a set timeline.
The “Gantt” view provides an at-a-glance understanding of your project’s status and details and makes it easier to identify potential bottlenecks and overlaps in the schedule.
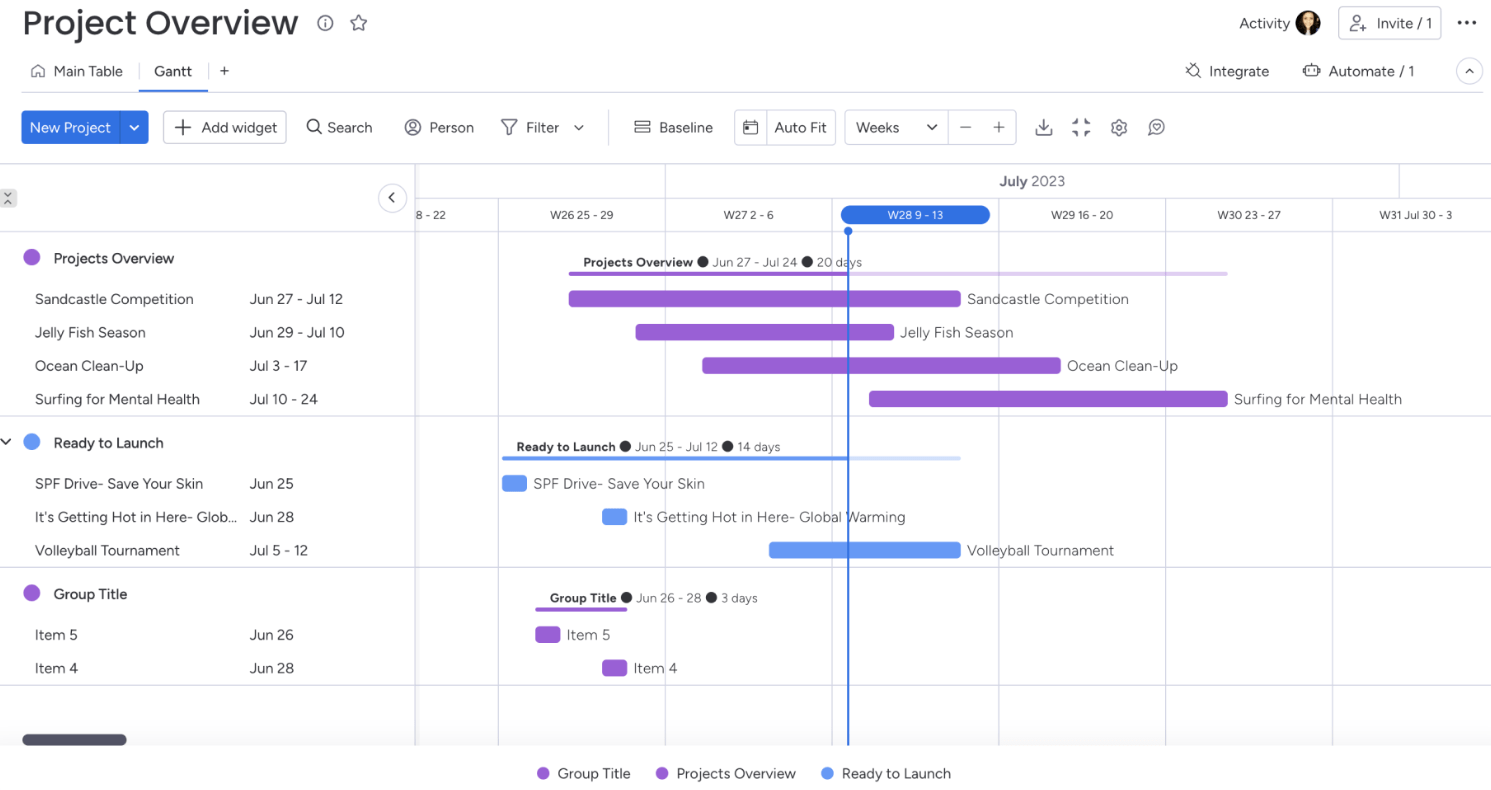
The “Dependencies” feature visualizes dependencies between your items with arrow lines. Identify tasks that are behind schedule and are preventing the project from being completed on time.
The arrows highlight the connections between tasks, but you can easily remove them with the click of the “Show Dependencies” option in the “View Settings” section in “Settings.”
For example, use “Dependencies” to immediately see how a delay in a new website project’s design phase could push back the coding phase’s start. Use this info to reallocate resources or adjust timelines to mitigate the impact on the project completion date.
Minimize project risk further with the “Critical Path” overlay and identify all the tasks your team needs to complete to finish a project on time.
To add the critical path, click on the cogwheel in the upper right corner of your Gantt. Scroll down to “Critical Path” and select “Show critical path.“
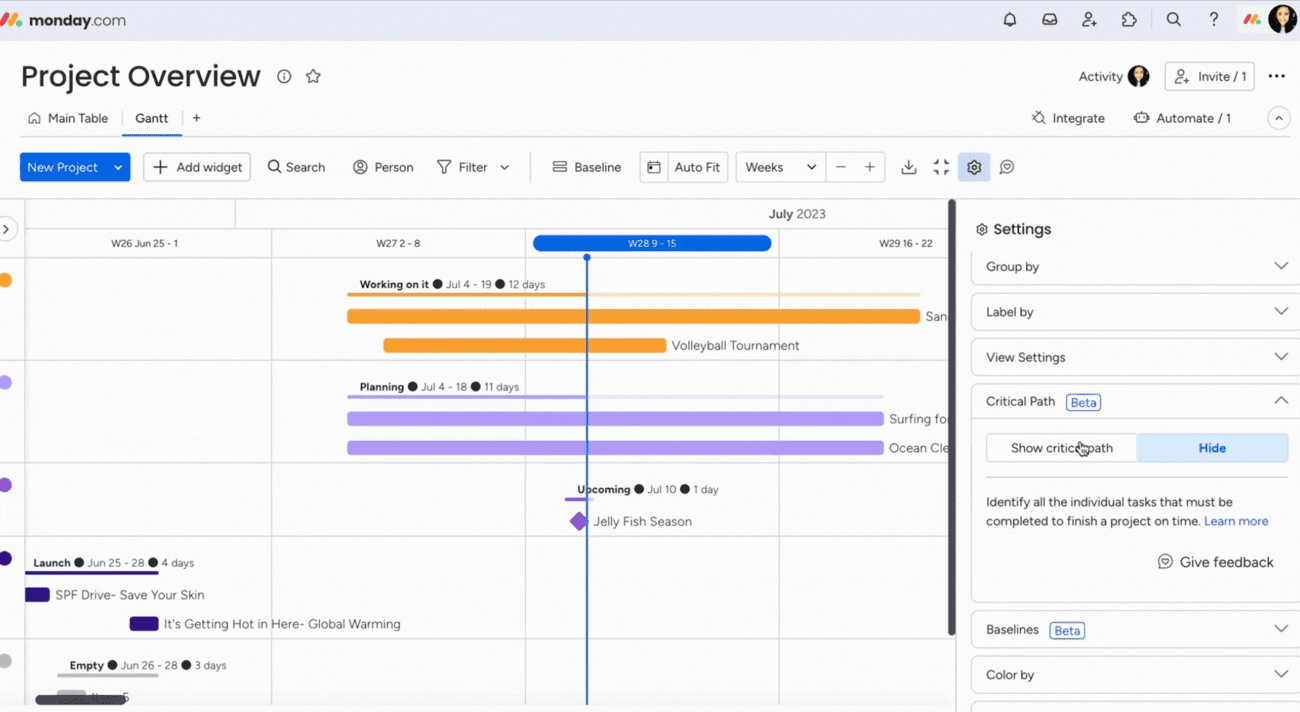
What you’ll love
Monday integrates with over 200 apps. Integrations with tools like Slack, Gmail, GitLab, Excel, DocuSign, and Google Drive make it easy to access everything in one place.
To add an integration, open “Monday Marketplace” and select the tool you want to connect.
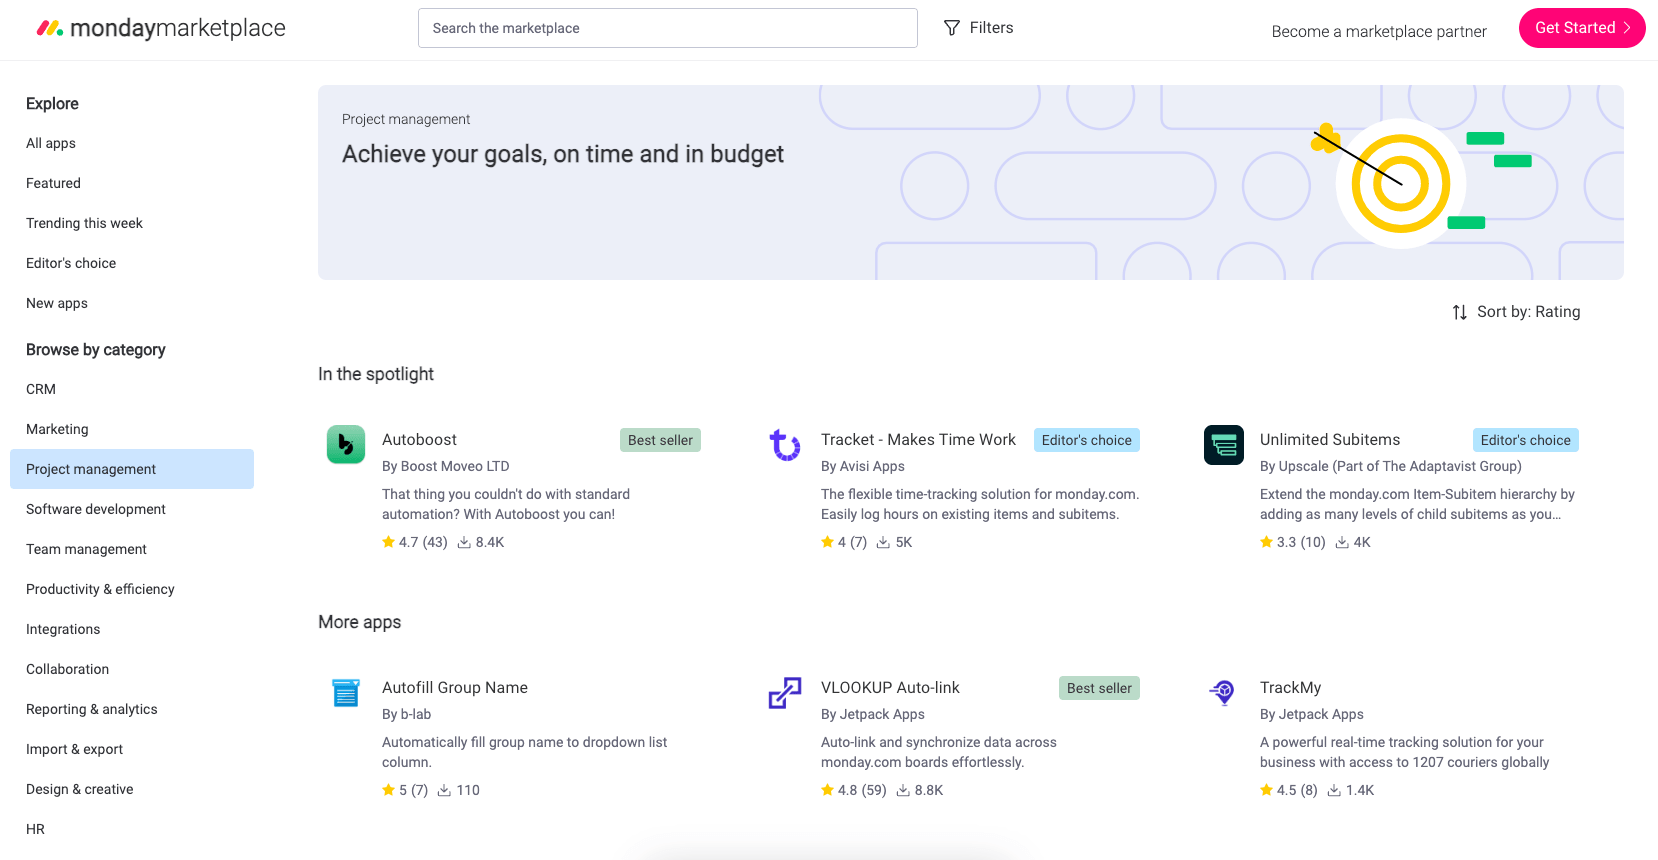
For example, integrate your board with:
- Slack to automatically post updates in a team channel when a task’s status changes. Keep your team informed and engaged without needing to leave their communication platform.
- Miro to streamline brainstorming and planning processes. Directly embed interactive Miro boards within tasks or projects.
- Crunchbase to enrich your business and market research. Pull detailed company information, funding rounds, and key people directly into your Monday.com board.
Core features of Monday you’ll like
- Customizable workflows to plan, execute, and track all kinds of work, from simple tasks to complex projects
- Multiple views, including Kanban boards, Gantt charts, calendars, timelines and more, to visualize work in different ways
- Dashboards to get high-level overviews, track progress, and gain insights across projects, teams, and departments
- Integrations with popular tools and apps to connect work across the organization
- Collaboration features like discussions, mentions, file sharing, and real-time messaging to enable teamwork
- Automations to streamline repetitive tasks, reduce manual work, and enforce processes
- Resource management to allocate resources, balance workloads, track utilization, and prevent burnout
- Project budgeting to create project budgets, track expenses, and monitor profitability
- Custom fields and forms to capture project information, requests, and data in a structured way
- Mobile apps to access work and update status from anywhere
Pricing
Monday has five plans:
- Free
- Basic: $9 per user per month
- Standard: $12 per user per month
- Pro: $19 per user per month
- Enterprise: customized enterprise pricing
4. Asana
Asana is another leading project management platform enabling teams to plan, organize, track, and manage work with flexible visual project views to suit each team’s needs.
Projects can be organized as boards, lists, timelines, calendars, or Gantt charts for deadline-driven tasks or ongoing operations.
For example, the “Board” View presents tasks as cards on a Kanban board. Organize work like sticky notes that you move from one stage to another. Customize the list with labels like “New,” “In Progress,” and “Complete” to suit your workflow.
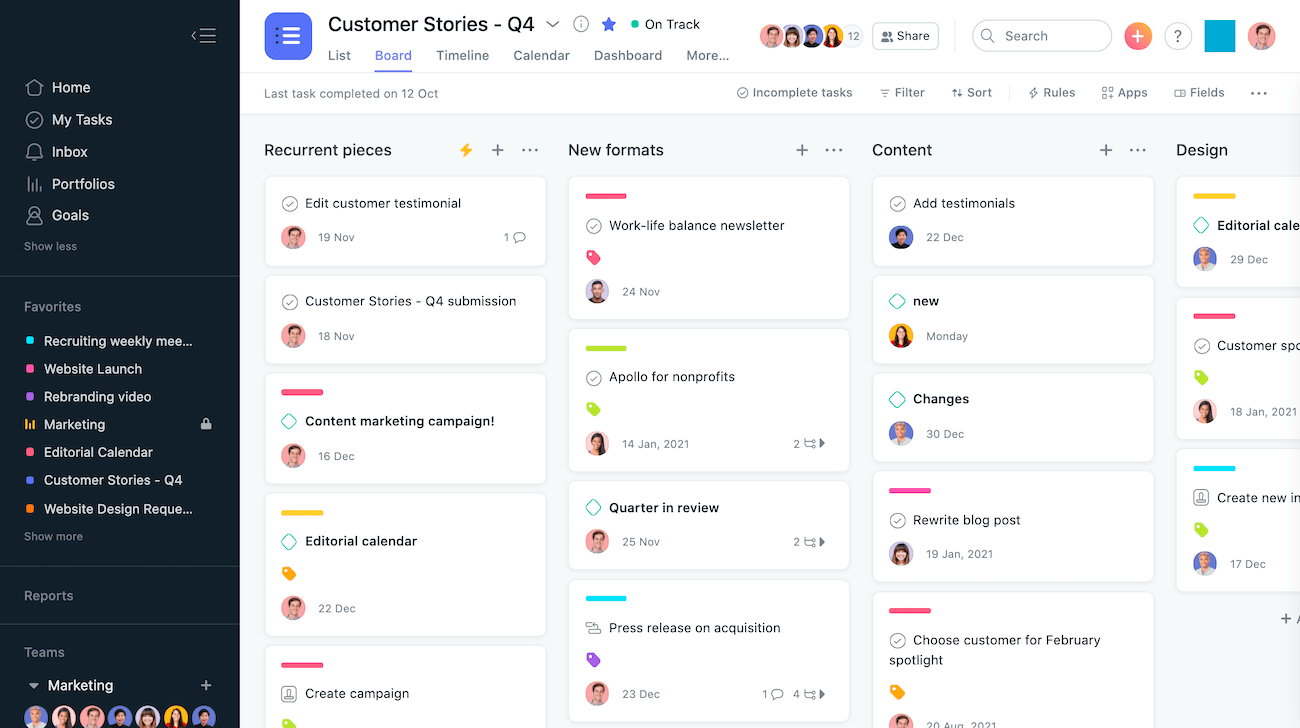
This helps teams to map their process by defining columns for each work stage. Team members can then drag and drop tasks between columns as they progress.
The “List” view provides a more traditional task list approach, where teams can capture every project step from start to finish.
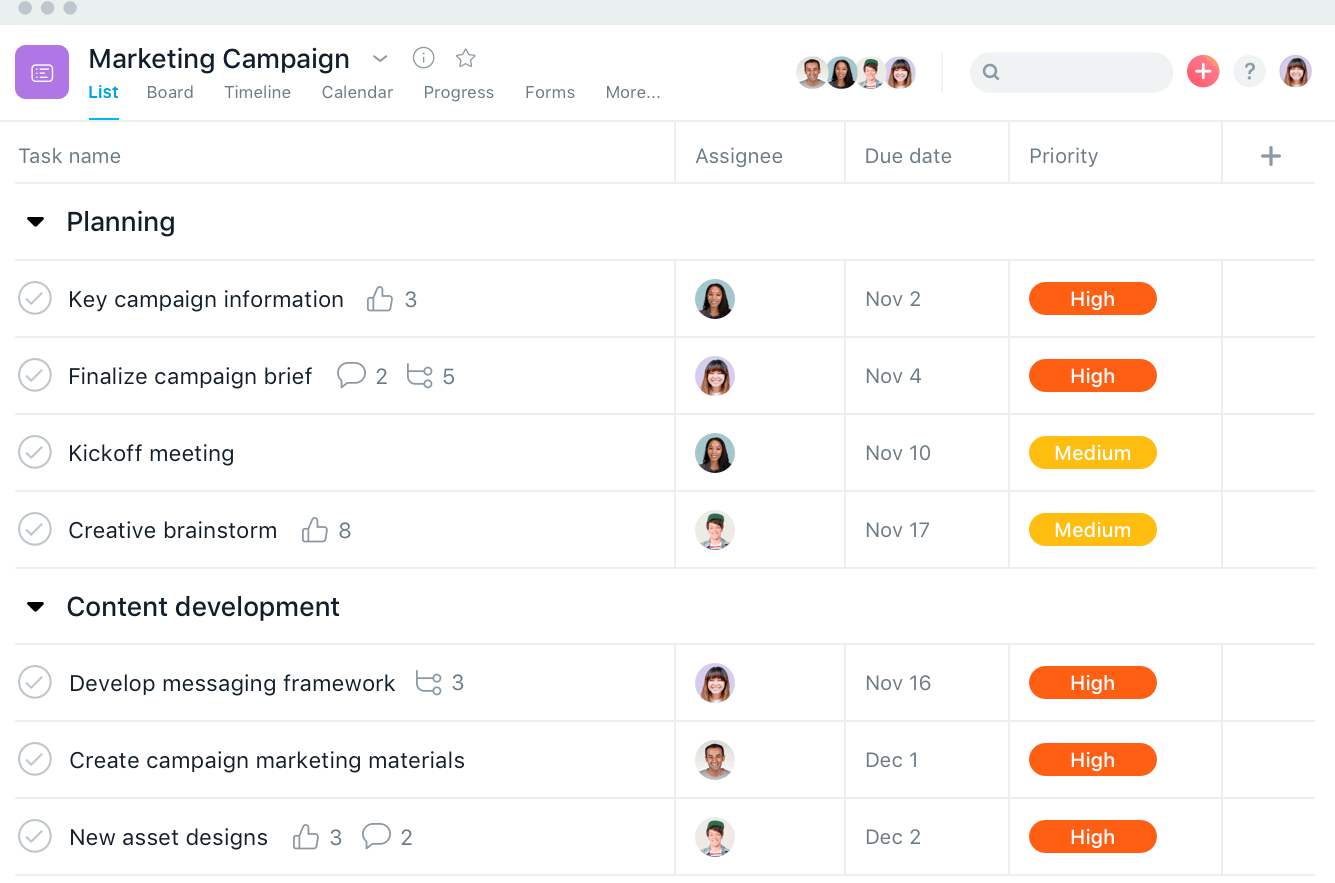
Customize this view further with drag-and-drop functionality to:
- Reordering tasks in a project
- Filtering or sorting your tasks
- Adjusting your project view to show incomplete, completed, or all tasks
For more time-sensitive projects, “Timeline” and “Calendar” views are super convenient.
The “Timeline” view offers a high-level overview of ongoing and upcoming work. It’s ideal for planning projects with overlapping tasks and deadlines since it provides a clear visual of the project’s scope and key milestones.
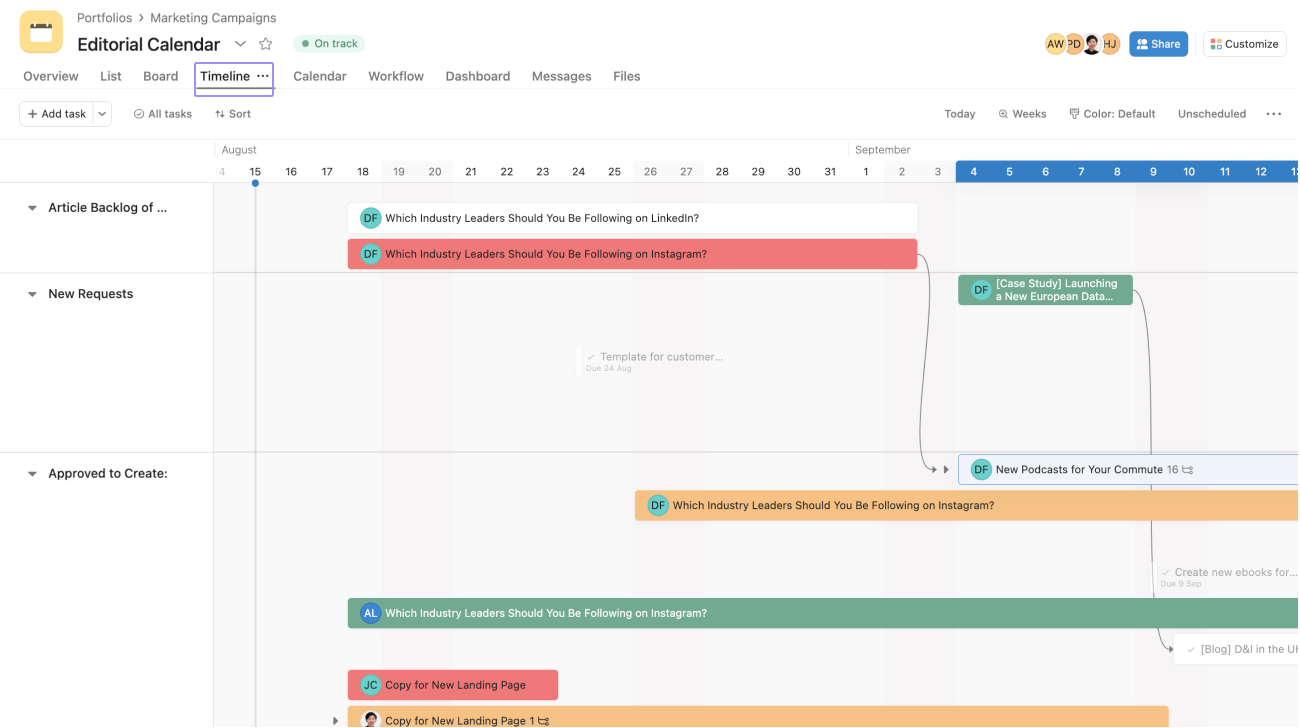
Lastly, the “Calendar” view is great when you need to schedule tasks and visualize task distribution over time. Click the “Calendar” tab in the header from the project to access this view.
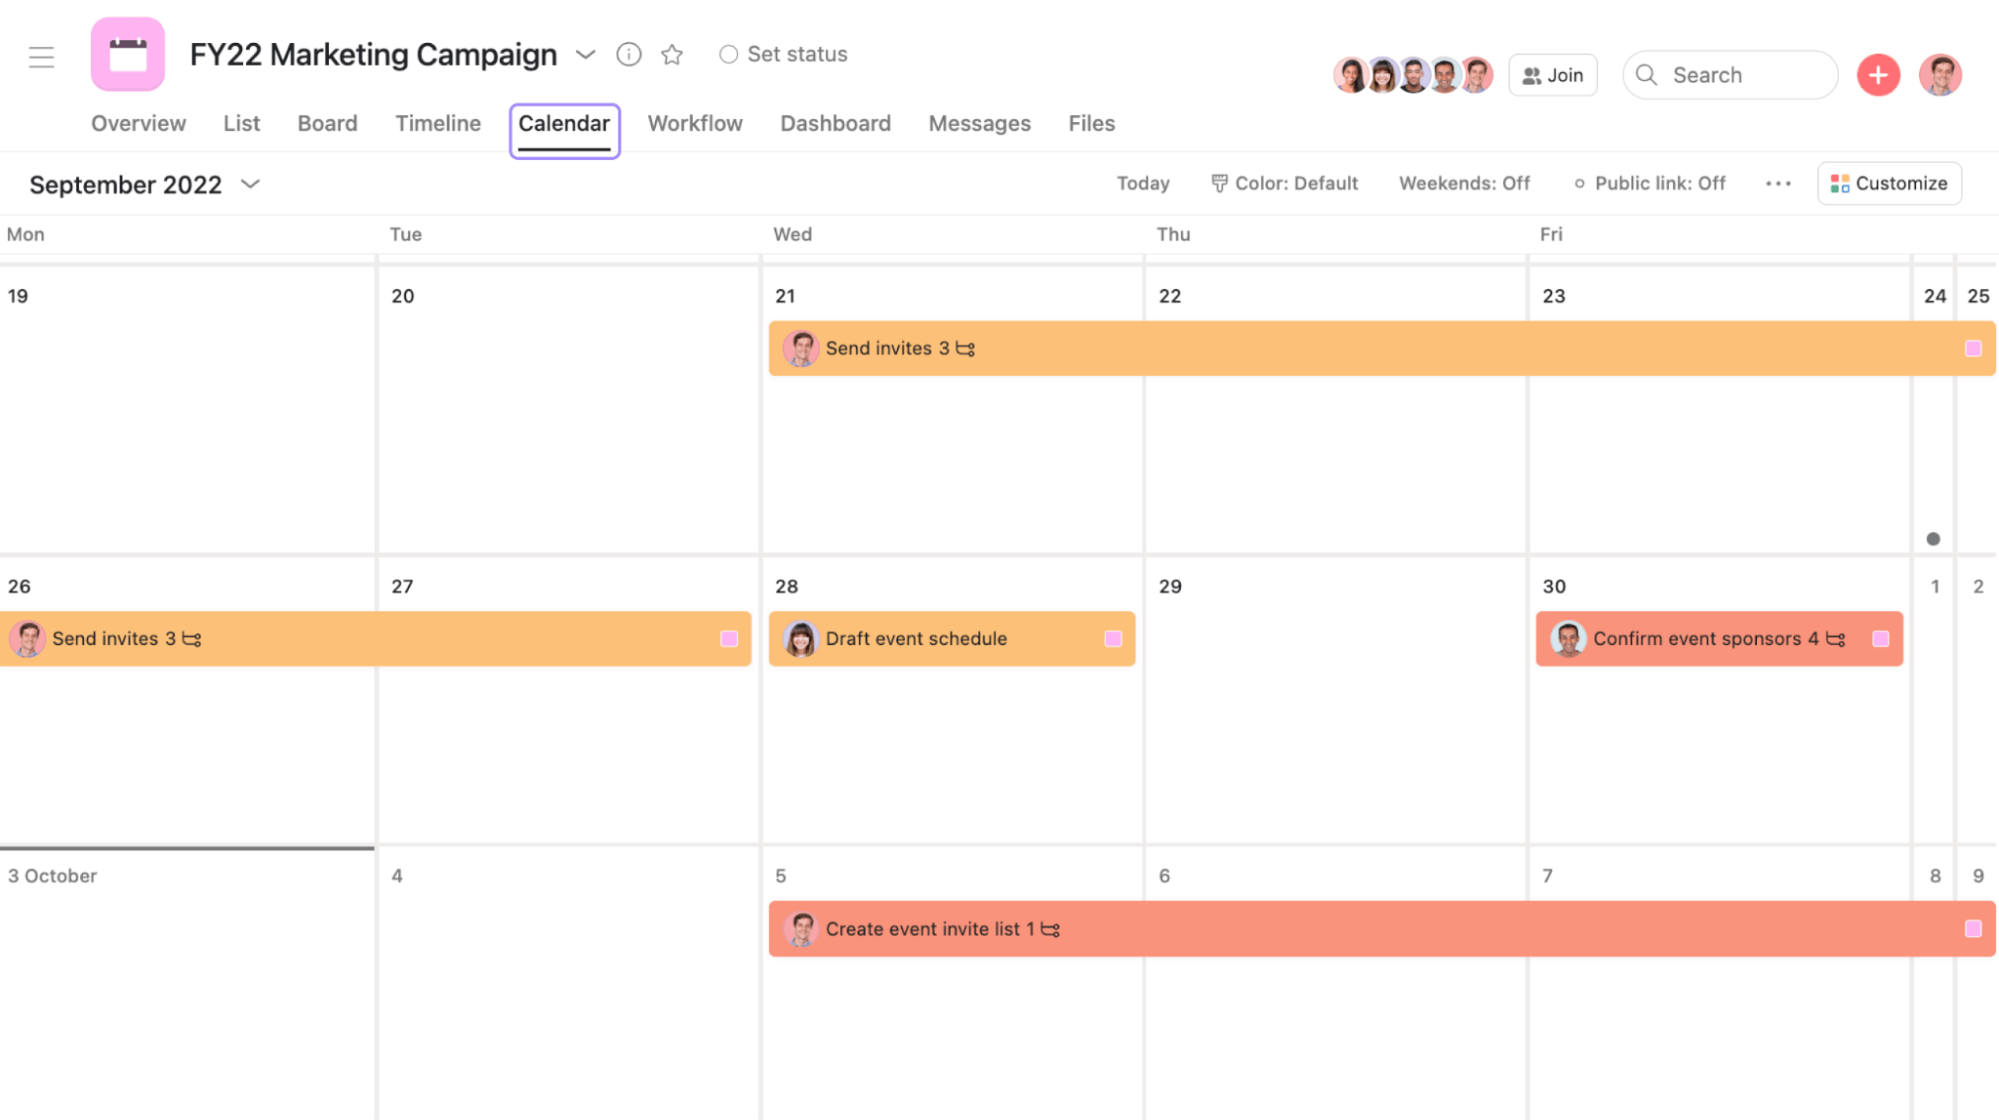
With this view, pencil in tasks on a calendar, spot holes and overlaps in your team’s schedules and make adjustments by dragging and dropping tasks to new days—automatically updating due dates.
What you’ll love
Asana’s portfolio feature gives you a comprehensive overview of your entire project landscape and the ability to track, monitor, and report on multiple projects simultaneously.
In one look, see different projects’ statuses, progress, date ranges, priority levels, owners, and estimated time spent.
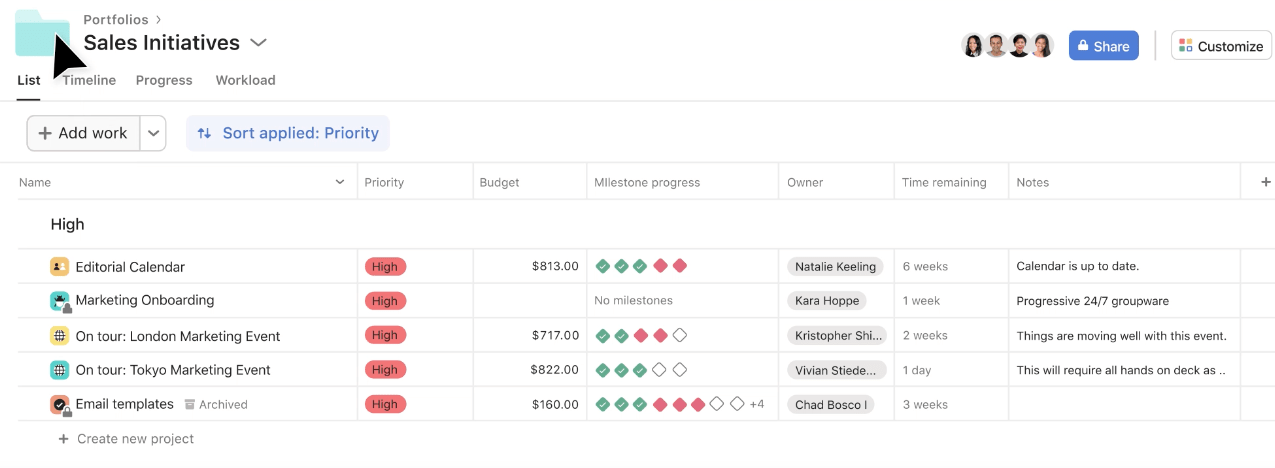
Use these high-level insights to:
- See which projects are on track and which ones need your attention.
- Search for existing projects and add them to your portfolio.
- Summarize data across each project, like time spent or available budget
Core features of Asana you’ll like
- Status updates to craft project updates in minutes with time-saving automation
- Rules to automate routine tasks and get more done faster
- Project views to organize work as a list, calendar, timeline, Gantt chart, or Kanban board
- Custom fields to add labels to tasks so you can sort, filter, and report on work
- Reporting dashboards to uncover the state of your team’s work with real-time data
- Forms to standardize work requests so your team has the information they need from the start
- Templates to standardize your team’s best practices with ready-made guides for projects and tasks
Pricing
Asana has four plans:
- Personal: Free
- Starter: $10.99 per user per month
- Advanced: $24.99 per user per month
- Enterprise: customized enterprise pricing
5. Trello
Trello is another visual tool for collaborating, organizing, and managing your work in a collaborative, efficient, and organized way.
The beauty of Trello is its simplicity.
With Trello, you have “Boards,” “Lists,” and “Cards.” That’s it.
- “Boards” let you separate projects and group-related tasks
- “Lists” break boards down into more specific categories
- “Cards” are for individual tasks and items you can move around
At the high level, Trello “Boards” provide a centralized location for teams to visualize their projects and work in progress.
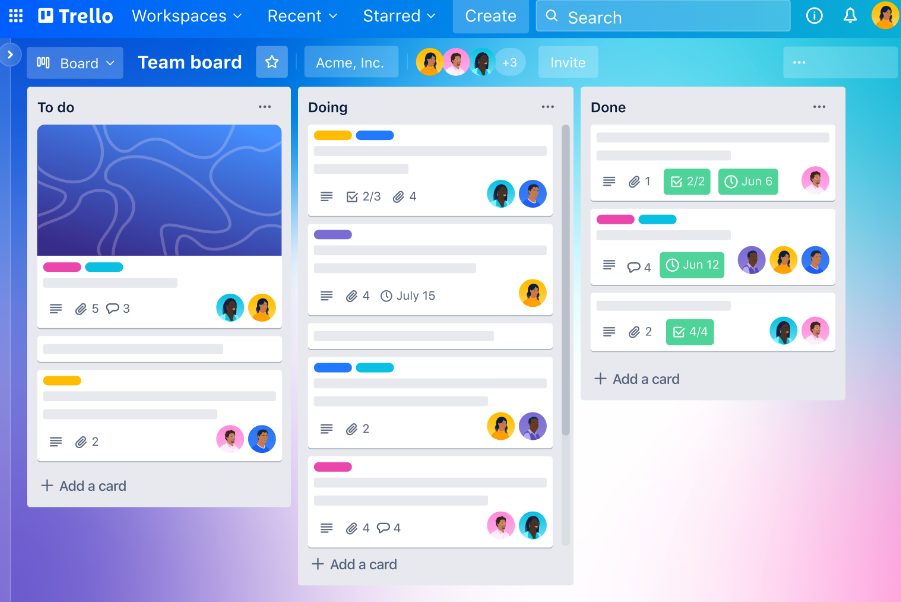
Within each “Board,” you can create “Lists” to represent the various stages of your workflow. Customize these lists to be as simple as “To Do,” “In Progress,” and “Done,” or tailor them to match your team’s specific needs.

At the granular level, “Cards” represent individual tasks or ideas. Move each card across lists as work progresses to visually represent the task’s status.
“Cards” can also hold all the necessary information to complete the task, such as due dates, attachments, checklists, and comments from team members for detailed task management.
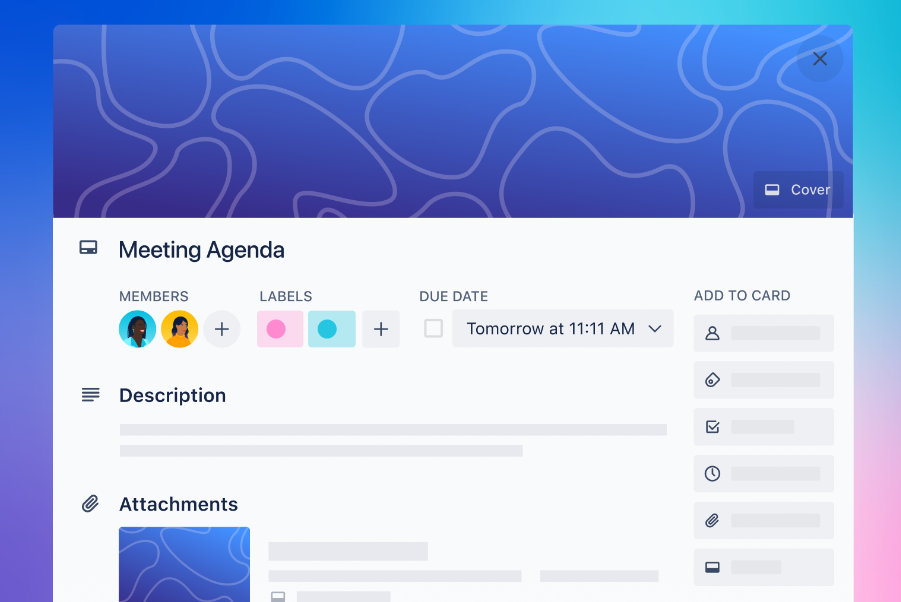
And how do you combine everything?
Trello’s “Timeline” view displays “Boards,” “Lists,” and “Cards” on a visual timeline. This adds a time dimension to see tasks organized over time.
You can access the “Timeline” view directly from your board. Open the “View Switcher,” enable the “Timeline” view, and then select “Timeline” from your board.
For example, you can use the “Timeline” view when planning a product launch. Add key phases and tasks on the timeline and assign team members. This lets you schedule out the launch plan and see who is responsible for each task.
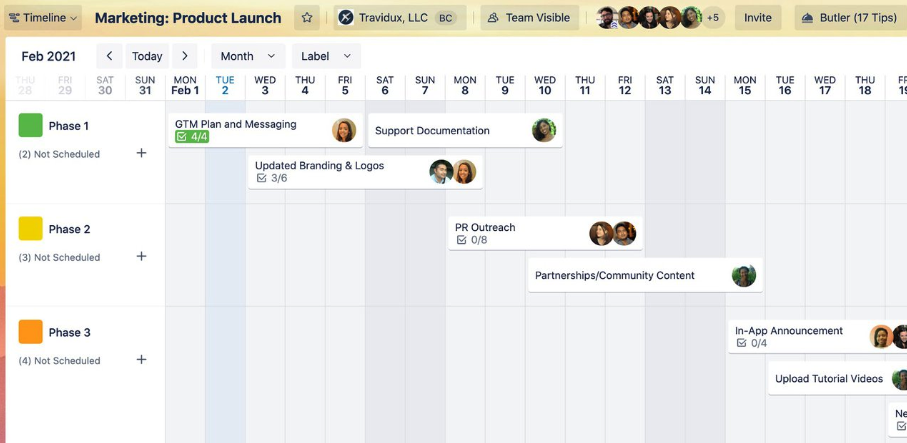
What you’ll love
Trello’s “Power-Ups” connect Trello to other apps to ensure vital info is directly accessible within your project boards. The connectivity enhances “Cards” with additional details, from document integration to embedding feedback forms, without cluttering your workspace.
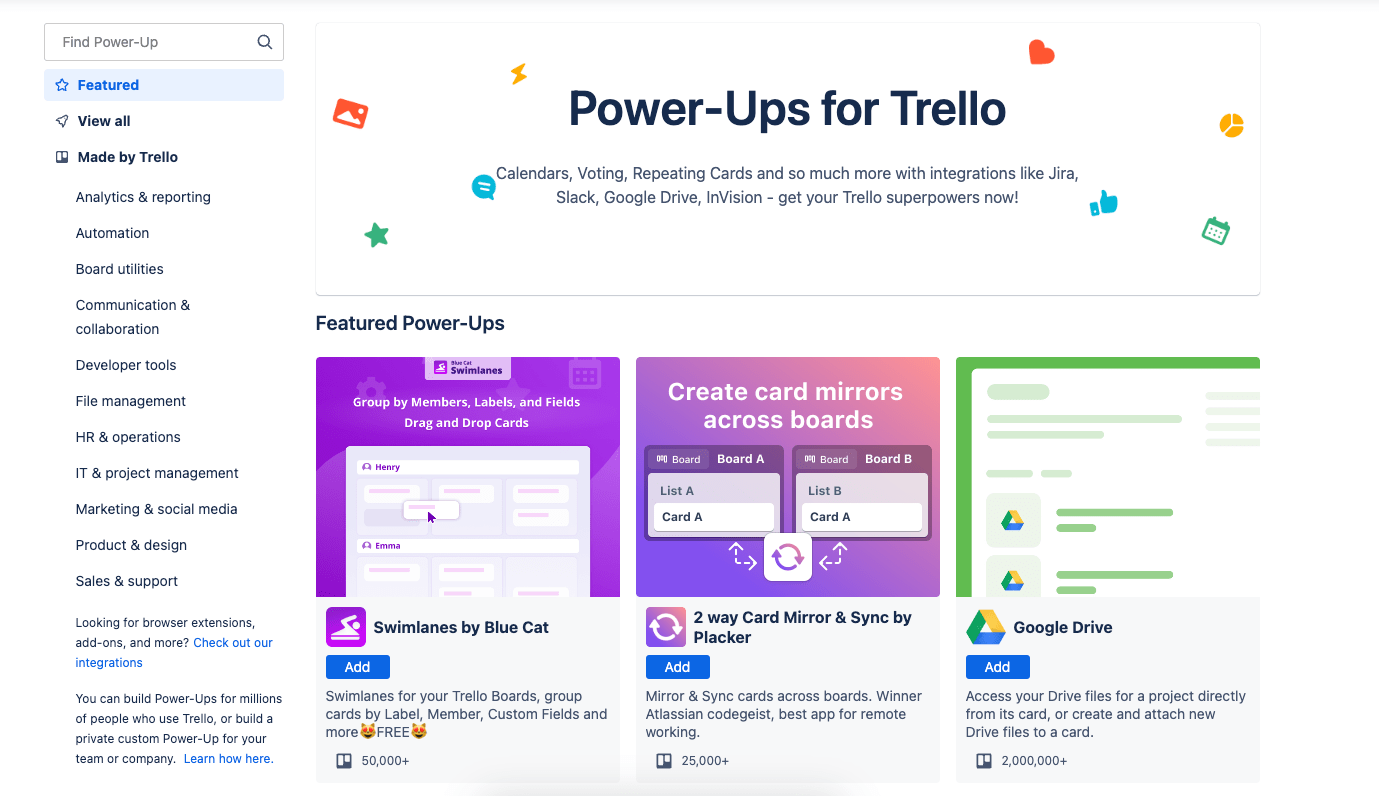
Here are a few examples of Trello Power-Ups and how they can enhance your boards:
- GitHub Power-Up attaches commits, issues, and pull requests to cards so you can track code changes without leaving Trello
- Google Drive Power-Up lets you attach Google Docs, Sheets, and Slides directly to cards for easy access to relevant files
- Zoom Power-Up embeds Zoom recordings onto cards to centralize meeting notes, decisions, and action items
- Typeform Power-Up lets you embed Typeform surveys onto cards to collect feedback from stakeholders easily
- Slack Power-Up brings Slack conversations into Trello so background context is accessible within your boards
- Calendar Power-Up connects your Google Calendar to overlay due dates, appointments, and availability onto cards
Core features of Trello you’ll like
- Custom fields to add metadata and track additional information on cards
- Automation rules to trigger actions like adding members, tracking dates, creating recurring tasks
- Multiple views like boards, timelines, tables, calendars to visualize work
- 200+ integrations with tools like Slack, Jira, and Google Drive to centralize work
- Time tracking and reporting Power-Ups to log time on cards and generate reports
- Templates to get started quickly with preset boards for project management and other workflows
Pricing
Trello has four plans:
- Free
- Standard: $5 per user per month
- Premium: $10 per user per month
- Enterprise: $17.50 per user per month (for 50 users)
6. Basecamp
Basecamp is a project management tool designed for small teams to collaborate and manage work. It provides tools to organize projects, track tasks, communicate, share files, schedule events, and get visibility into what everyone is working on in one centralized hub.
At a high level, Basecamp’s “Home” screen provides a centralized hub to view your top projects and priority cards across teams. You can pin your favorite pages and see your schedule and your assigned tasks.
As you move to specifics, Basecamp’s project-level focus centralizes all critical components—message boards, to-do lists, files, schedules, and direct messaging—into clearly defined blocks to streamline navigation and project oversight.
For a more interactive and visual approach to managing specific types of work, you can use Basecamp’s “Card Table.” The “Card Table” tool streamlines tracking reactive work and ad hoc requests through a Kanban-style interface.
The “Card Table” works well for managing requests and issues directed at a specific team. It’s intended to track reactive work like resolving software bugs or handling design requests. But you can use it to organize any workflow that involves moving items through stages visually.
The “Card Table” starts with four columns: “Triage,” “Figuring it Out,” “In Progress,” and “Done.”
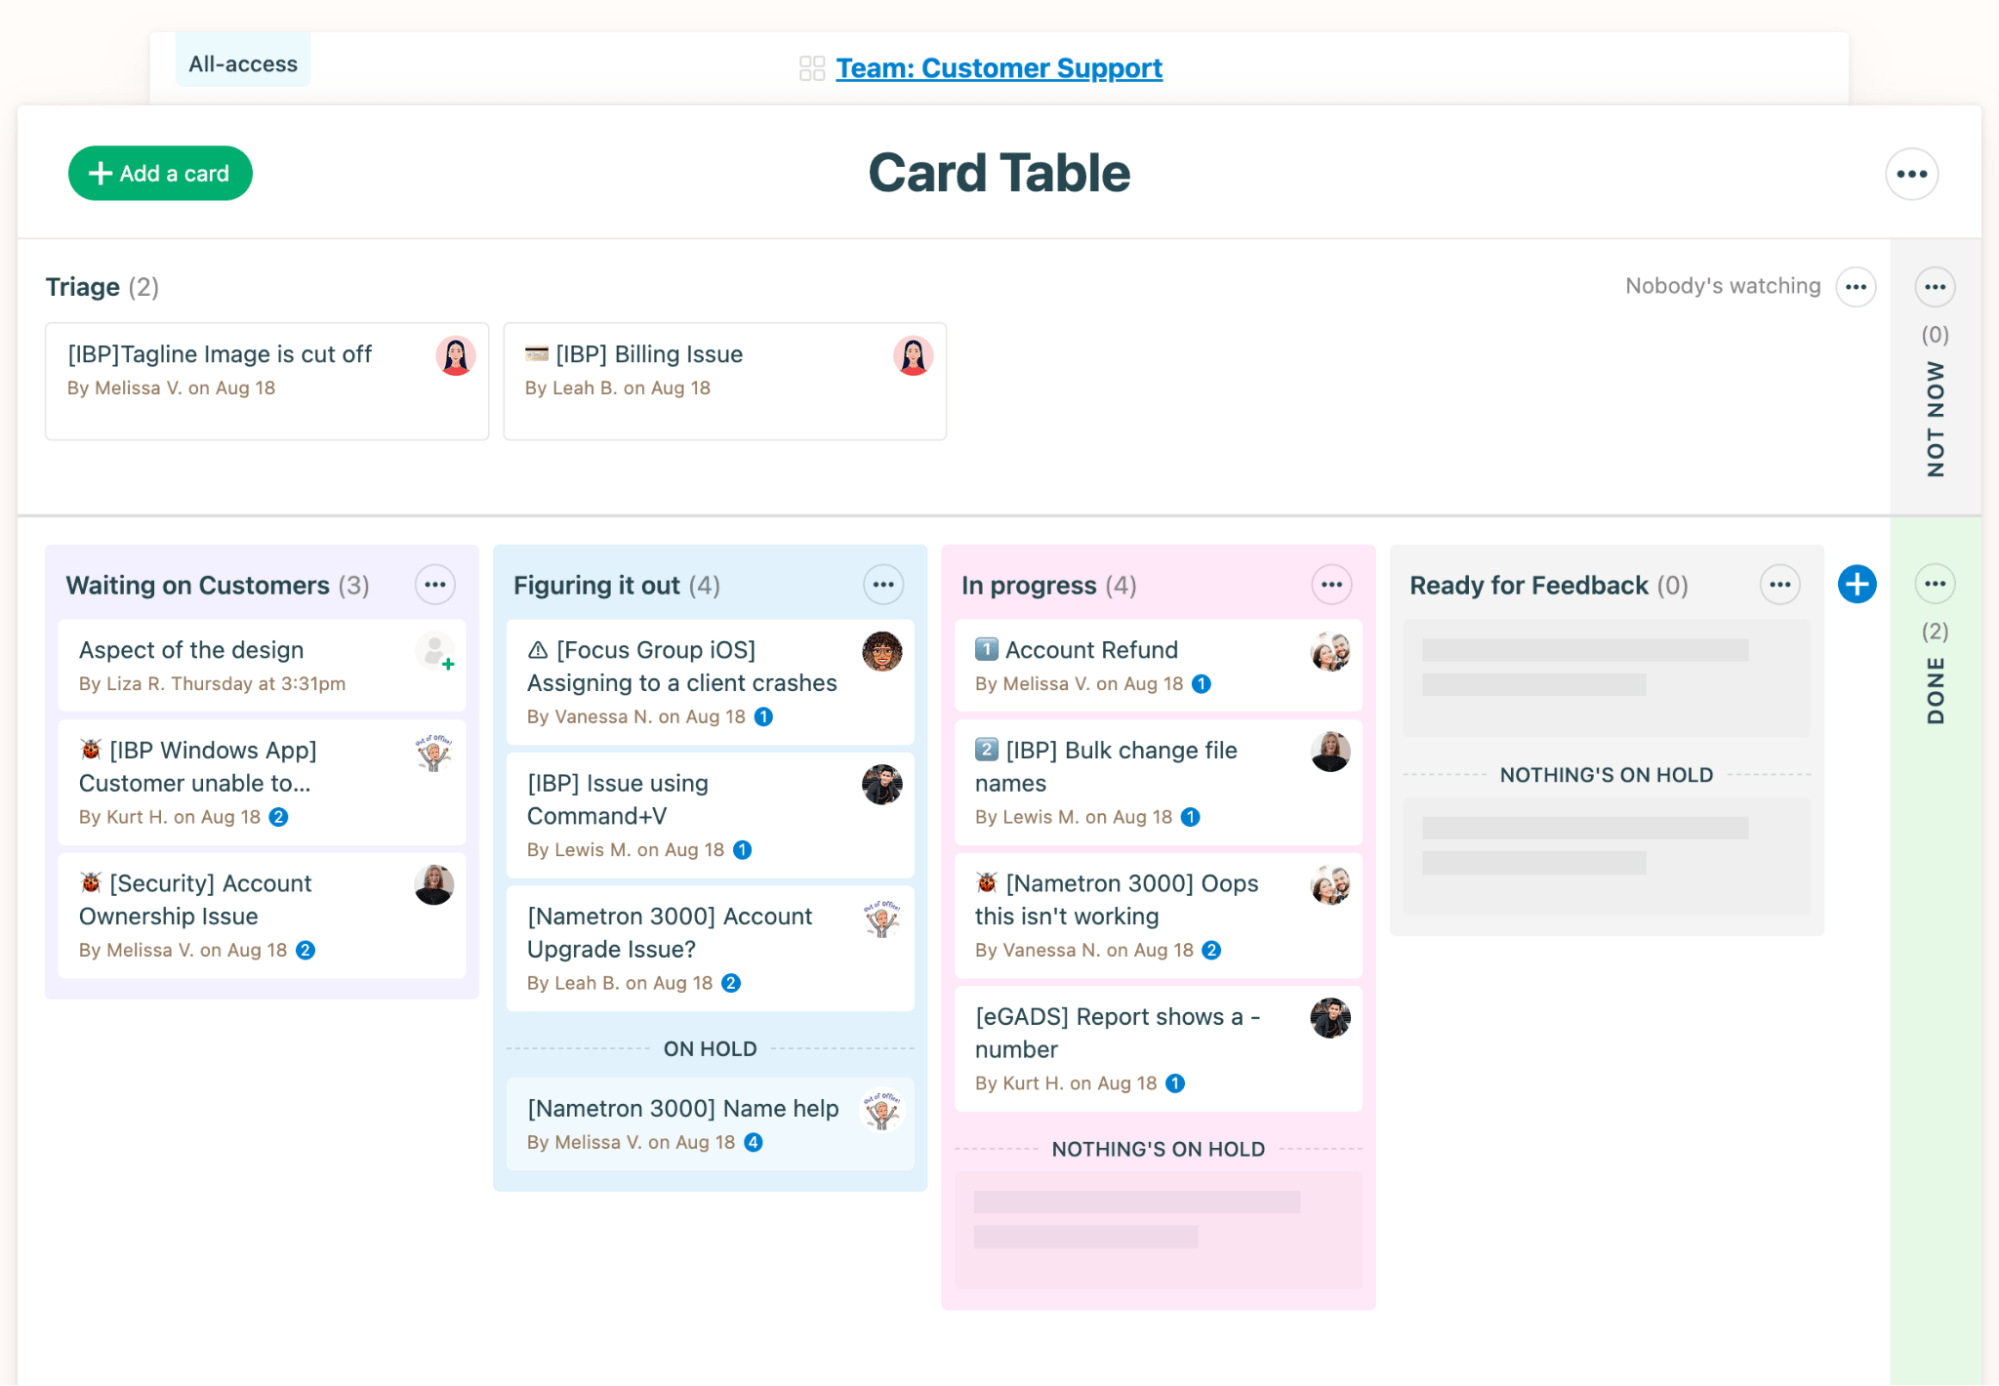
To add an item to track, click “+ Add a card,” which will place it in the “Triage” column by default. Give the card a title, assignee, due date, and description.
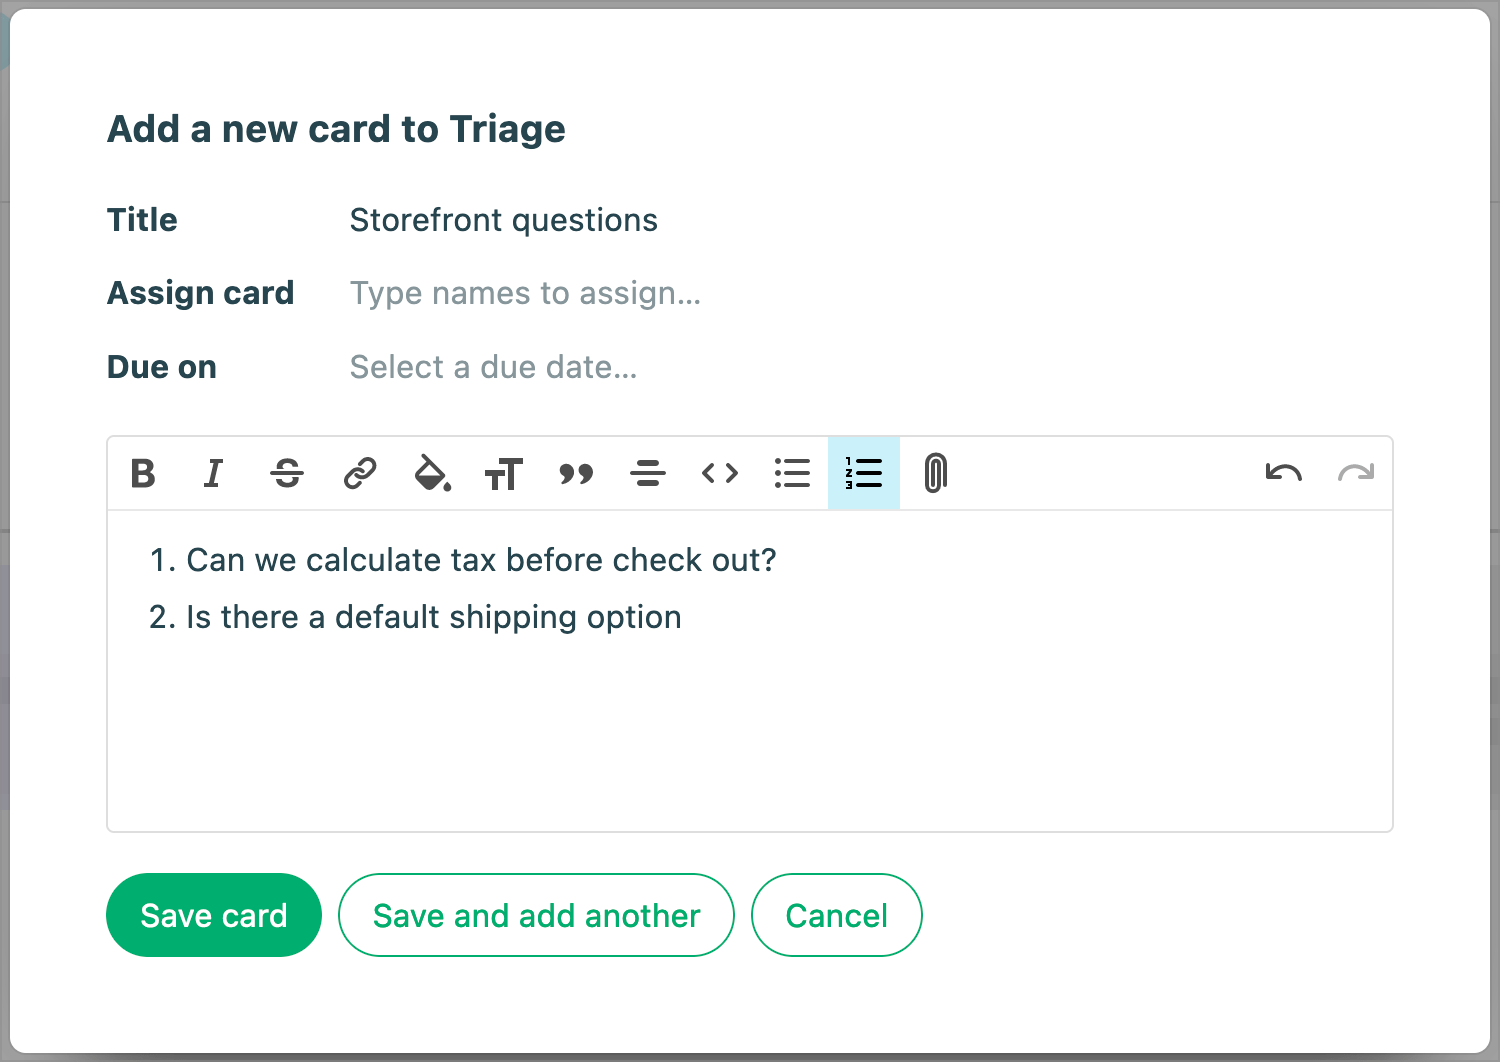
The card can then be dragged through columns like “In Progress” and “Done” to represent status changes.
Another way to view ongoing projects is the “Lineup” view. It’s a timeline view showing what your team recently completed, what’s active now, and what’s coming up next across all projects.
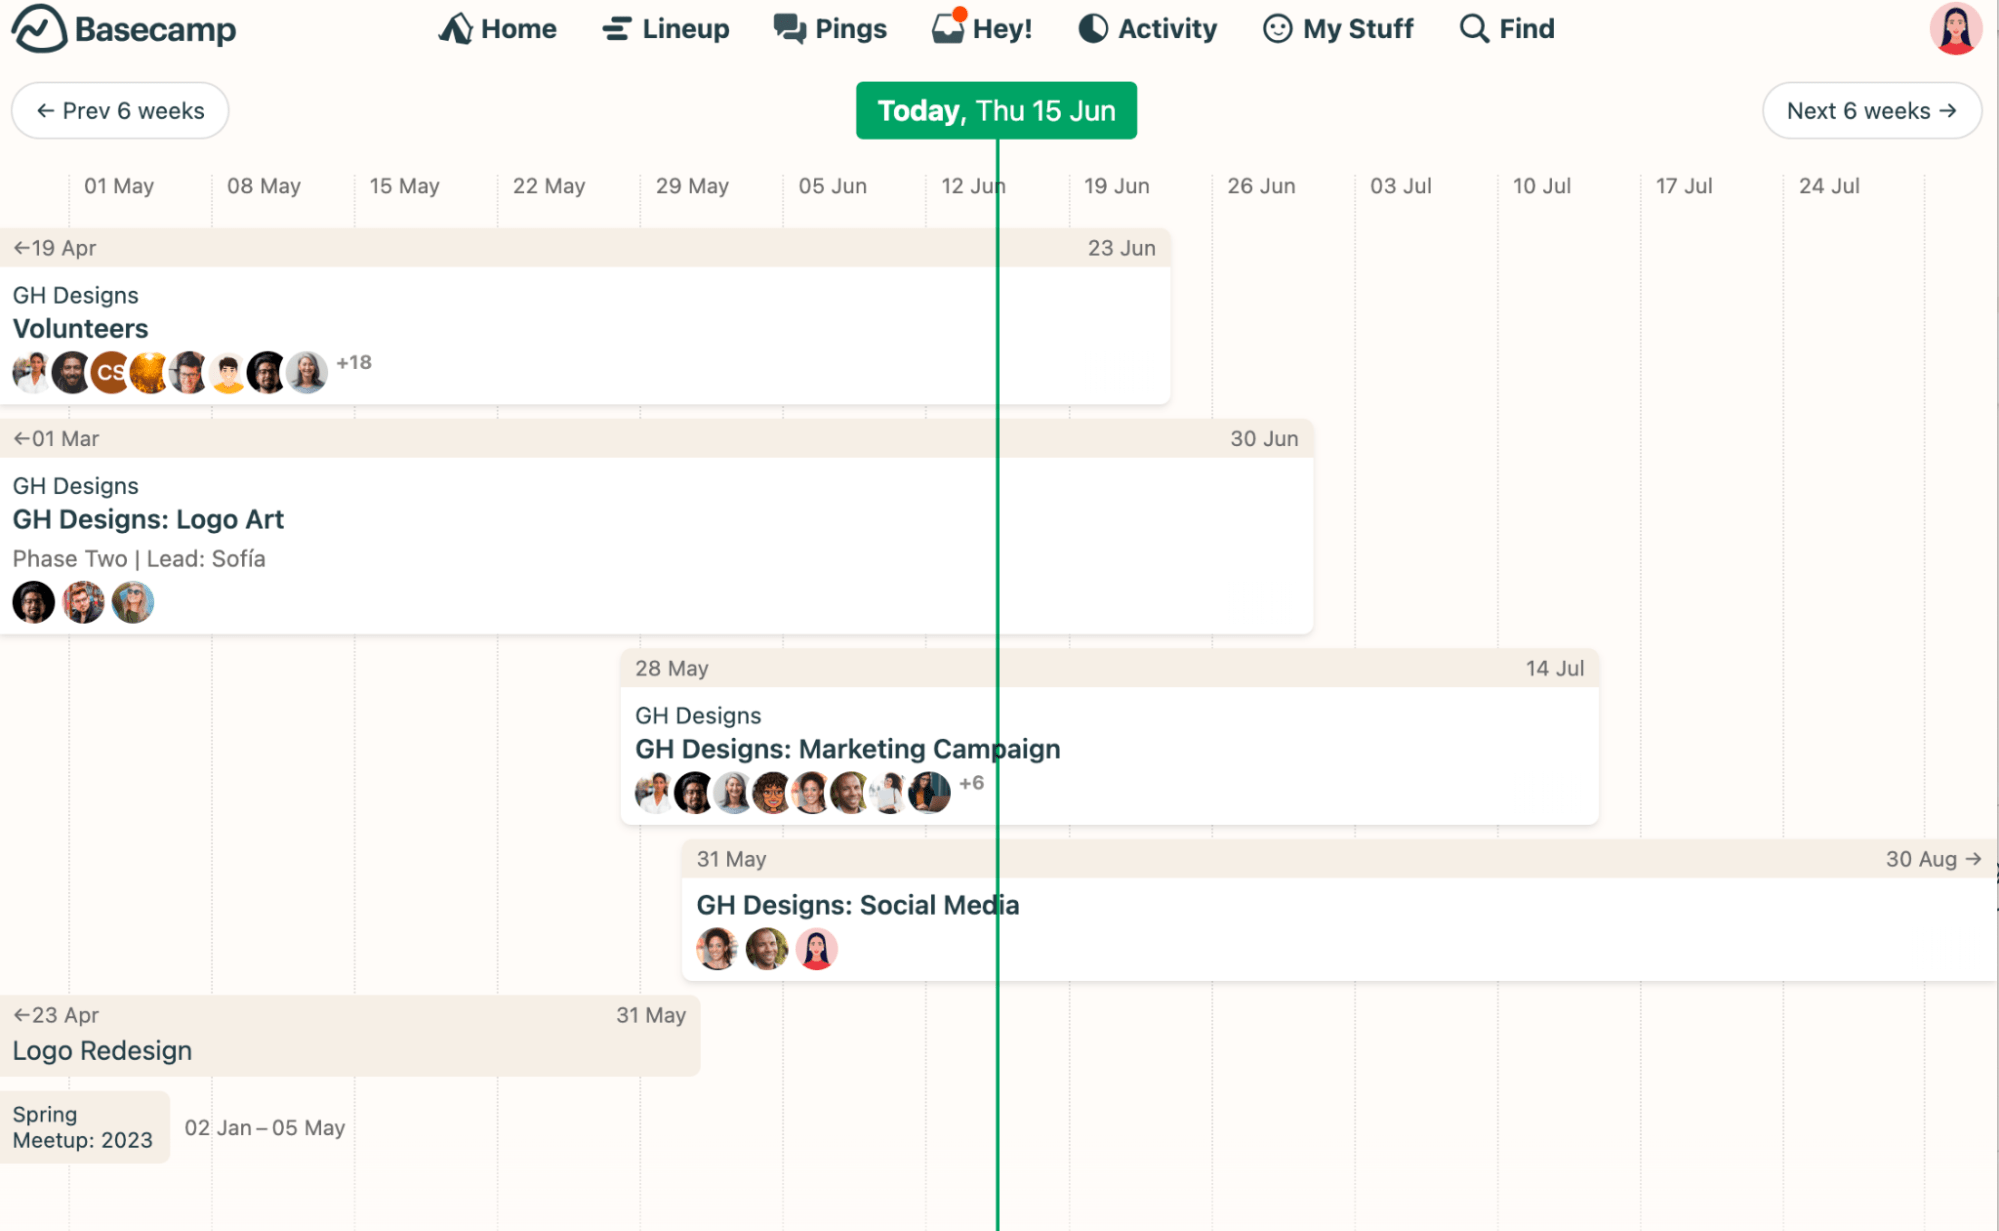
“Lineup” provides at-a-glance visibility into how long each project runs and where it falls on the calendar. The vertical green line marks today, no matter if you’re looking at a project or the “Lineup” page.
What you’ll love
The “Hill Chart” provides a high-level visualization of project progress by representing work as “dots” plotted on a hill-shaped graph.
- The “uphill phase” – figuring things out
- The “downhill phase” – making solutions
Click the name of a to-do list and then choose “Track this on the Hill Chart” from the options menu.
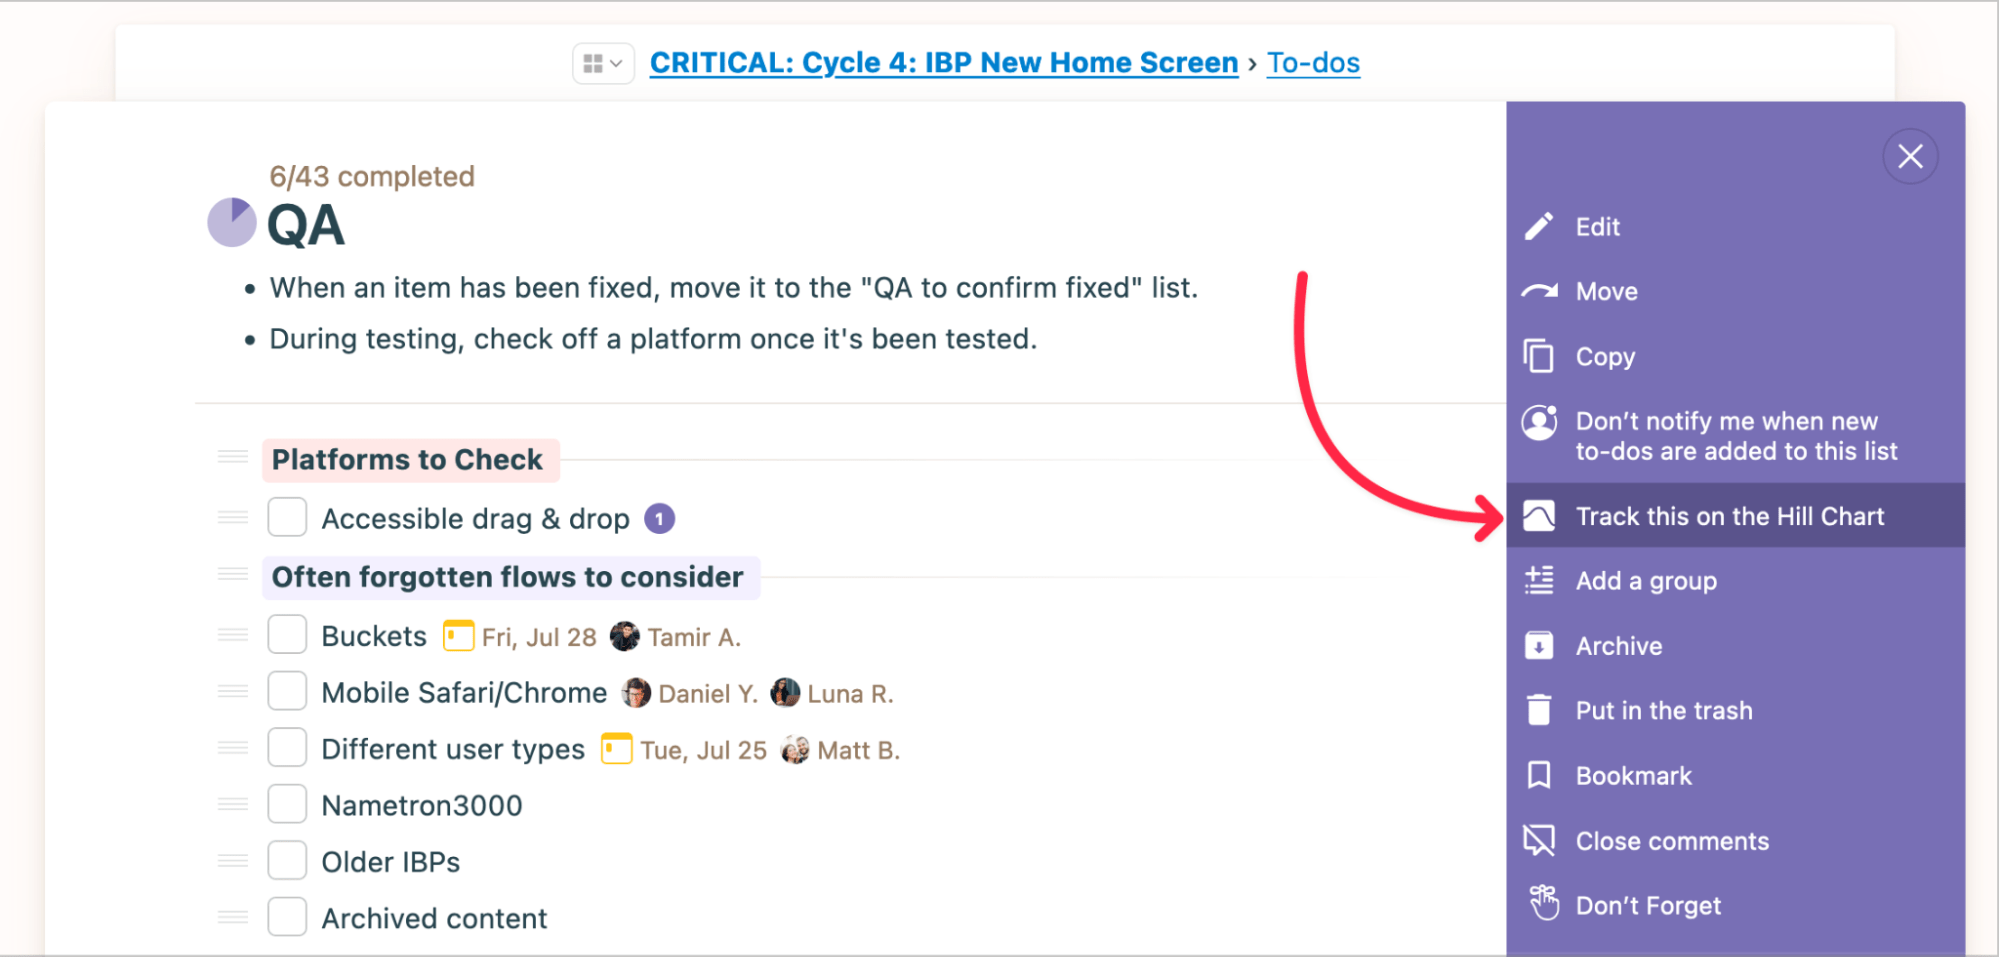
Rather than just show tasks finished, drag chart dots to highlight obstacles or wins. Team leaders stay in the loop to help teams, not penalize them later for unexpected roadblocks.
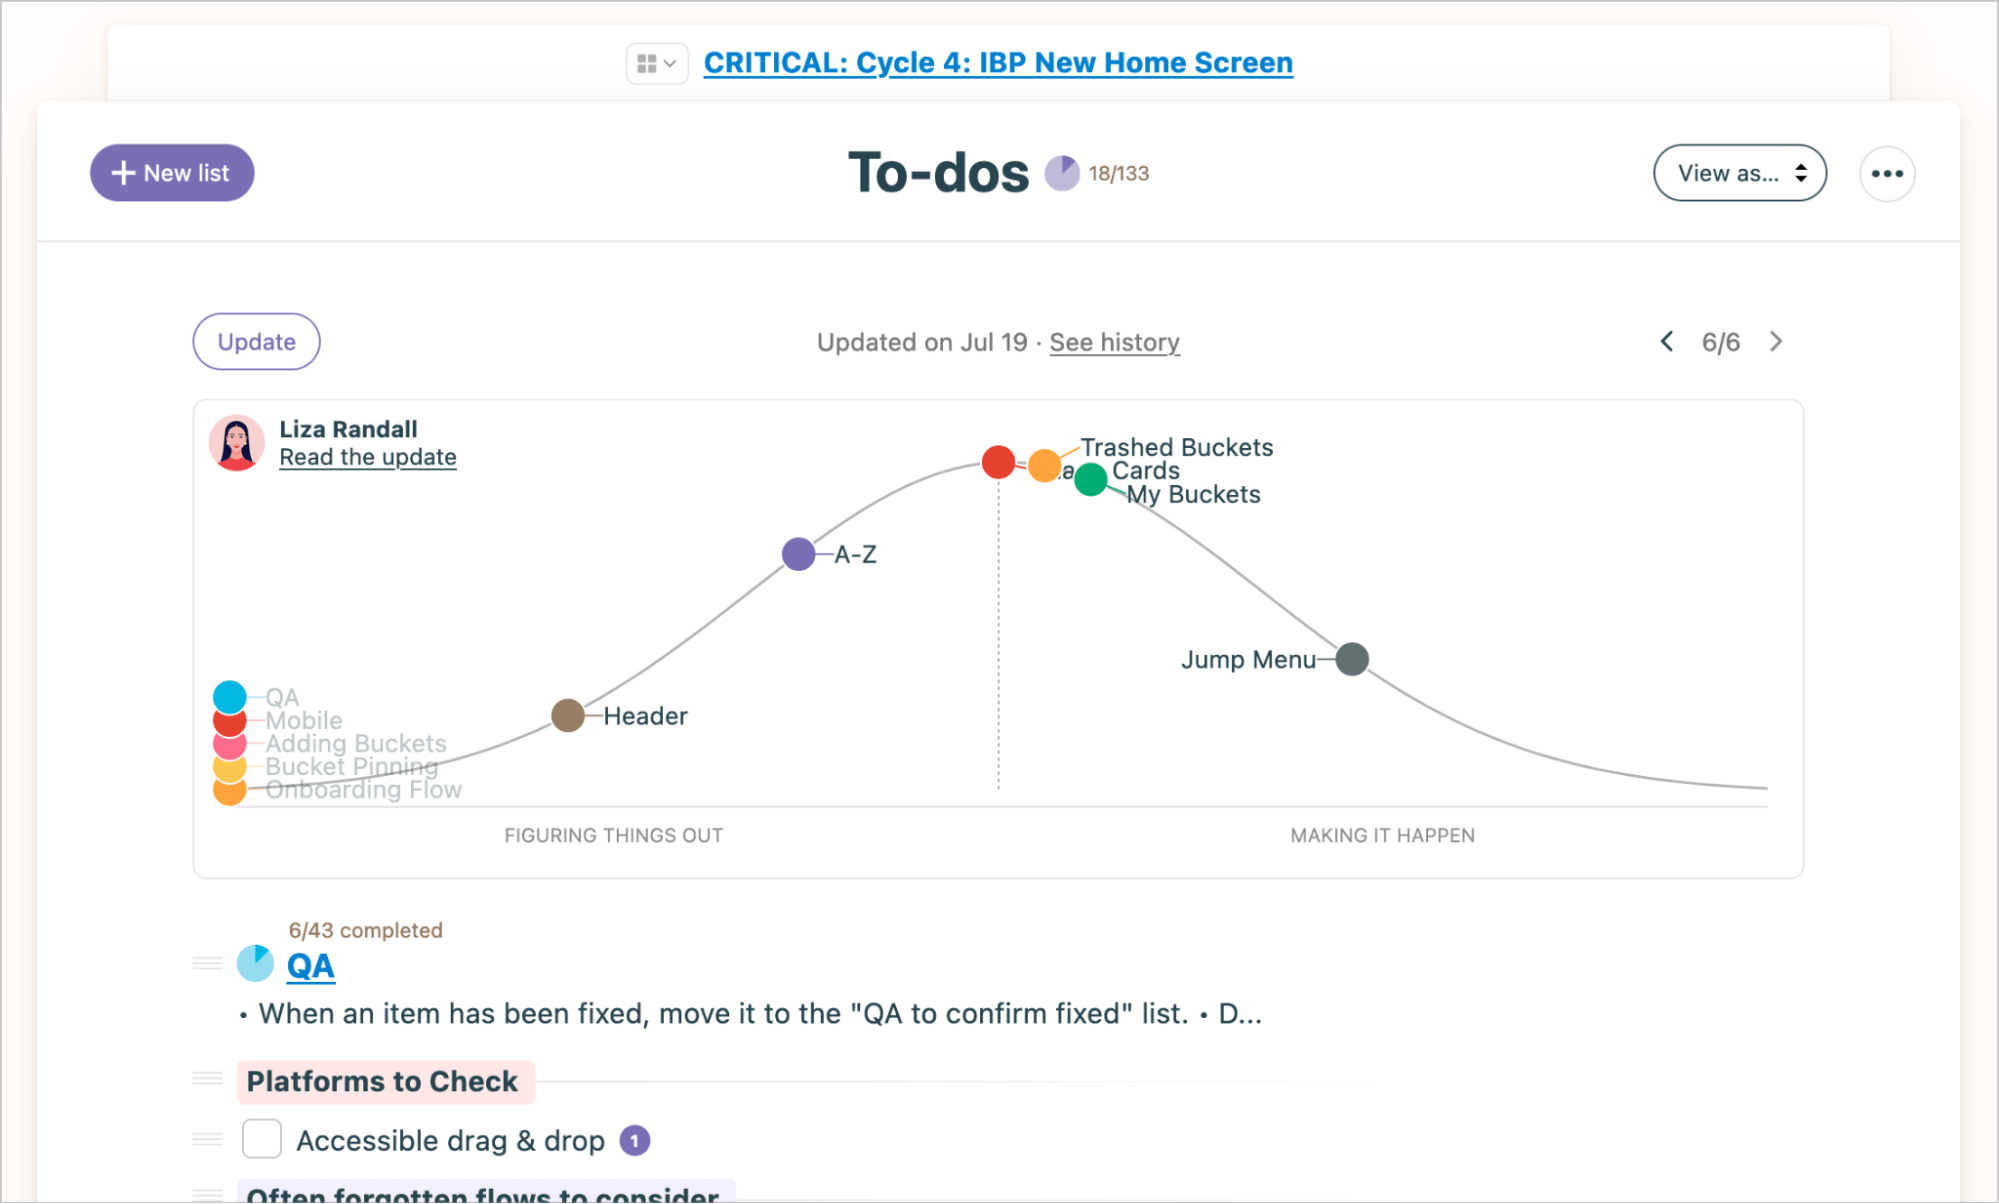
The vertical position of each dot indicates the status of that work:
- “Uphill” phase – still figuring things out, unknowns remain
- “Over the hill” – the plan is clear, only execution remains
- “Downhill” – actively working through execution
Drag dots to the appropriate place on the “Hill” to represent progress.
“Hill Charts” spotlight what’s blocking work, not just what’s done. A task list might show 90% finished while the hard stuff sits untouched. Charts surface this.
Look back through previous chart updates to guide decisions, not excuses like “It looked on track last week.” Hill Charts cultivate trust by shining light on the messy innards of getting stuff done.
Core features of Basecamp you’ll like
- Home dashboard to see all your projects, assignments, and schedules in one place
- Messages board for centralized discussions and communication
- To-Dos to create, assign, and track tasks
- Docs & Files to store, share, and discuss documents
- Real-time Chat for quick conversations within projects
- Schedule calendar to view dated tasks, milestones, and events
- Card Table as a kanban-style board to visually track work
- Automatic Check-Ins to regularly collect feedback from your team
- Hill Charts to provide visual high-level project progress at a glance
- Reporting to gain insights across multiple projects
7. Notion
Notion is a powerful, all-in-one workspace that offers various views and tools for project managers to track milestones and collaborate. Its value lies in its flexibility to cater to different team preferences and project needs.
In Notion, you can organize projects using “Databases.”
Databases contain collections of pages with the same properties, like status, assignee, due date, etc. This allows you to view and track project details all in one place.
For example, you can create a database to manage tasks across different projects. Add properties like status, assignee, priority, sprint, and view it as a table. This provides an organized project task tracker with customizable columns.
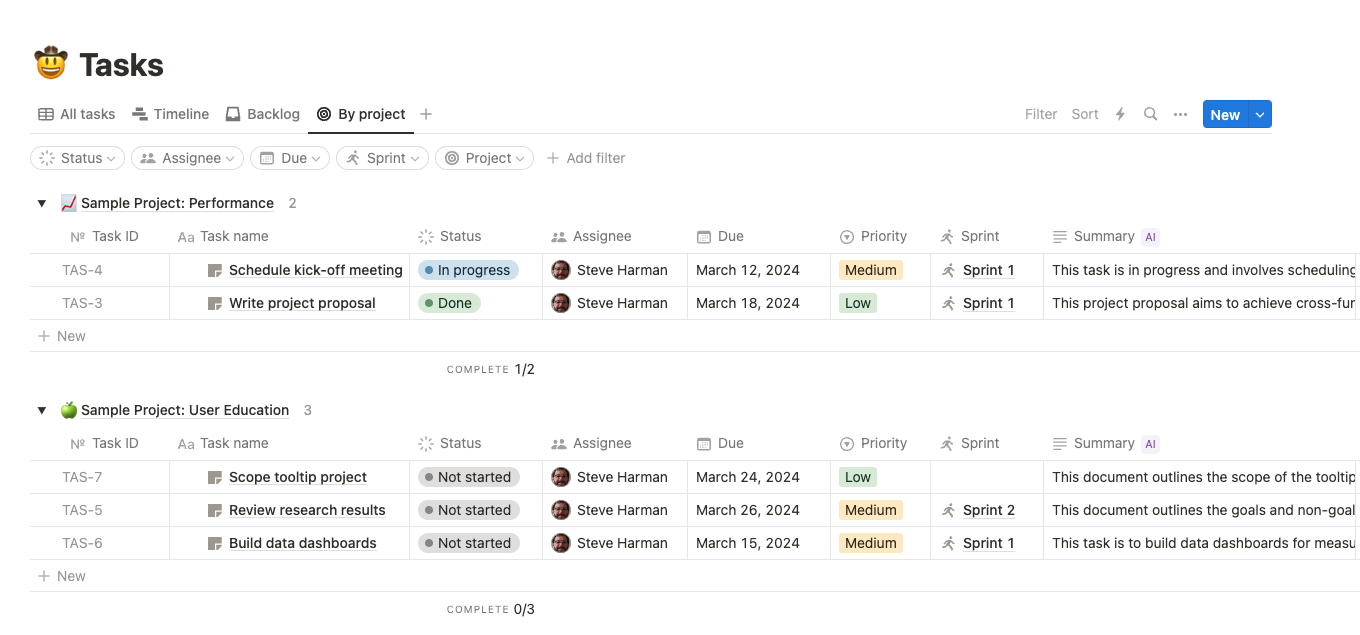
You can then click a task to view and manage details like sub-tasks, comments, and other insights directly within the task page.
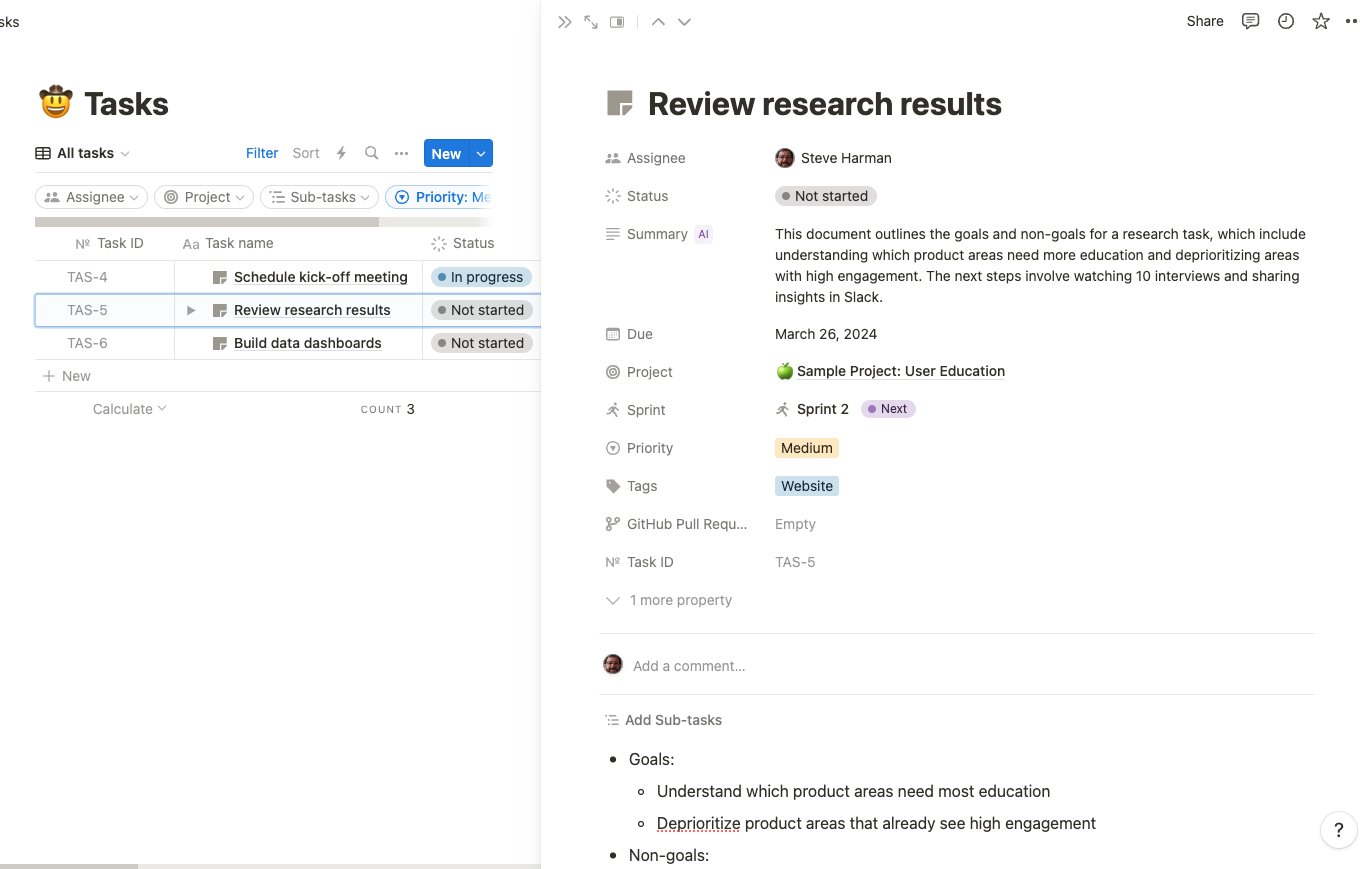
You can also visualize tasks on a timeline by creating a “Timeline” view for the project.
The “Timeline” offers a 360-degree view of how projects and tasks fit together, allowing teams to visualize dependencies and plan their work.
To add a timeline, click “+” and select “Timeline” from the dropdown menu.
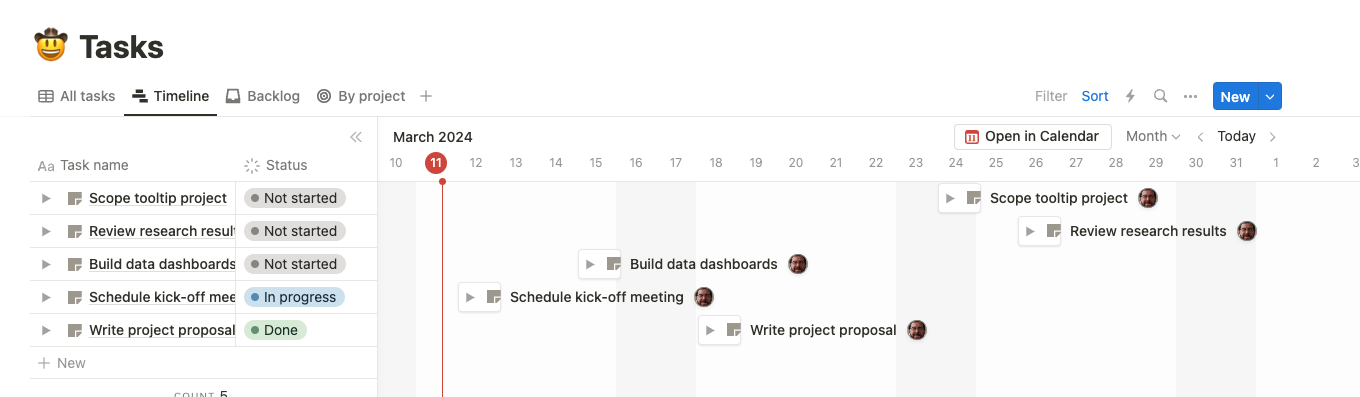
Notion also lets you customize views with powerful filters and sorts. For example, click “Add filter” then select “Priority” and “Medium” to only show medium priority tasks.
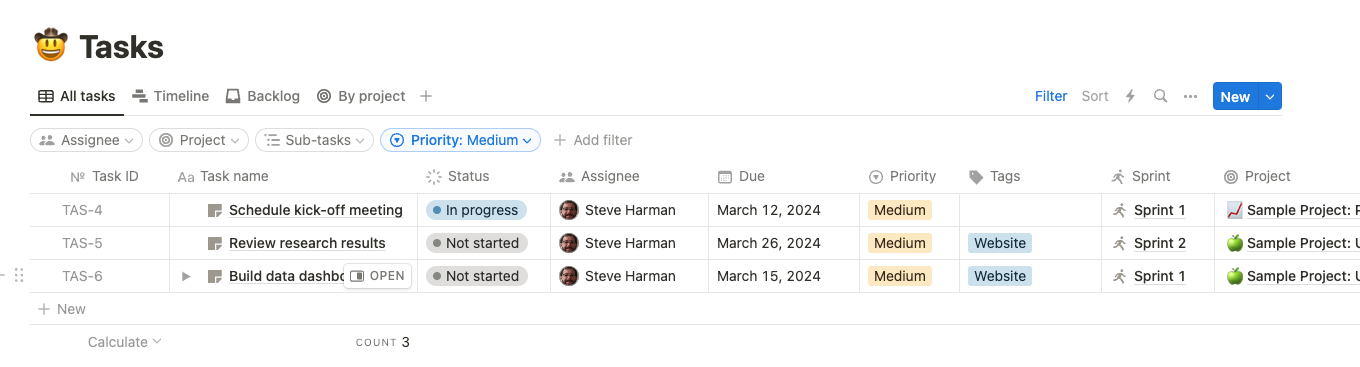
With the ability to tune each view’s focus based on everything and anything, Notion ensures laser-sharp visibility into the right information at the right time.
What you’ll love
Notion provides a massive library of project templates for various use cases, from roadmaps and calendars to issue tracking, planning, and ticketing.
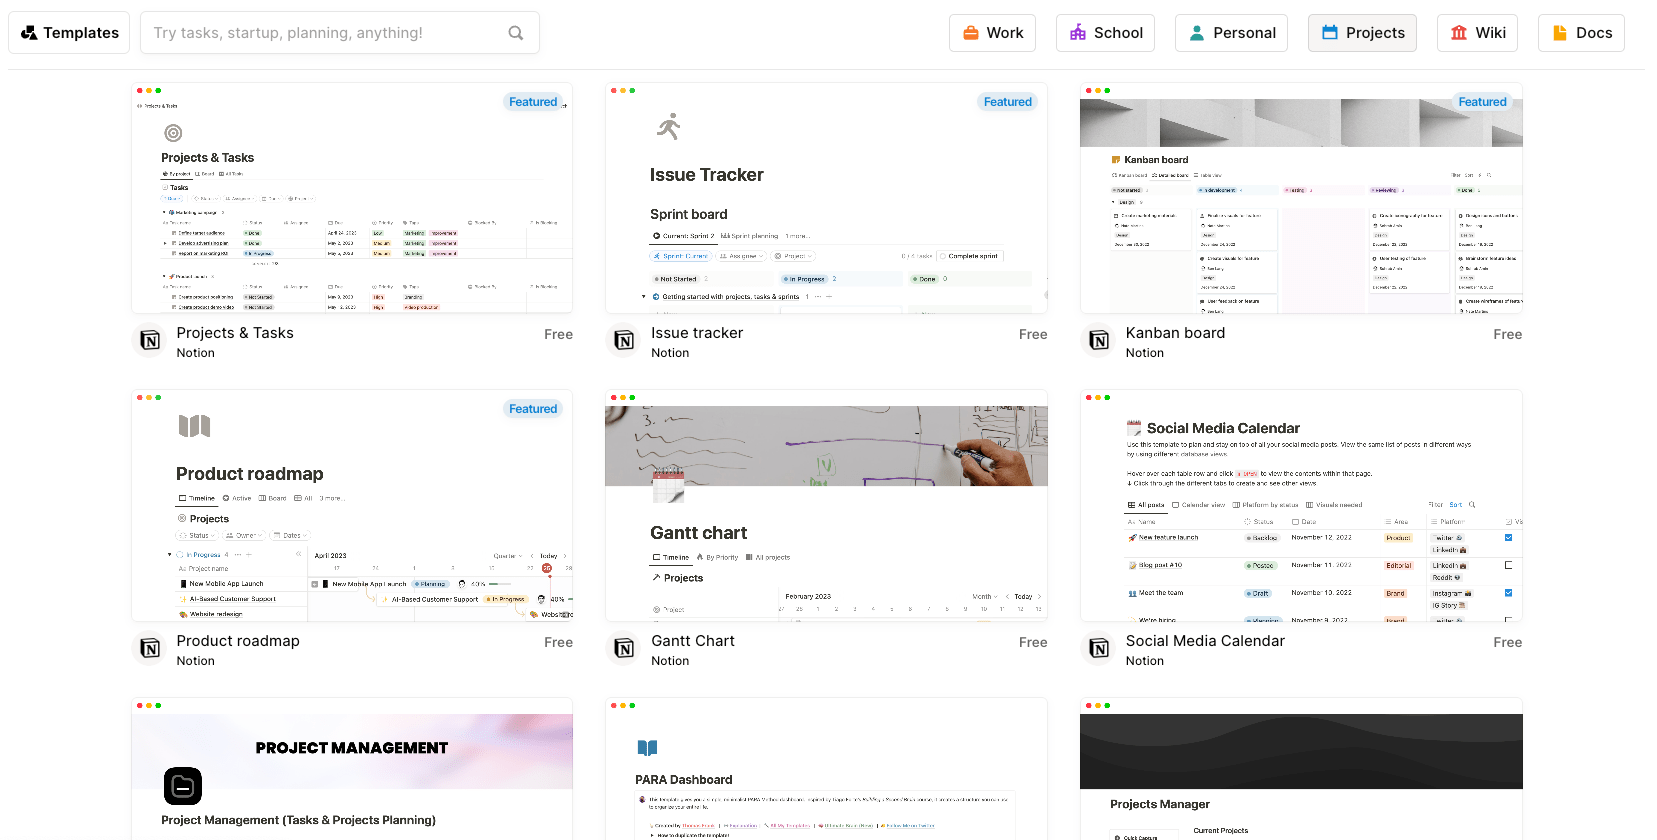
Some examples of popular project management templates in Notion include:
- Projects & tasks: A template to organize tasks, status, priorities, due dates, and more
- Issue tracker: For tracking bugs, feature requests, and other issues
- Kanban board: A visual board to map out project workflow
- Product roadmap: For planning product features and milestone releases
- Gantt chart: To visualize task schedules and timelines
- Content calendar: For scheduling and managing social media and blog posts
- Project management: An all-in-one template for task planning, tracking, and collaboration
Core features of Notion you’ll like
- Configurable views to see projects as tables, boards, timelines, calendars, etc.
- Databases to track tasks, deadlines, progress bars, dependencies, and assignees
- AI writing assistance to generate drafts and improve project docs
- Automations for workflows like adding user stories and status updates
- Sprint templates for agile processes to groom backlogs and track bugs
- Integrations with tools like Figma, Slack, GitHub, and Jira
- Linked tasks so details are accessible directly within project plans
- Team collaboration features for task assignments, dependencies, and communications
- Wikis and docs to centralize knowledge and information
Pricing
Notion has four plans:
- Free
- Plus: $8 per user per month
- Business: $15 per user per month
- Enterprise: customized enterprise pricing
8. Airtable
Airtable is a cloud-based database and spreadsheet software that enables users to create customizable data tables that connect and display in an interface similar to spreadsheets.
The real value is Airtable’s ability to customize and build apps directly within the platform. Choose from over 80 apps or even create your own to tailor workflows and data analysis.
For example, Airtable has a “Project Management” database filled with useful apps to help you better manage your projects.
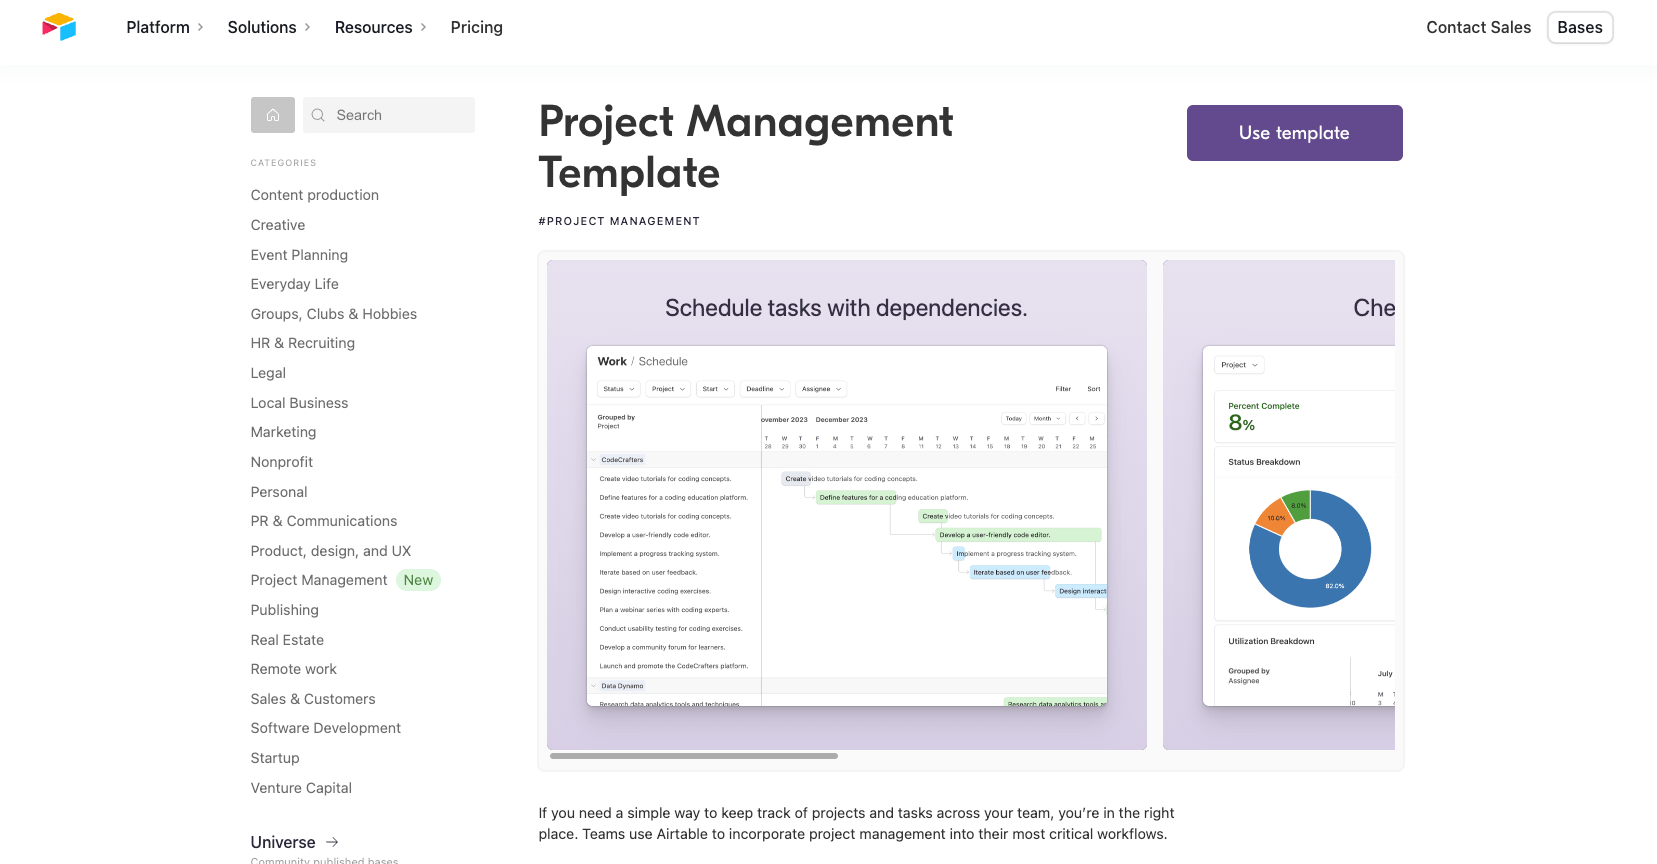
Once you install the database, you’ll get access to the following apps within it:
- My tasks: Customizable board to track personal to-do items, deadlines, and progress
- Projects & tasks: Central hub to coordinate project details, assign tasks, set dependencies, and track status. Integrates with Scheduling and Timelines
- Schedule: Gantt chart timeline view to visualize task schedules and identify dependencies. Ensures on-time delivery
- Kanban: Flexible board to organize tasks and work-in-progress by status. Streamlines team coordination
- Roadmap: High-level planning template to map out objectives, milestones, and launches
- Insights: At-a-glance visualization of project statistics like completion rates, traffic light status, and task allocation
- Team: Overview of team members, roles, and responsibilities across projects. Enables efficient delegation
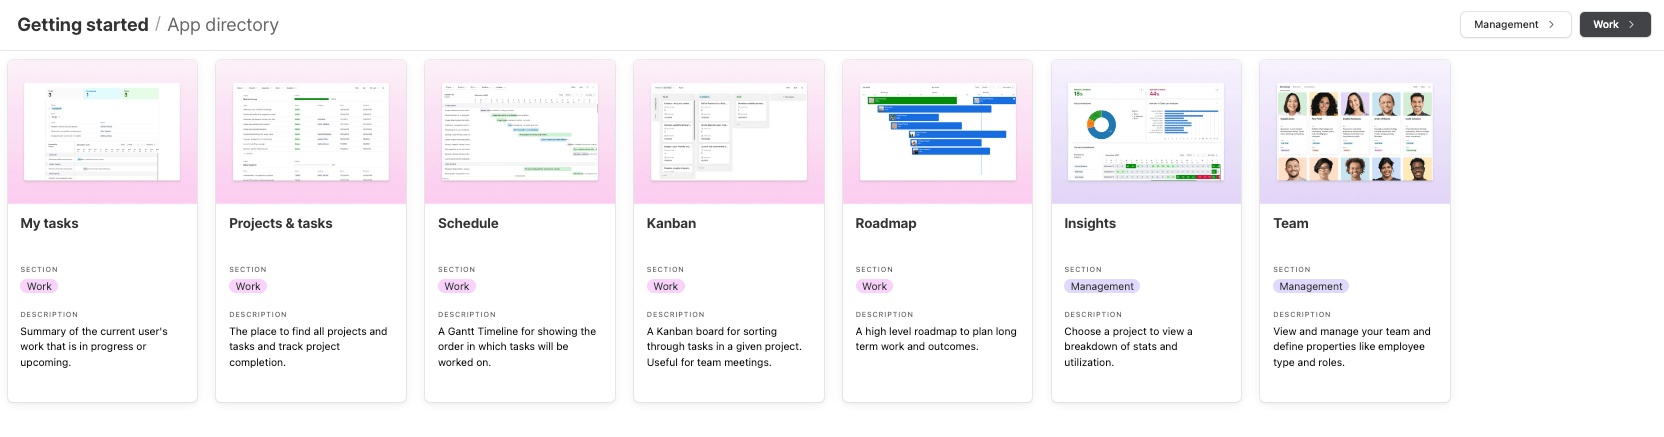
The “Roadmap” app offers a visualized schedule overview of projects, displaying colored bars stretching from start dates to end dates. To track progress easily, you can see completion percentages for each item (e.g. 100%, 50%, etc.)—bars will even show as green when fully complete.
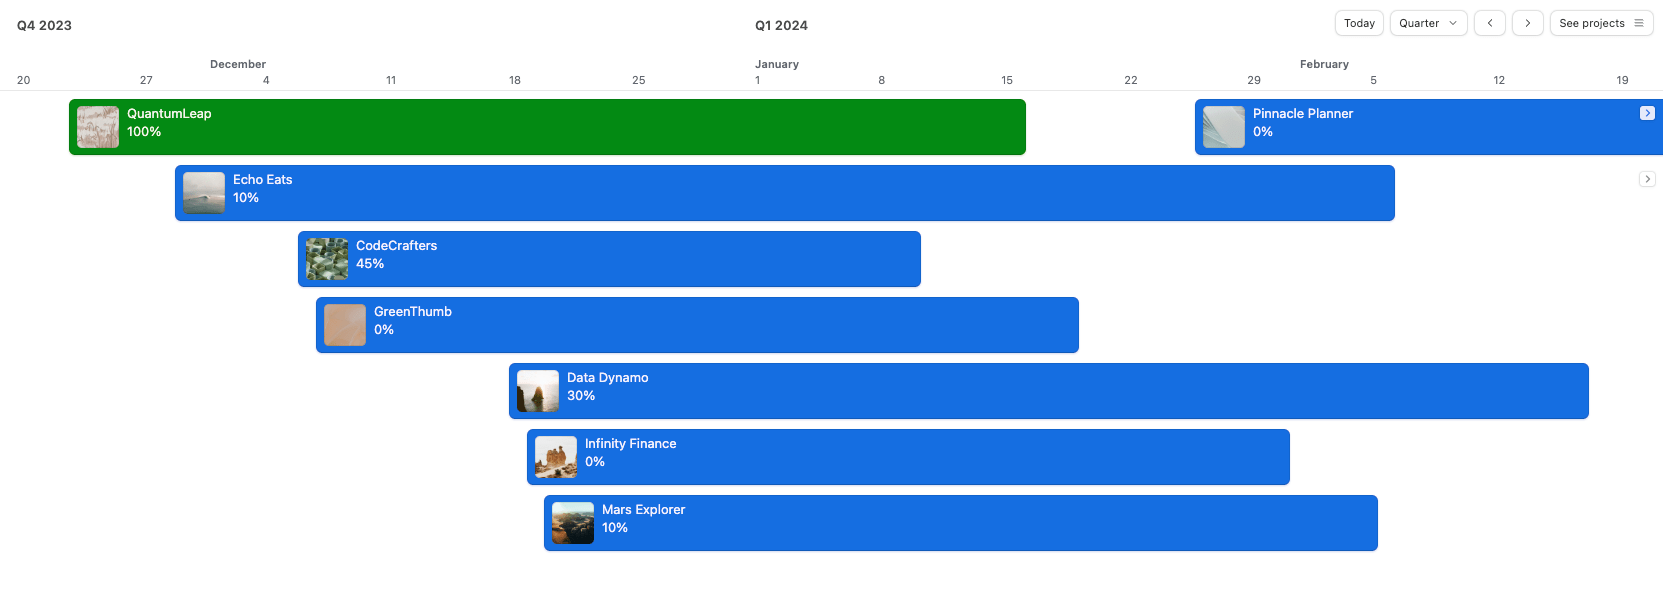
Click on one of the bars projects in the “Roadmap” to view project details like duration, to-do, in-progress, and completed tasks. Here, leave comments providing extra context, changes in scope, or feedback to those assigned to specific tasks within the project.
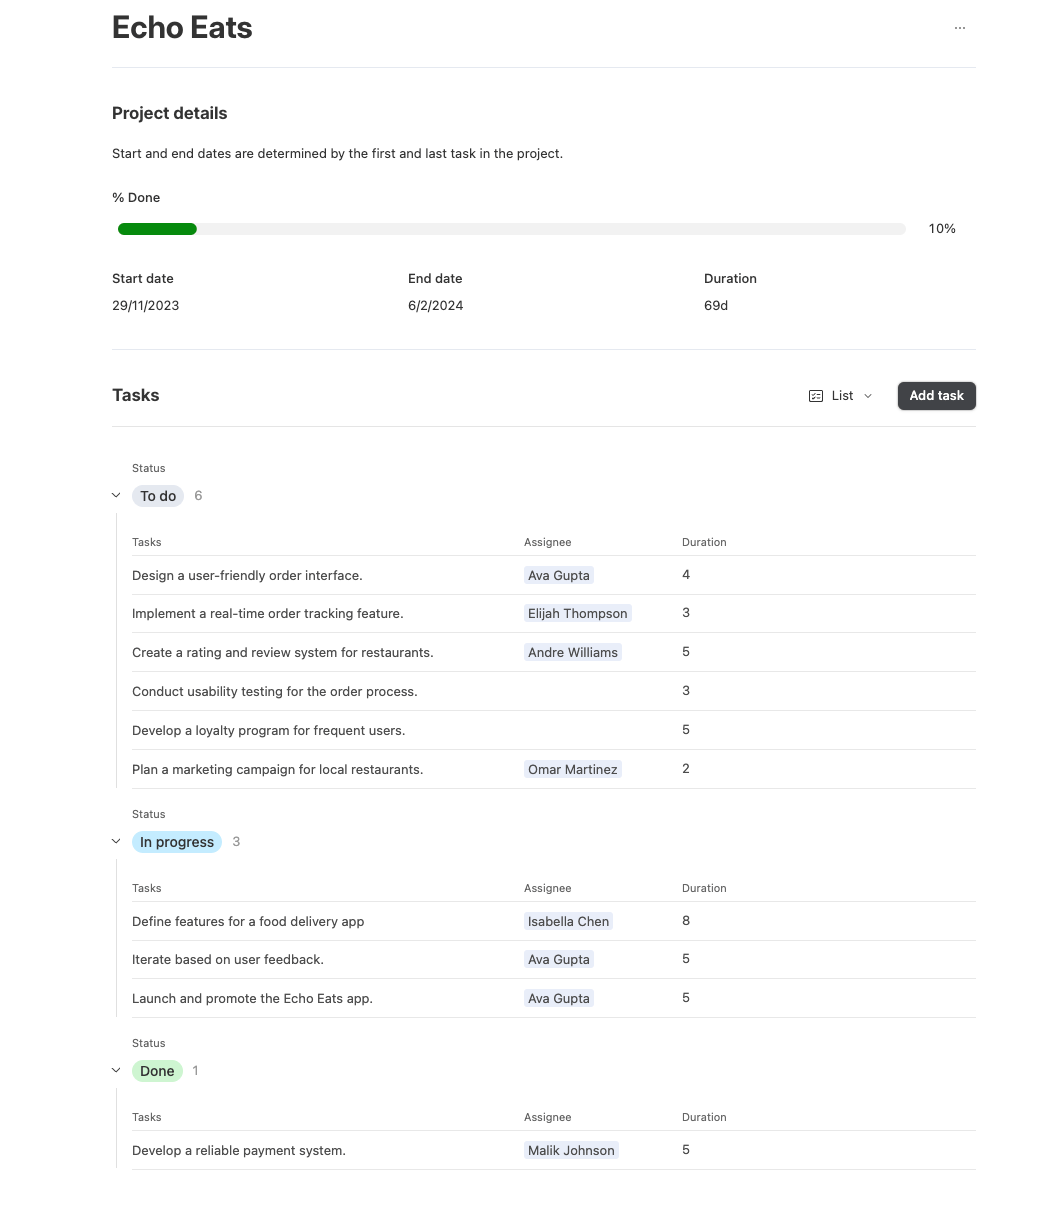
Airtable’s “Insights” dashboard within “Management” integrates analytical data visualizations for broader oversight to supplement this.
- The “Status Breakdown” pie chart breaks down all tasks across to-do, in progress, and done – giving a simple graphical representation of overall progress.
- The “Number of Tasks per Assignee” chart shows the volume of work assigned to each team member. This helps identify over or under-utilized resources.
- The “Utilization Breakdown” shows the number of hours each person works and where they spend their time.
At a higher level, indicator metrics quantify the percentage completed and overdue for all tasks. You can filter any report by assignee, project, or date range.
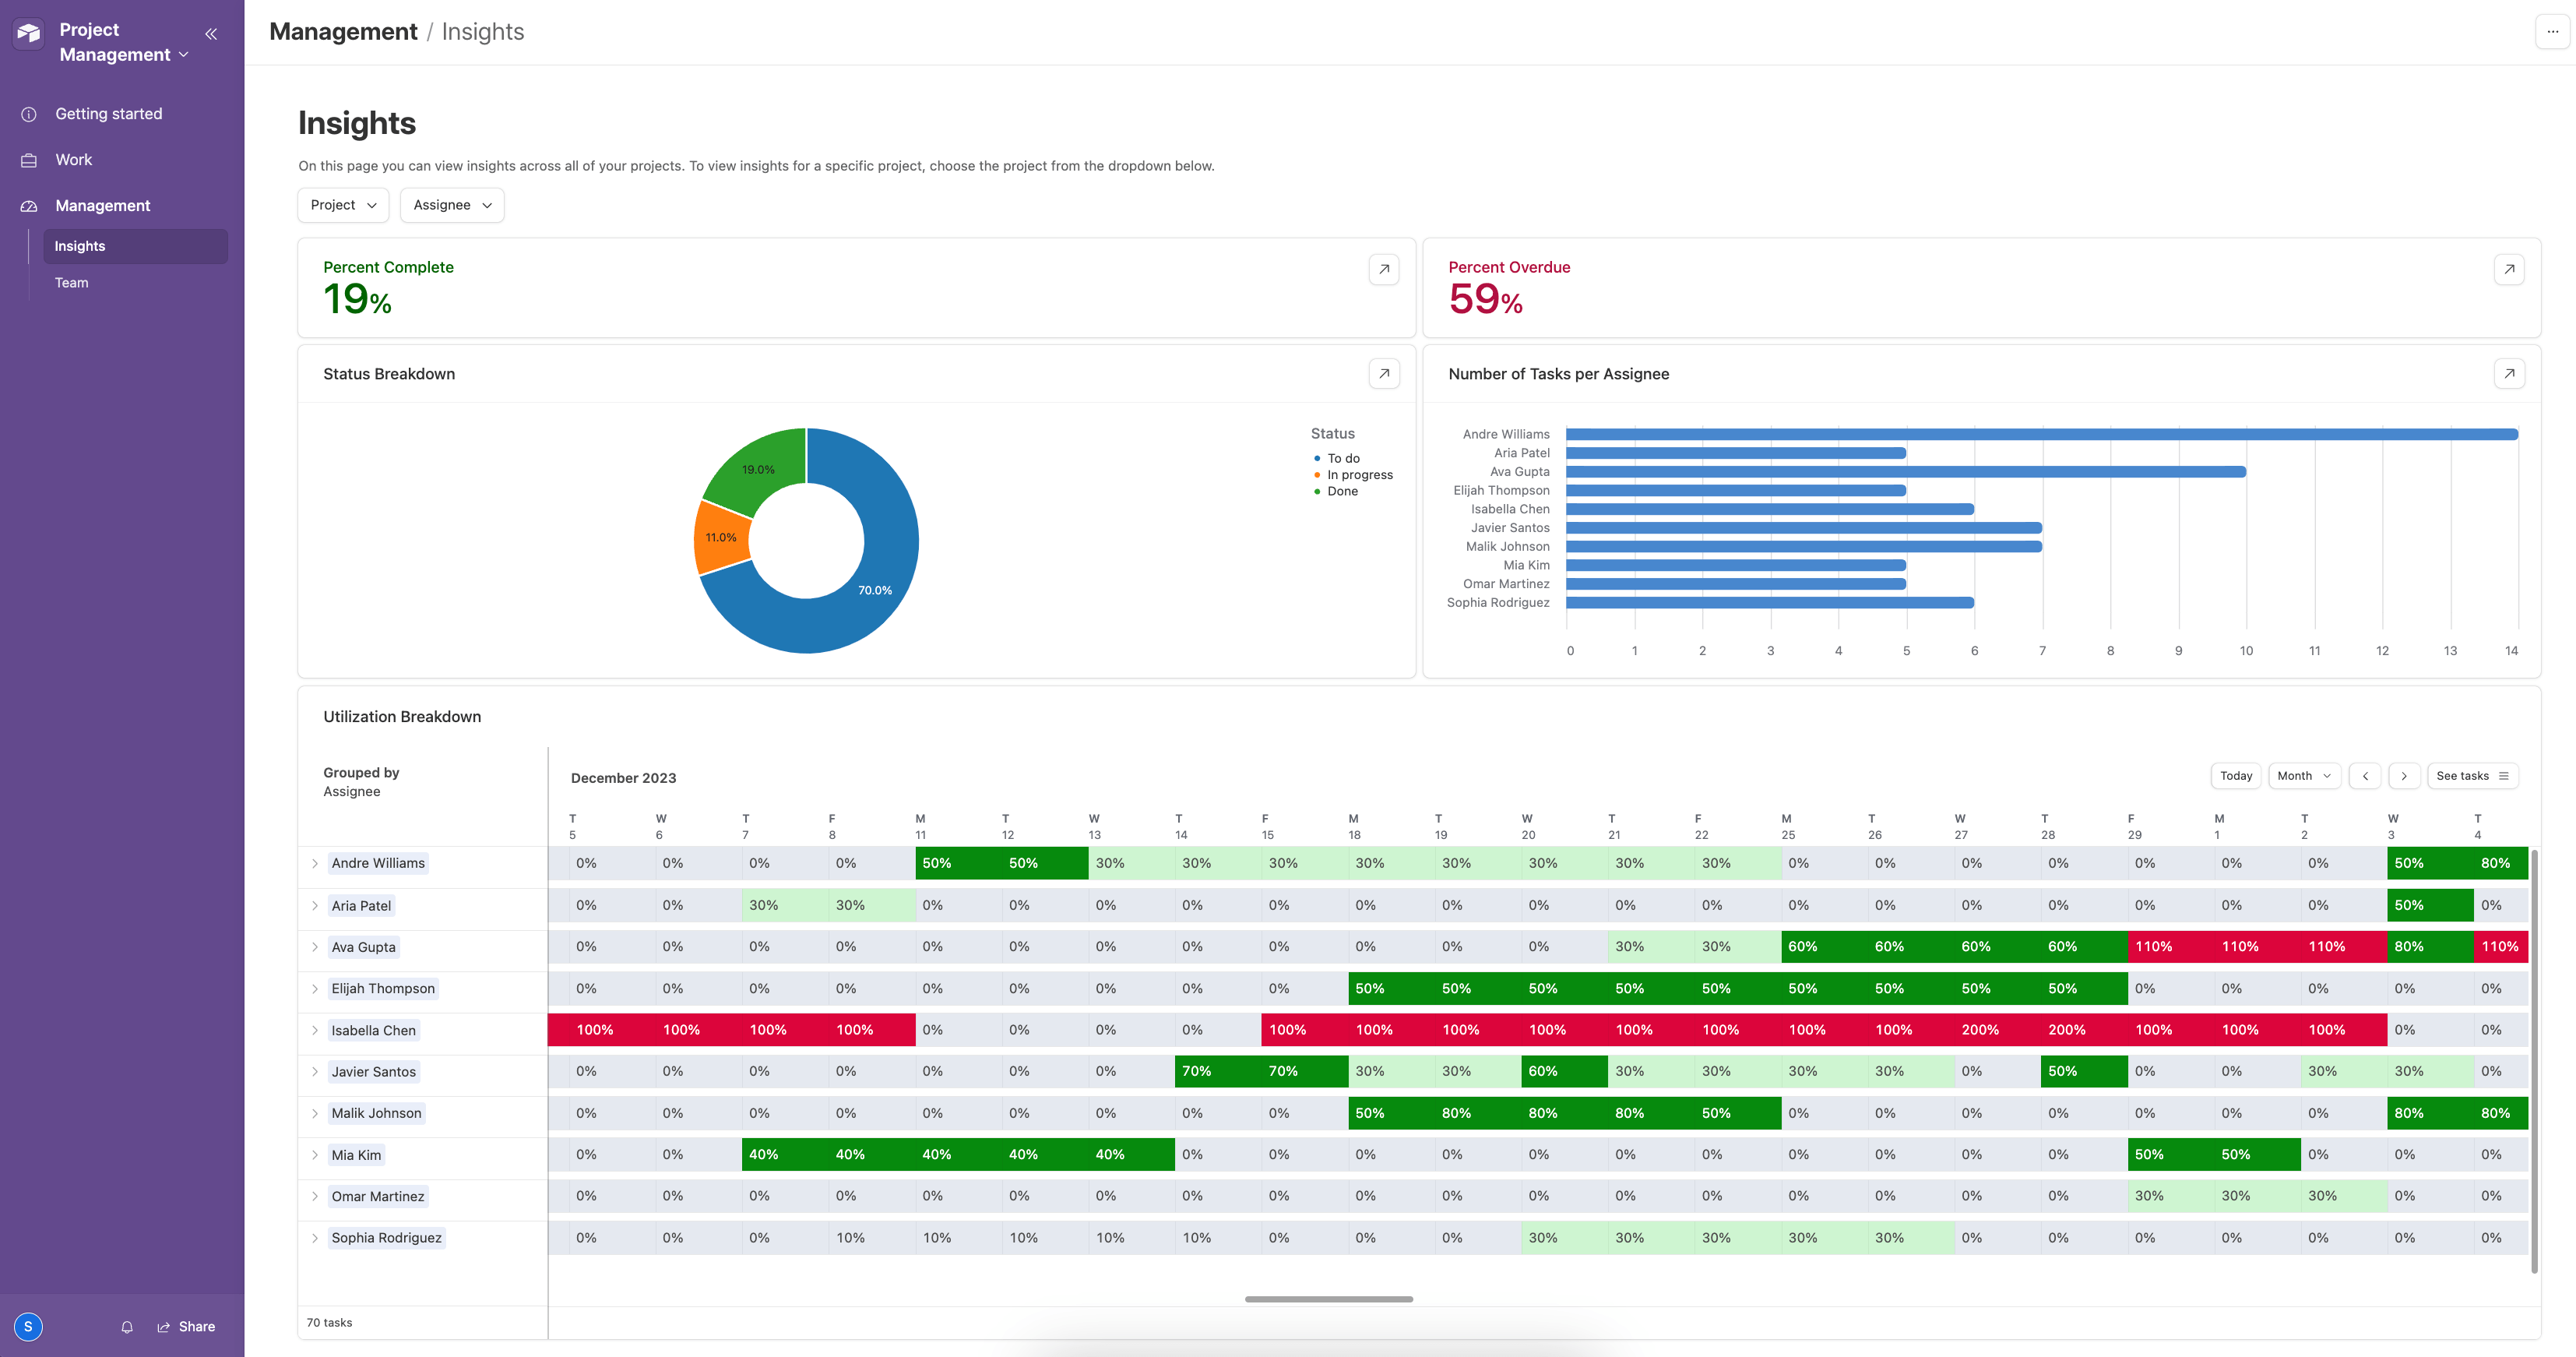
The “Status Breakdown” pie chart breaks down all tasks across to-do, in progress, and done – giving a simple graphical representation of overall progress.
What you’ll love
Anyone can create and share custom interfaces without coding with “Interface Designer.”
Design tailored interfaces that present project data in the most intuitive and actionable format for your teams—creating dashboards highlighting key project milestones, designing forms for seamless data entry, or setting up personalized views focusing on specific project aspects.
To create an interface, select the “Interfaces” button at the top of an existing base and “Create a new” to start building your new interface.
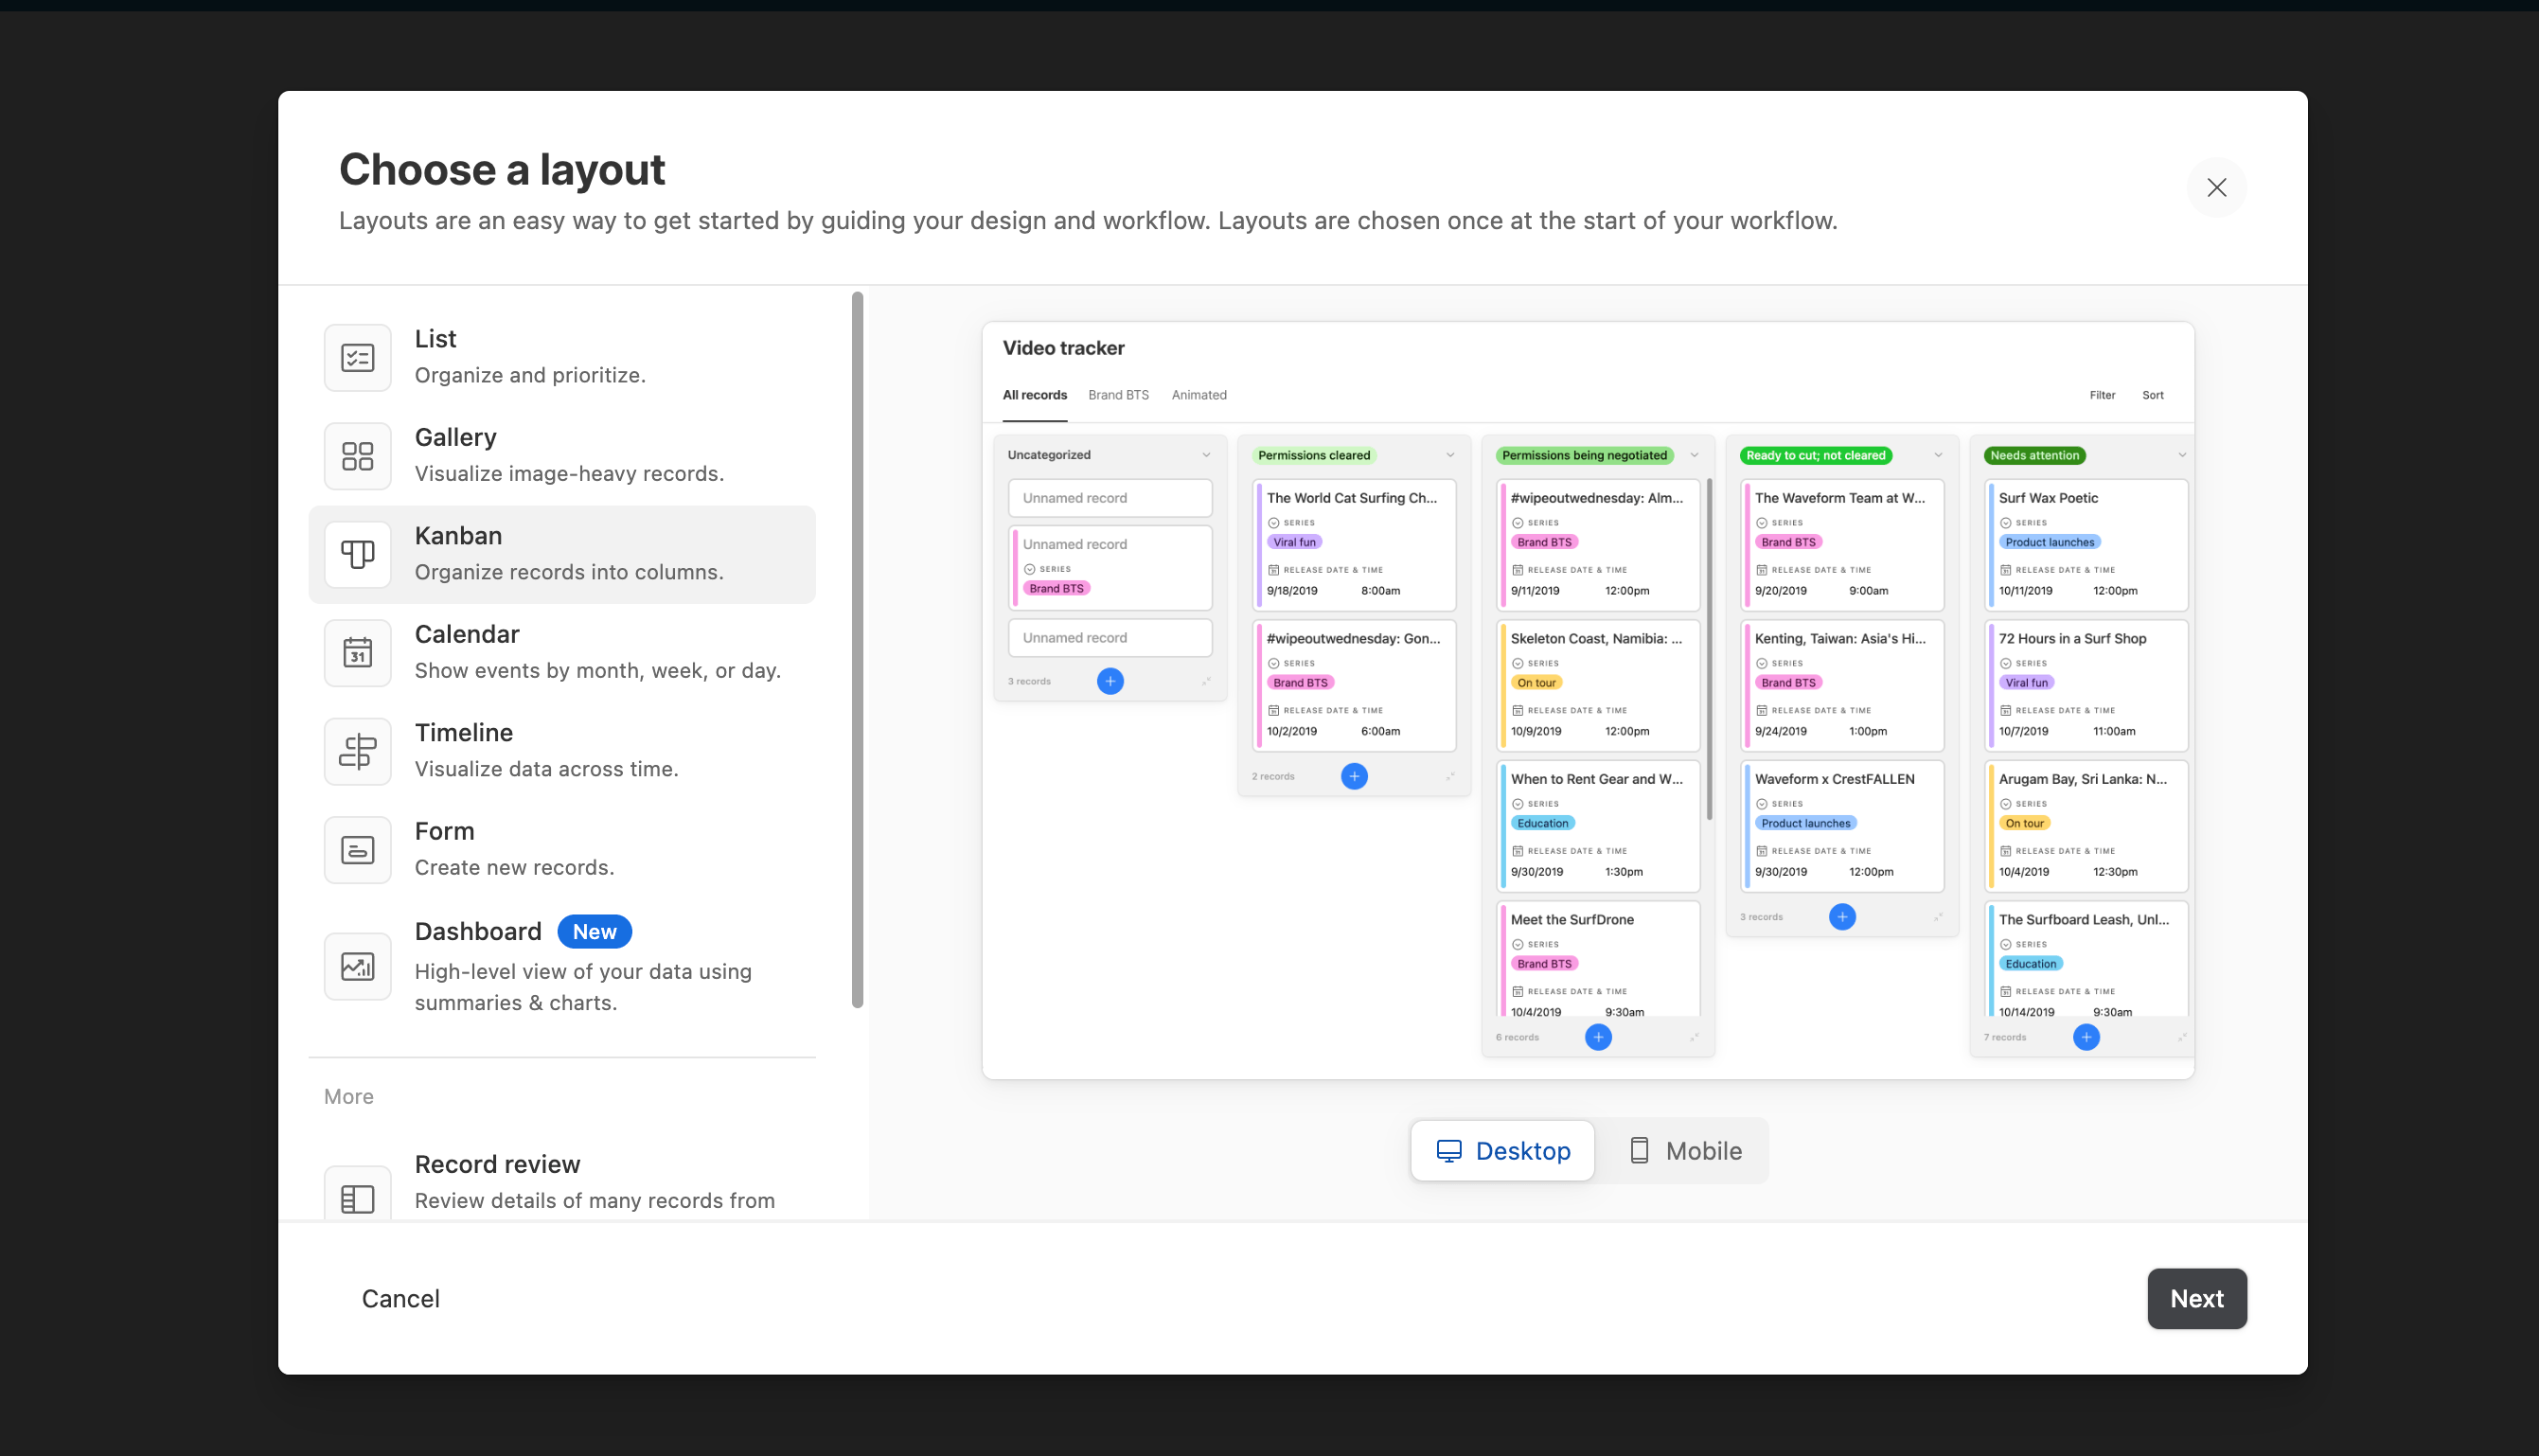
You can make a Kanban Board to track tasks and progress on a project visually. This allows you to map and categorize work into columns like “To-Do”, “In Progress,” and “Completed” for an at-a-glance status view.
Using the “Timeline” interface is great for mapping out the different phases and milestones of a project on a visual timeline. You can see how tasks fit together and ensure you hit key deadlines.
With a “Dashboard” interface, you can get a birds-eye look at overall project health. Add charts for task progress metrics and key data visualizations to monitor things like utilization, workload, and budget.
Core features of Airtable you’ll like
- Flexible databases to track projects, tasks, issues, resources, etc.
- Kanban boards to visualize workflows and task status
- Calendar views to schedule milestones and timelines
- Interactive interfaces to create custom views of data
- Reporting dashboards to analyze progress, utilization, and metrics
- Automatic notifications on task changes or overdue items
- Project templates with preset frameworks to get started quickly
- Collaboration tools like task assignments, comments, and activity logs
Pricing
Airtable has three plans:
- Free
- Team: $20 per user per month (billed annually)
- Business: $45 per user per month (billed annually)
- Enterprise Scale: customized enterprise pricing
9. Jira
The project management tool Jira, developed by Atlassian, is rooted in software development and agile project management. Jira lets you easily plan, track, and release software development projects.
For example, build workflows during the project planning phases with statuses like “To Do,” “In Progress,” and “Done” that match your team’s planning methodologies.
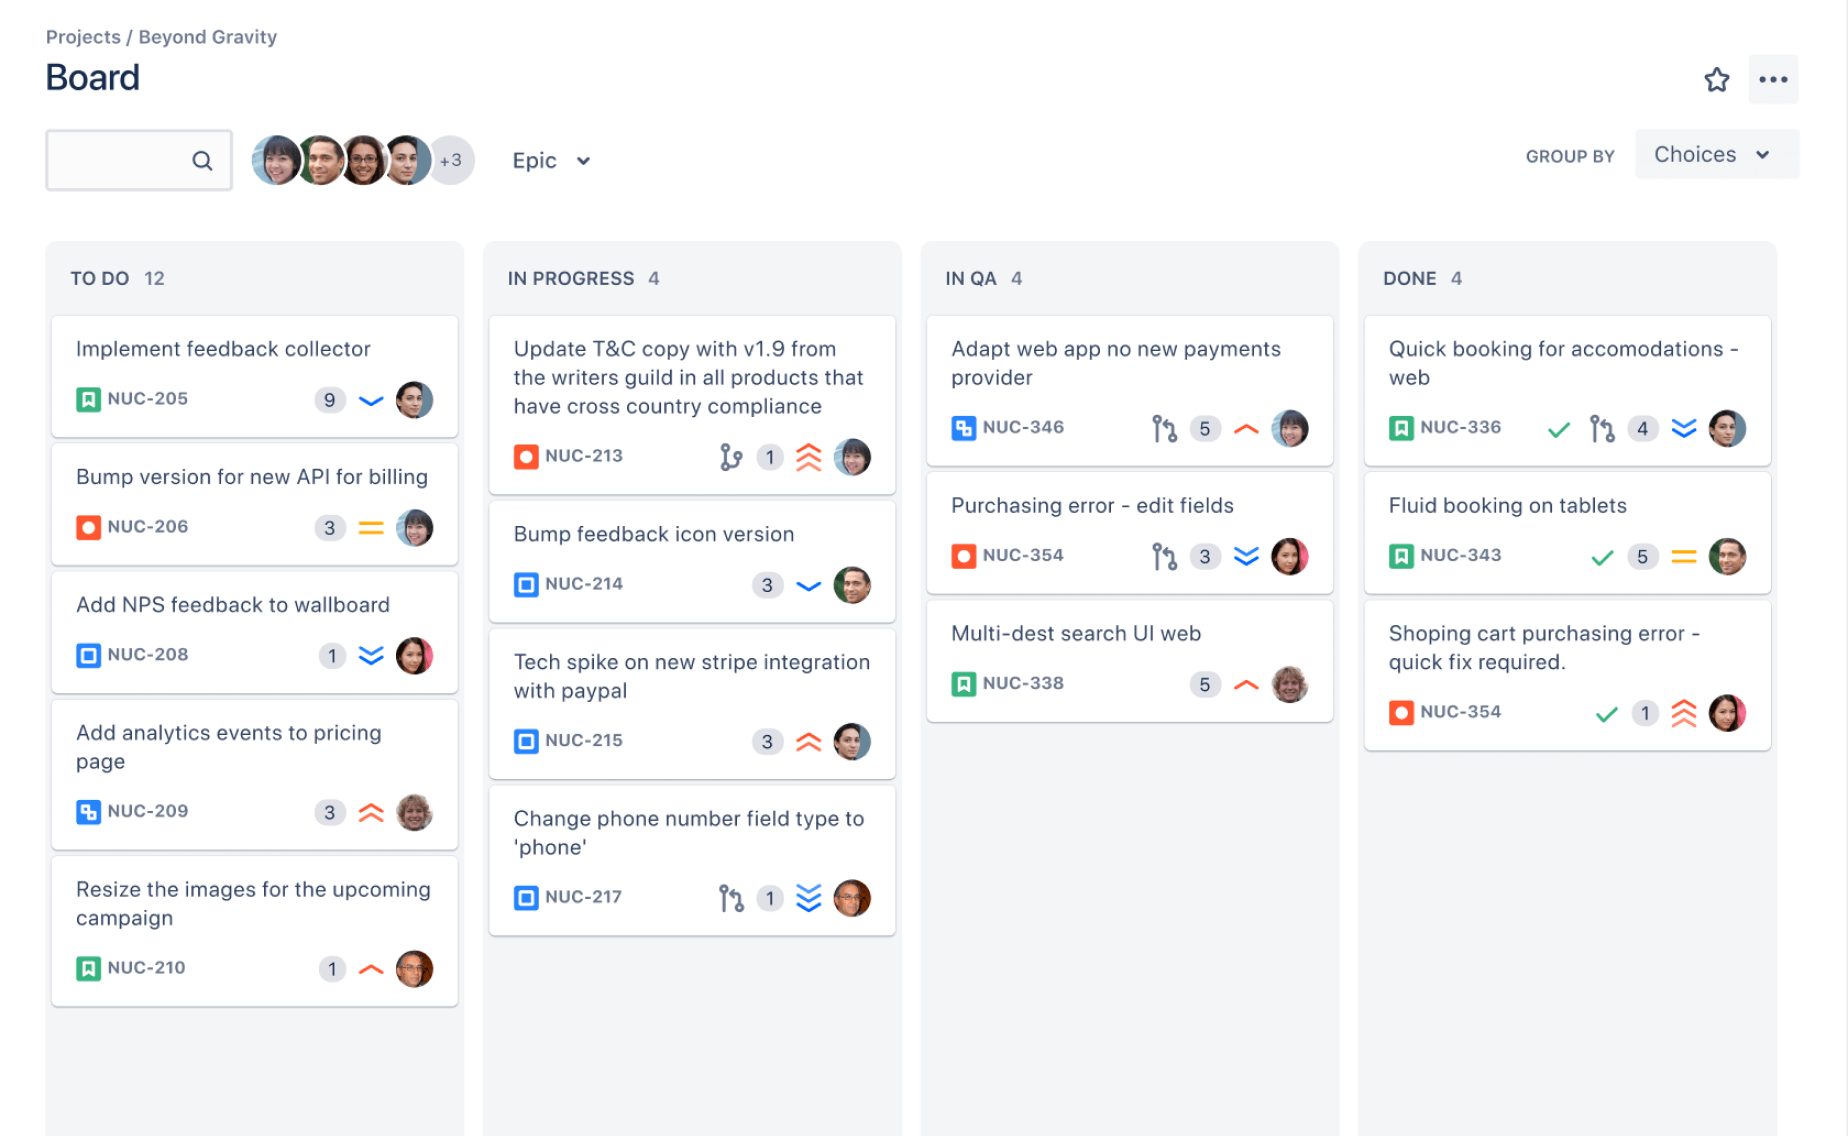
Once the project is up and running, get a snapshot of your team’s progress through the “Timeline” view.
It’s a Gantt chart view to visualize and plan the timing and sequence of individual issues. Schedule bars indicate when each issue in your project will start and end.
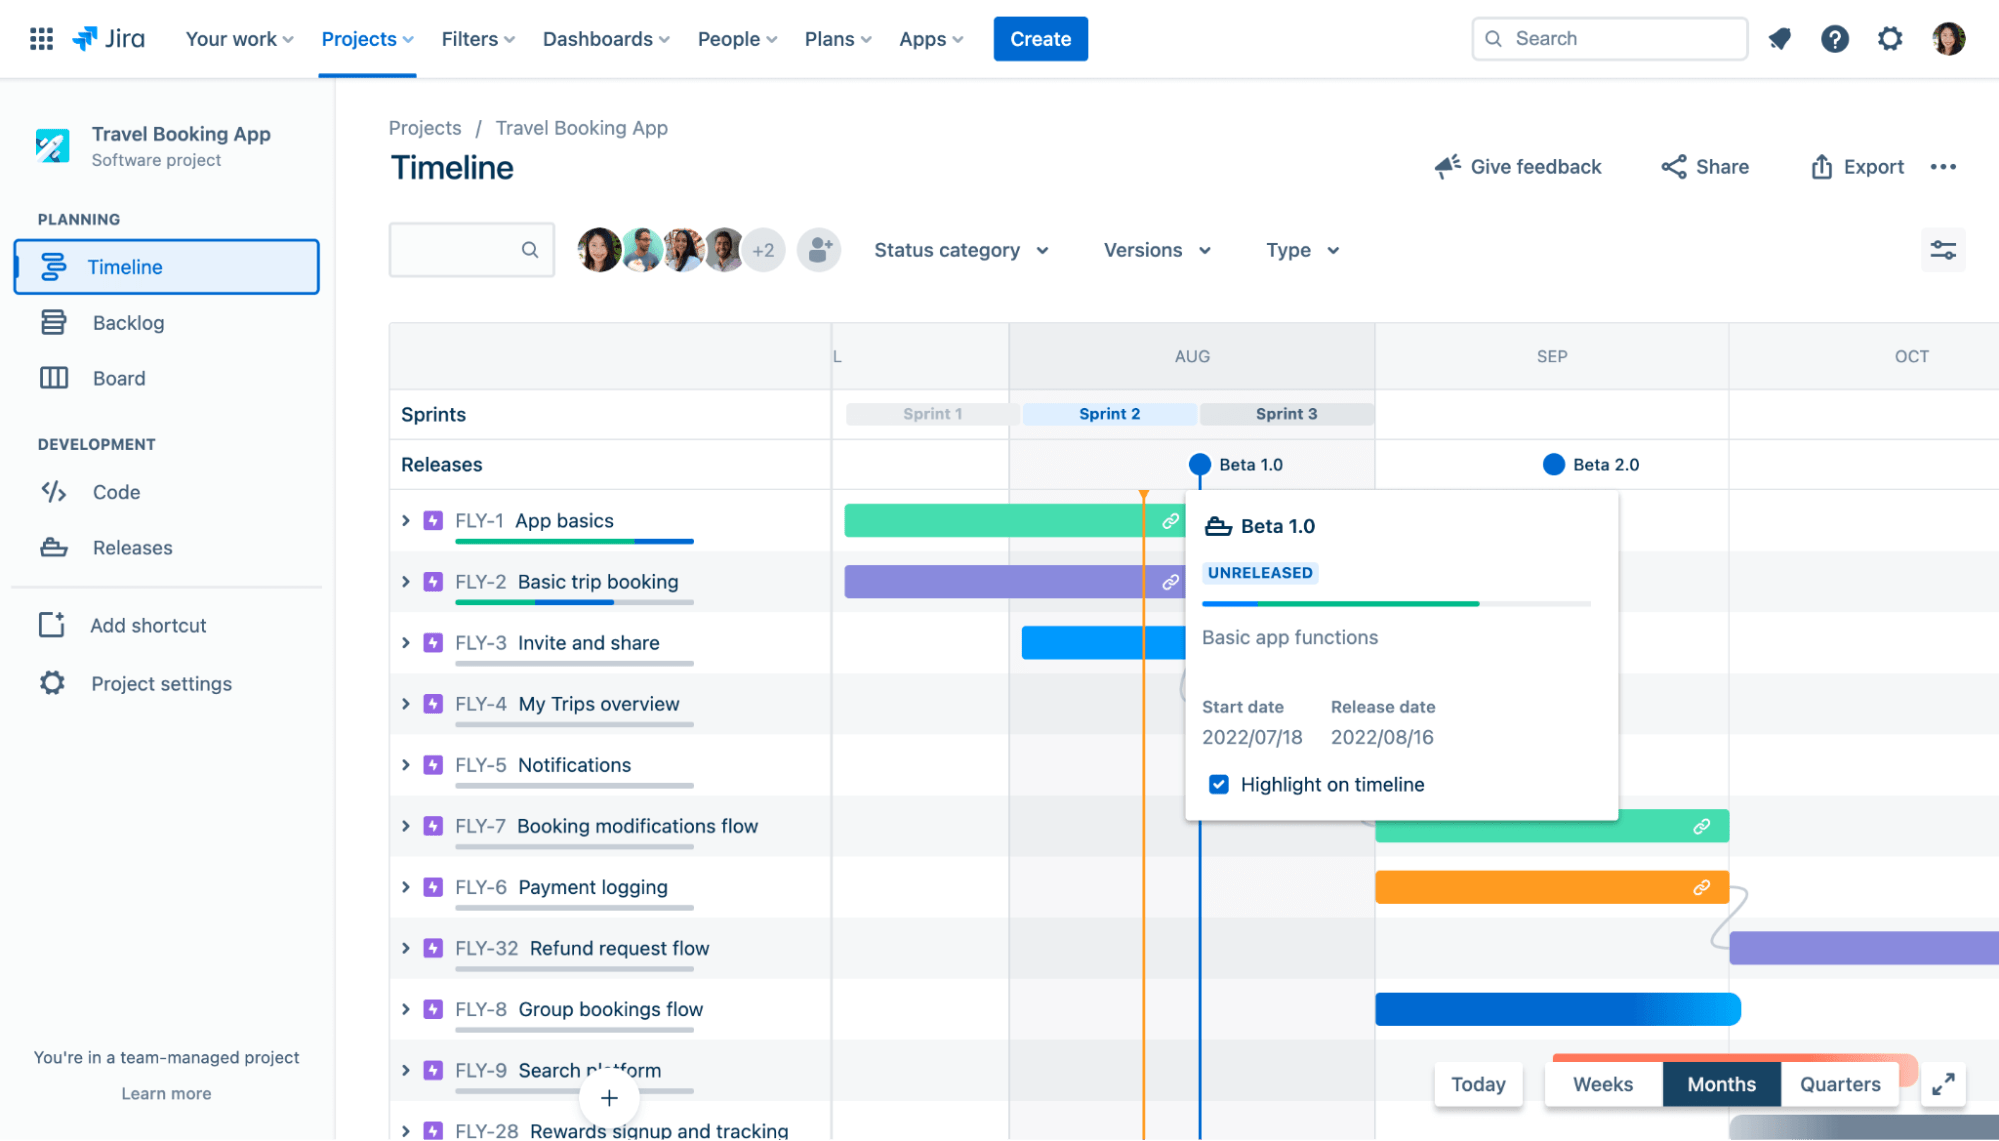
Use the view to:
- Adjust an issue’s start and due date or change the duration by dragging the handles of each bar
- Reschedule an issue by dragging the schedule bar
- Link issues in the timeline contingent on others being completed first.
- View which issues may be blocked due to a certain issue
- Change how much time you’re viewing with the button in the bottom right: Weeks, Months, or Quarters
Then, use the “Releases” tab to check which projects your team has released or is close to releasing. To show releases on your timeline, click “View” settings on the top right corner of your timeline and check the box next to “Releases.”
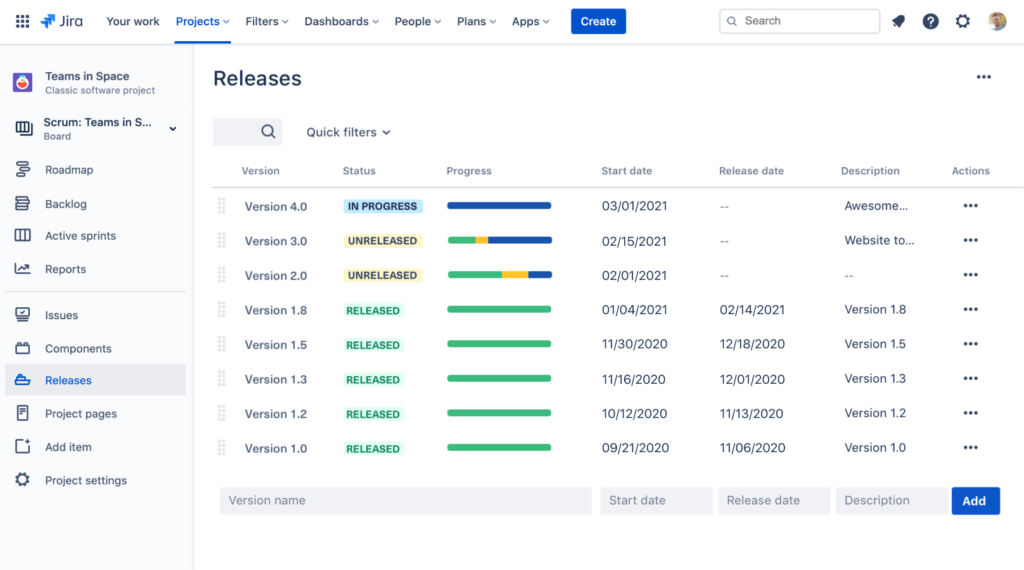
Lastly, Jira’s advanced reporting gives you a holistic view of how your team is performing.
For example, for scrum teams, Jira offers sprint reports, burndown charts, release burndowns, and velocity charts to improve planning and retrospectives.
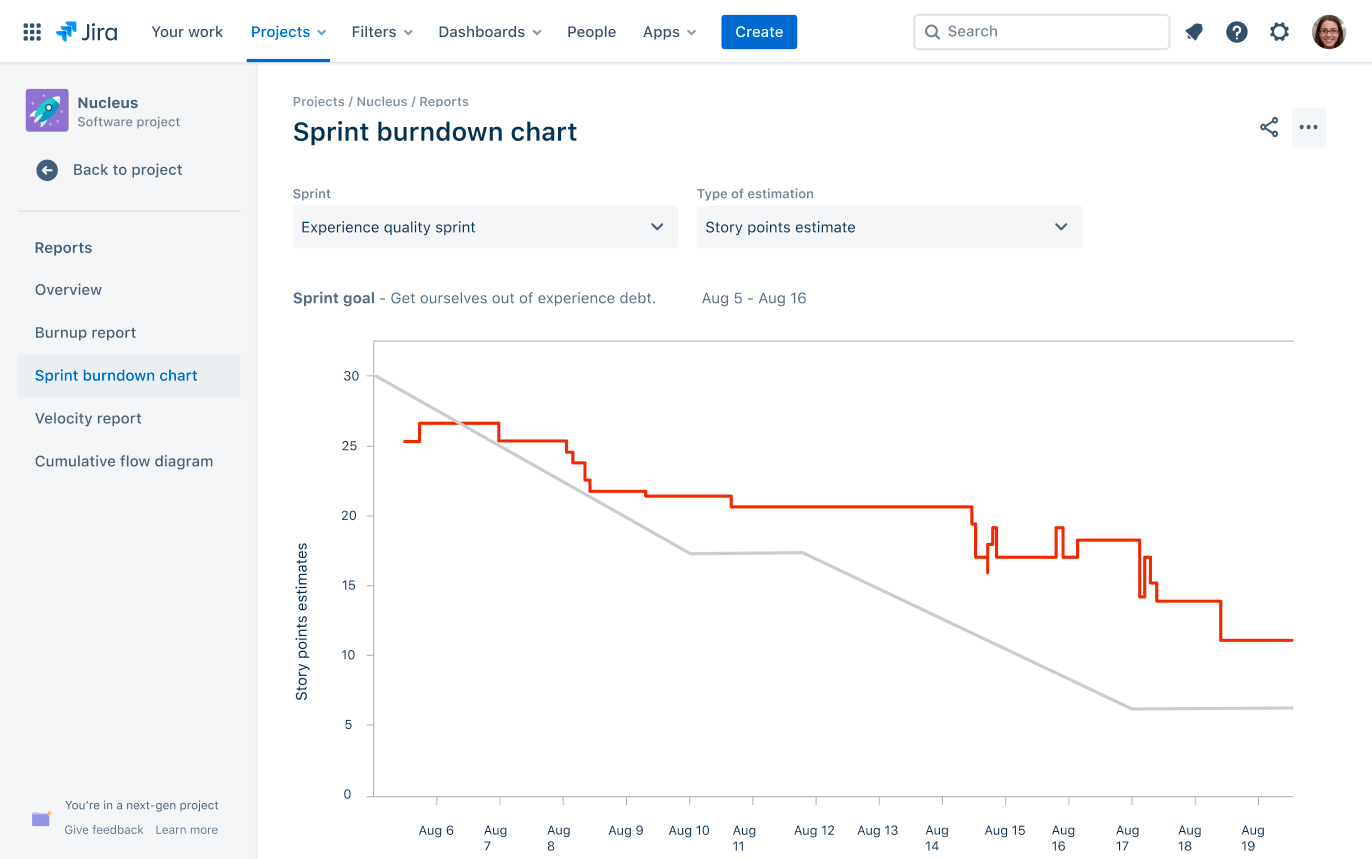
For Kanban teams, cumulative flow diagrams and control charts provide insights into workflow optimization. And issue analysis and forecasting reports help with capacity planning, workload management, and identifying trends.
What you’ll love
Jira features a powerful search functionality using “Jira Query Language.” The three flavors of search in Jira software — quick, basic, and advanced — can help you find important information about your projects.
For example, use JQL to find all high-priority bugs in a project the system hasn’t yet assigned and reported in the last two weeks. Targeted action lets you deal with critical issues quickly.
Core features of Jira you’ll like
- Scrum and Kanban boards to visualize and track work in sprints or continuous flows
- Backlogs to organize issues and plan sprints
- Roadmaps to map out initiatives on visual timelines and see dependencies
- Reports like burndown charts, velocity, and control charts to monitor progress
- Agile workflows that are customizable for any team’s processes
- Versions for planning and tracking software releases
- Issue types to categorize different types of work like bugs, stories, tasks
- Search and filters to find relevant issues and build dashboards quickly
- Integrations with 1,000+ other apps, including GitHub, Jenkins, Slack
- Automation to simplify repetitive tasks like subtasks, transitions, assignments
- Custom fields to capture additional metadata like priorities, components, environments
- Permissions to control access and edit rights across projects
Pricing
Jira has four plans:
- Free: for 10 users or less
- Standard: $850 per year (user tier 1 to 10)
- Premium: $1,600 per year (user tier 1 to 10)
- Enterprise: customized enterprise pricing
10. Adobe Workfront
Adobe Workfront is an enterprise work management platform built for creative teams.
At a high level, “Work Charts” surfaces key statistics through its dashboard to help spot bottlenecks across portfolio health, on-time delivery, duration, and workload. To access the analytics dashboard, click the “Main Menu” icon and select “Analytics.”
Here’s what it looks like:
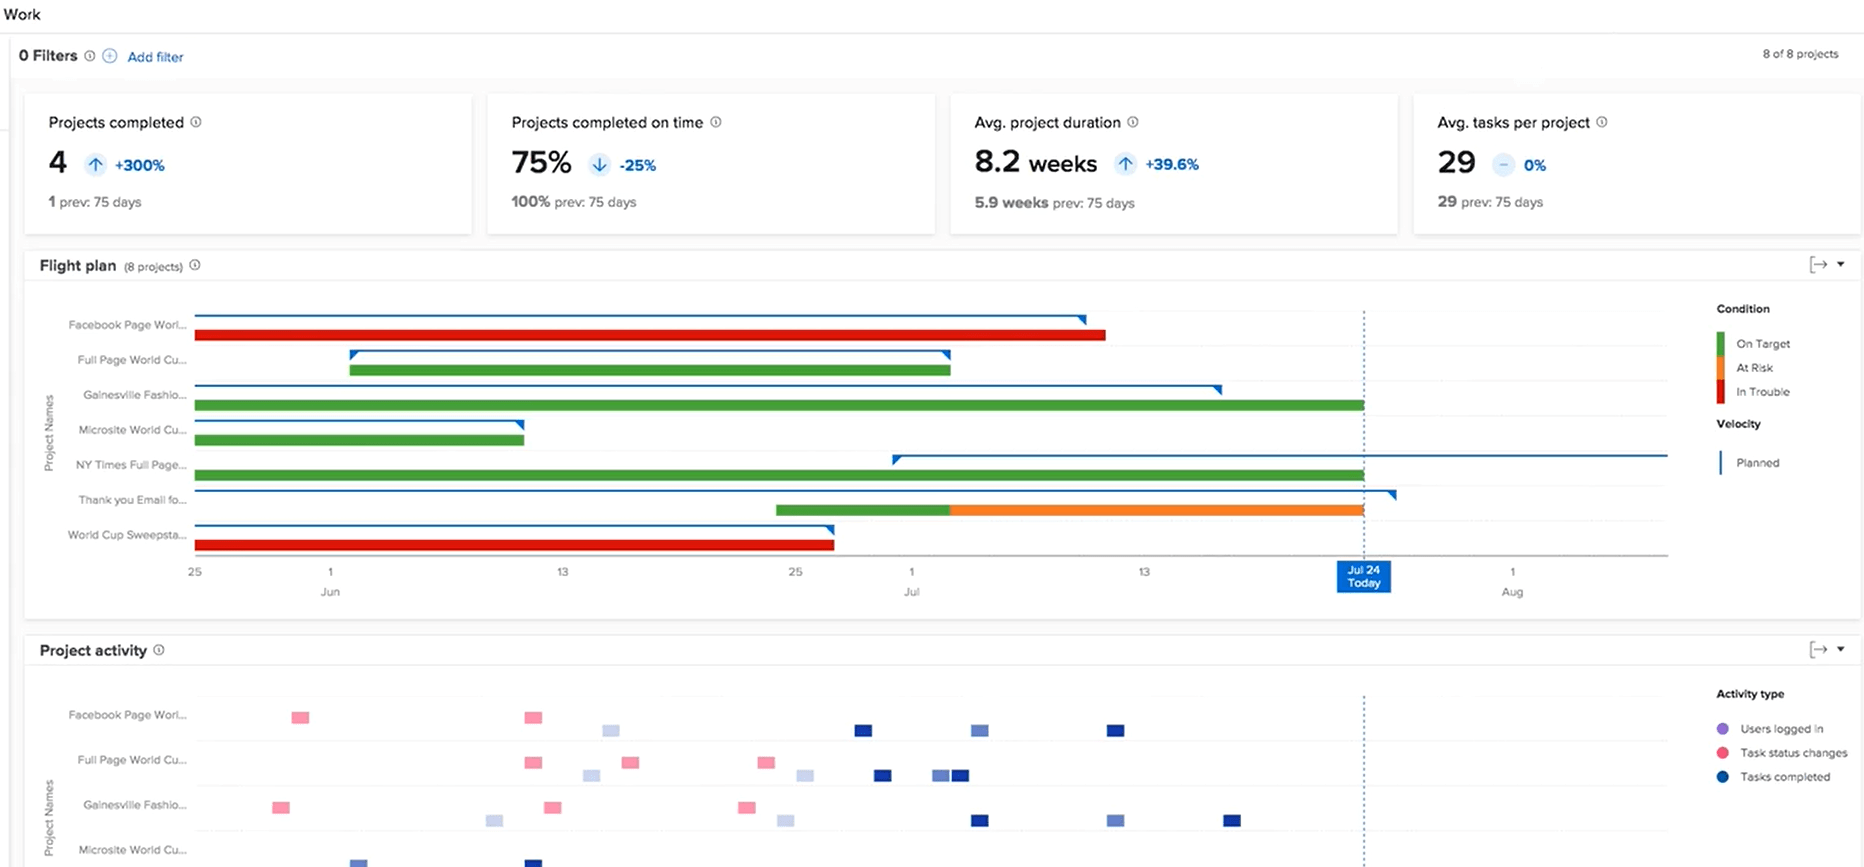
KPIs like projects completed, projects completed on time, average project durations, and average tasks per project help you spot bottlenecks across portfolio health, on-time delivery, duration, and workload.
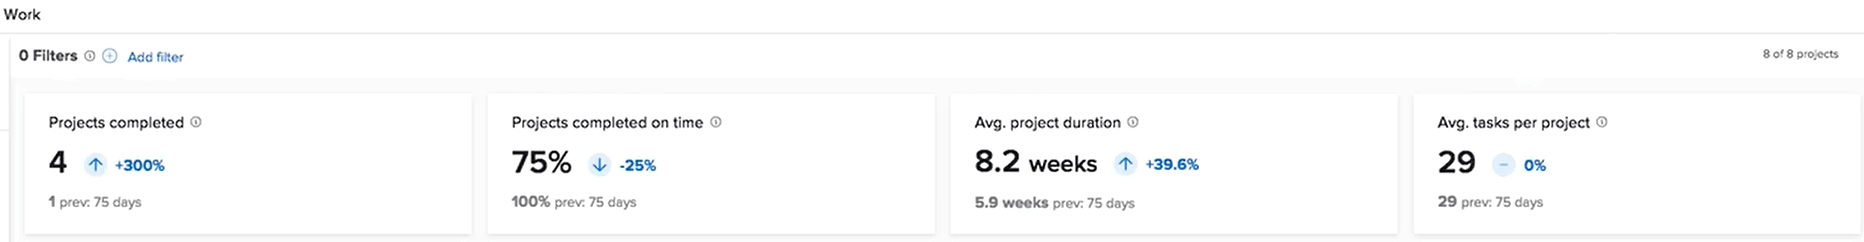
Teams can also visualize project timelines and completion risk through Workfront’s “Flight Plan” chart. This timeline view plots out planned vs actual start and end dates to reveal delays plus projects that are on target (green), at-risk (orange), or in trouble (red).
To view the “Flight Plan” chart, filter to relevant projects, scroll to the “Flight Plan” chart and hover over lines to see dates.
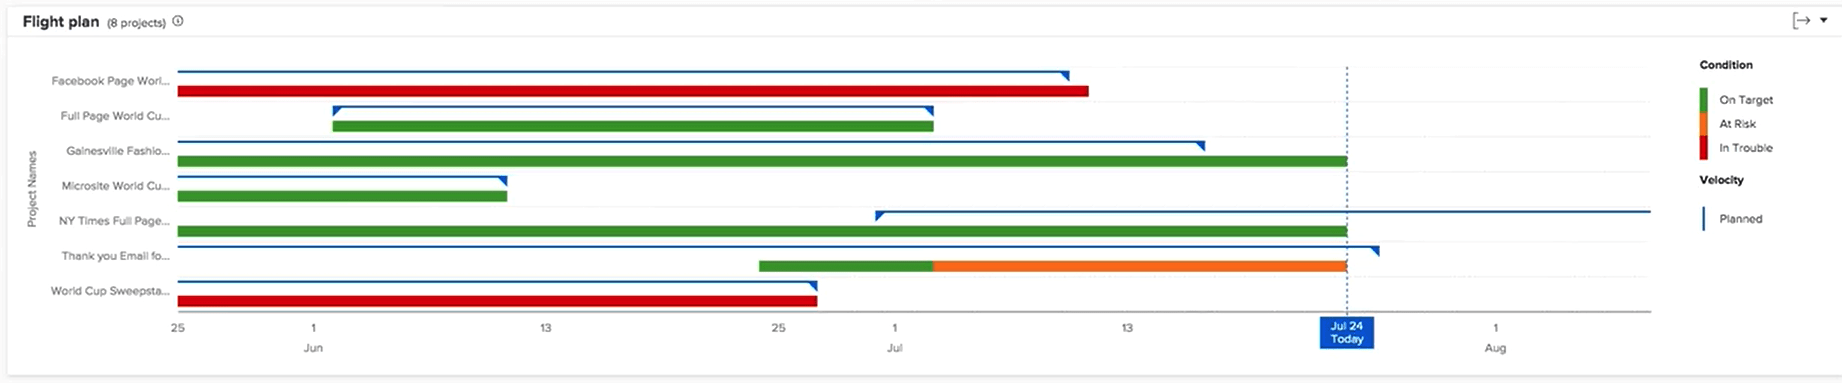
As you move below, the “Project” activity chart allows you to understand and compare project activities—users logged in, task status changes, and tasks completed—against other projects in Workfront. Project activities are displayed in different colors to summarize the activities over a period of time.
Seeing this information helps you determine:
- The activity on a specific project.
- The activity of one project compared to other projects.
- Which users are working on a project, and at what frequency
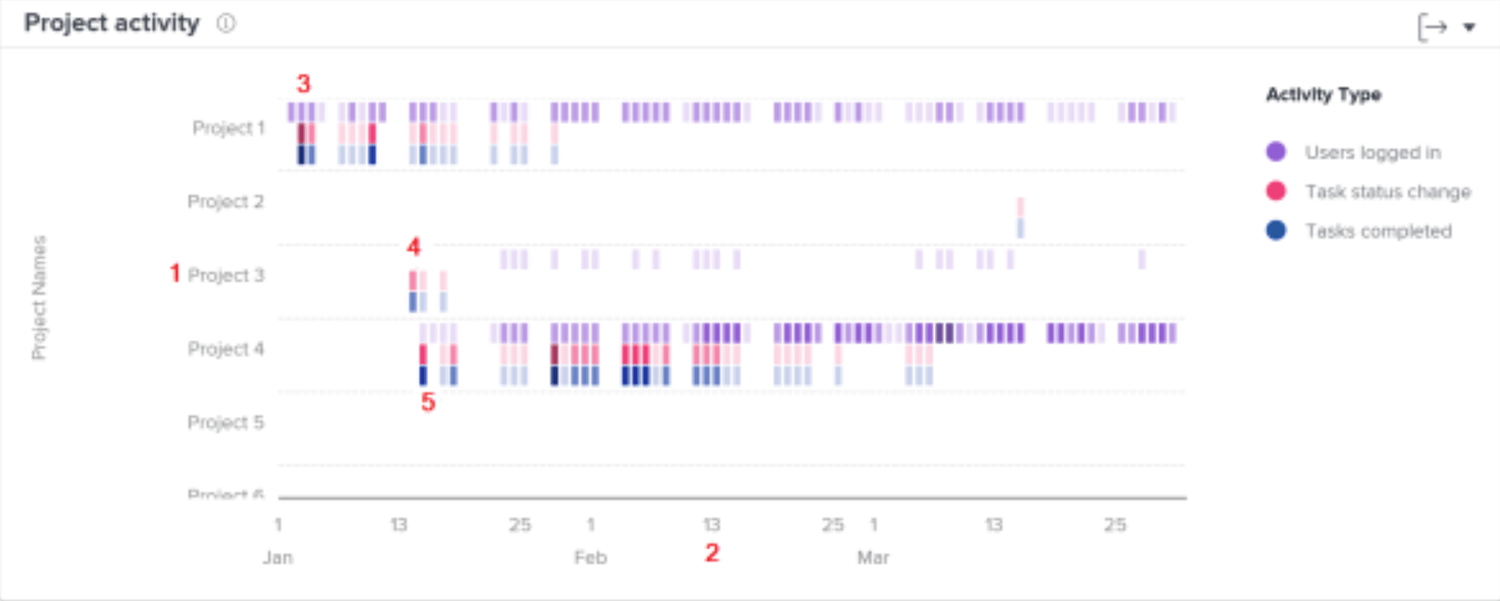
Lastly, at a more granular level, Workfront offers a “Tree Map” chart for understanding time breakdowns across specific initiatives. The boxes represent projects, with size proportional to the effort spent.
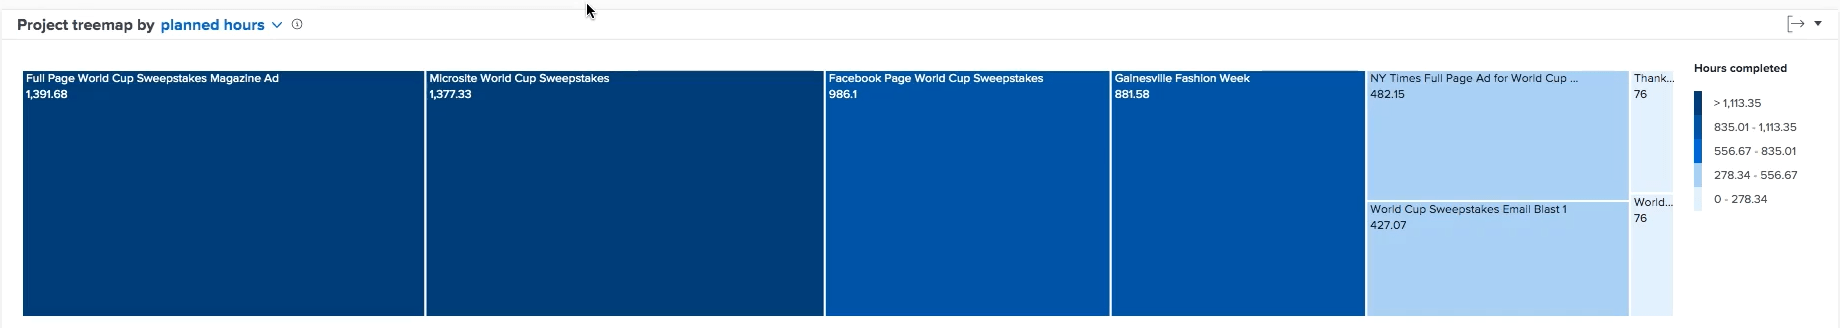
What you’ll love
The “Portfolio Optimizer” helps you to prioritize projects based on net value, alignment, cost, risk, and ROI.
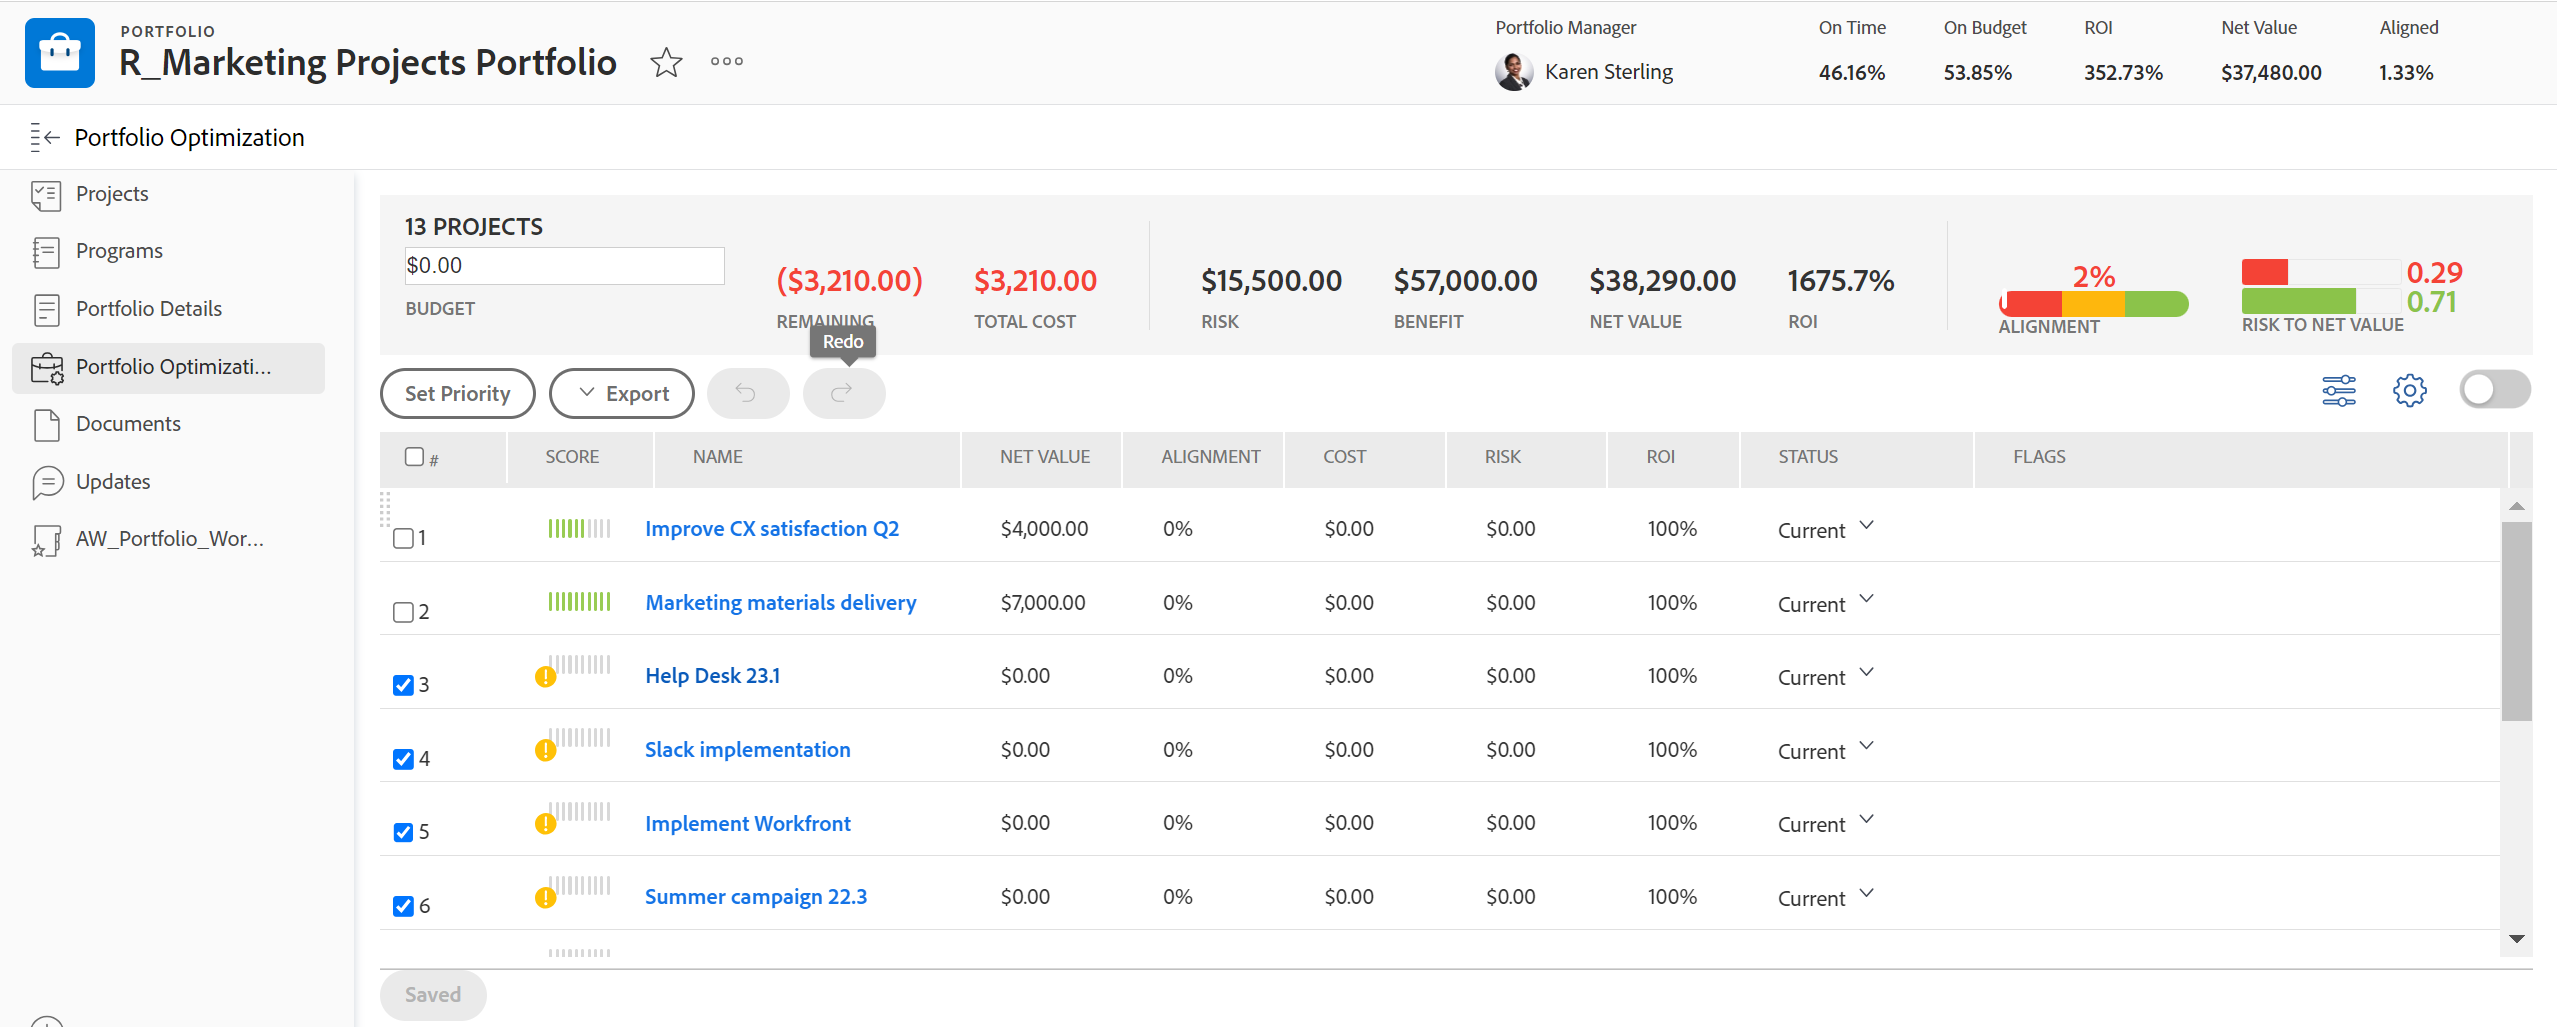
You can evaluate projects against these dimensions:
- Net Value: Look at the total net value (planned benefits minus costs) calculated for each project and the entire portfolio. This allows you to prioritize projects that deliver the highest net value to your organization.
- Alignment: Review the alignment score given to each project based on how well it supports your company’s strategic objectives. This score is determined using the scorecard in the project’s business case. Pay attention to the average portfolio alignment score shown as well. Prioritize projects that are highly aligned with your strategy.
- Cost: Examine the total cost, budget, and remaining budget provided for your portfolio. Drill down to see each project’s individual costs, too. This cost data enables you to prioritize lower-cost projects when needed to manage budget constraints.
- Risk: Assess the total potential risk cost of your portfolio and the risk costs of individual projects. Use the Risk to Net Value indicator to weigh potential risks against the expected net value. Focus on prioritizing lower-risk projects to minimize uncertainty.
- ROI: Analyze the portfolio ROI calculated from the total planned benefits and budgeted costs of your projects. Maximize value by prioritizing the projects with the highest ROI.
By digging into these dimensions using the data surfaced in the “Portfolio Optimizer”, you’ll have the data to make better financial decisions for your business.
Core features of Adone Workfront you’ll like
- Work automation to connect systems, sync data, and automate workflows across applications
- Budget & expense management for real-time visibility into budgeted, forecasted, and actual spend
- Workflow management to streamline end-to-end processes from strategy to delivery
- Proofing & approvals for collaborative document reviews and approvals in a single tool
- Reporting & dashboards for real-time insights and automated reporting to stakeholders
- Enterprise security with industry-recognized standards to protect critical business data
- Integrations with Adobe Creative Cloud, Experience Cloud, Anaplan, and other key apps
- Resource management to optimize team capacity and balance workloads across projects
- Templates to standardize best practices and eliminate manual processes
Pricing
Workfront has three plans with custom pricing:
- Select
- Prime
- Ultimate
Detailed pricing is available upon request
11. Smartsheet
Smartsheet’s spreadsheet-like interface combines the familiarity of traditional spreadsheets with powerful project management features.
The sheet is the foundation of your work—view a sheet as a “Grid,” “Gantt chart,” “Calendar,” or “Card.” Use the Views buttons in the top toolbar to switch between these views.
For example, the interactive Gantt chart outlines all tasks, owners, start/end dates, and dependencies within a project. You can easily drag and drop to re-order tasks or adjust timelines. The Gantt auto-adjusts around dependencies to plan projects, establish critical paths, and confidently meet deadlines. 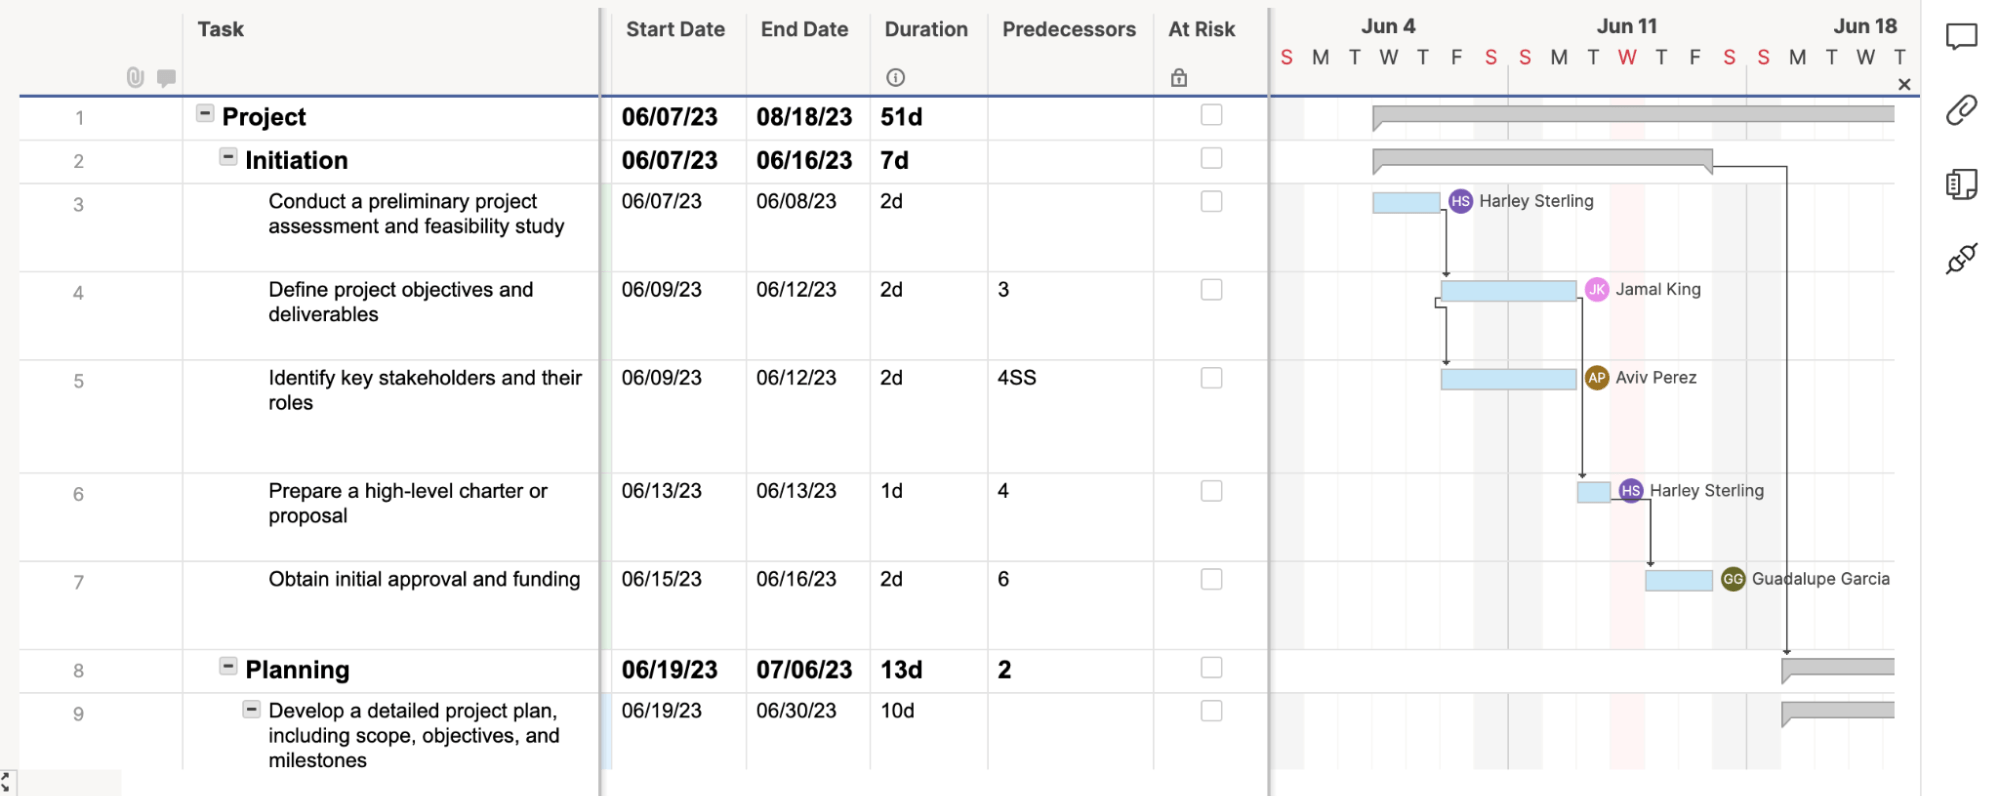
The Gantt chart is handy when assigning resources to tasks and seeing how proposed schedule changes may impact team members. The resource utilization functionality shows over- and under-allocation at a glance.
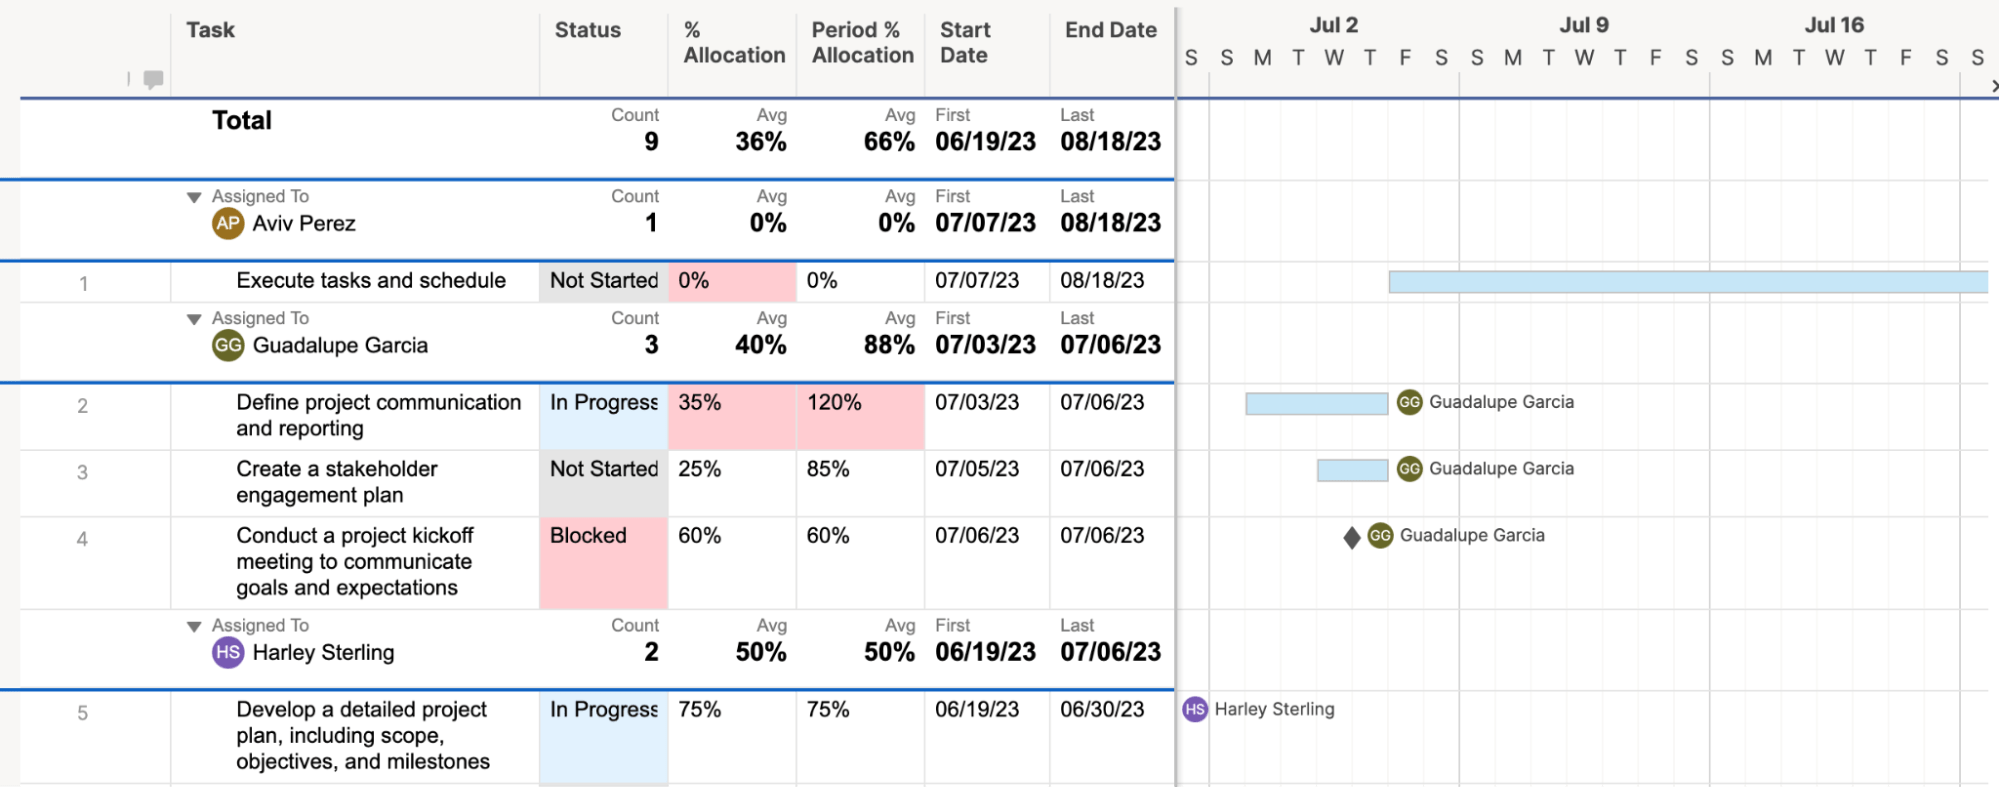
All project info rolls up into Smartsheet’s customizable dashboards that display high-level metrics.
For example, the “Project & Resource Overview” dashboard shows key data like budget vs actual hours, completion status, and resource allocation across projects.
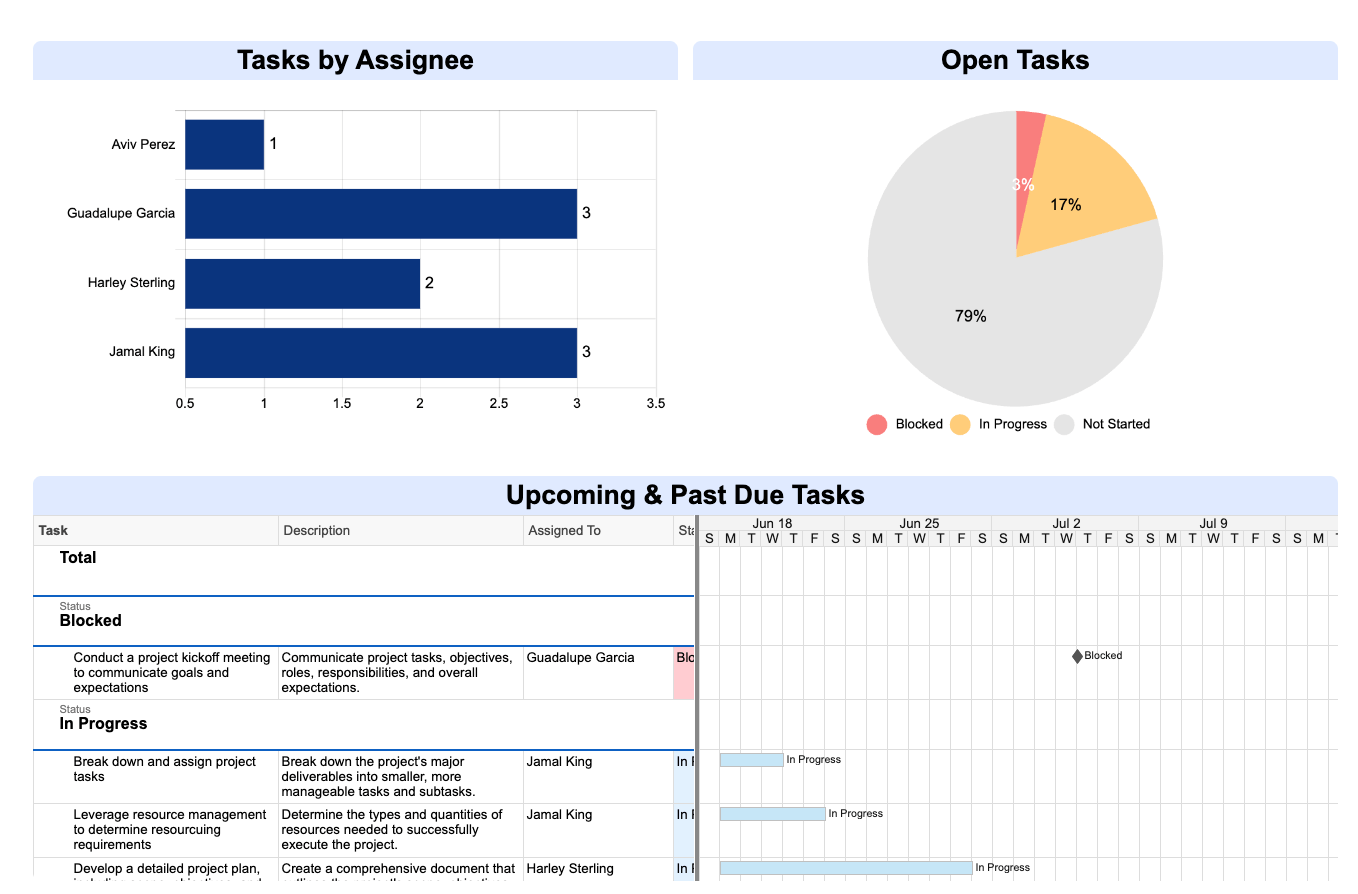
The dashboard allows you to compare planned timelines and budgets against actuals to pinpoint areas for intervention or adjustment.
You can also add other widgets to showcase sheets, reports, charts, forms, and content from other places like Google Docs, Tableau, Power BI, and YouTube.
The interactive views and dashboard roll-ups give managers clear visibility into resource utilization, project status, and progress toward goals.
What you’ll love
Cross-sheet formulas in Smartsheet allow you to track, analyze, and report on data across multiple sheets.
Use functions like VLOOKUP, SUMIF, and COUNTIF to consolidate critical project metrics from various sources into a central dashboard and enable real-time visibility into project status, resource allocation, and performance metrics.
Here are some examples of useful cross-sheet formulas:
- Calculating sales pipeline values from multiple regional sales sheets
- Tracking percent completion across multiple projects for an executive portfolio dashboard
- Consolidating project health statuses into a single dashboard
- Summing hours worked across multiple projects to see the total work
- Calculating resource utilization rates and overallocation risks
Core features of Smartsheet you’ll like
- Resource management to allocate resources effectively across projects with heatmaps and project/cross-project views
- Budget management to create and track project budgets by time, currency or expense and monitor cost thresholds
- Analytics & Reporting with real-time dashboards, consolidated data, and shareable reports for the right insights at the right time
- Workflow Automation to quickly implement powerful automated workflows that eliminate repetitive manual tasks
- Integrations with popular apps like Slack, Google Workspace, Jira, and Microsoft Teams to bring all information into Smartsheet
- Templates for common project types like agile projects with Gantt, project management office, budgets, tracking, and more
Pricing
Smartsheet has three plans with custom pricing:
- Free
- Pro: $7 per user per month
- Business: $25 per user per month
- Enterprise: customized enterprise pricing
Simplify project management with Scoro
Each of these tools simplifies project management in a unique way, and Scoro is no exception. It’s the best project management tool for agencies and consultancies that need an all-in-one solution to manage their projects, teams, and tasks.
A 360-degree view of all your projects—that’s Scoro. Sign up for a free trial and discover how Scoro can streamline your project management processes.